. 2015 Aug 11:5:12806.
doi: 10.1038/srep12806.

An advanced draft genome assembly of a desi type chickpea (Cicer arietinum L.)

Affiliations

An advanced draft genome assembly of a desi type chickpea (Cicer arietinum L.)

Sabiha Parween et al. Sci Rep. .

Abstract

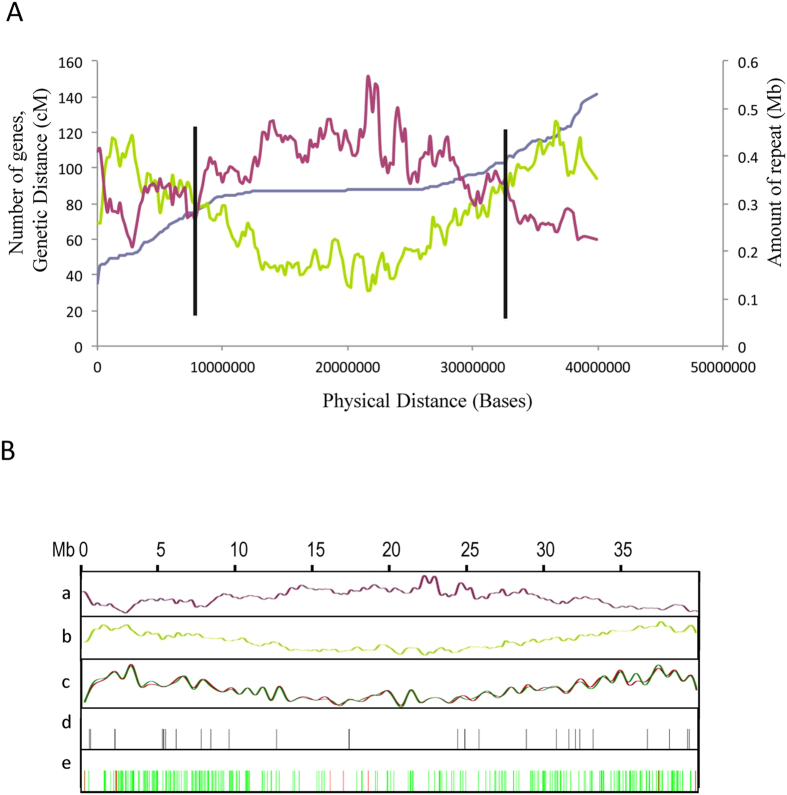
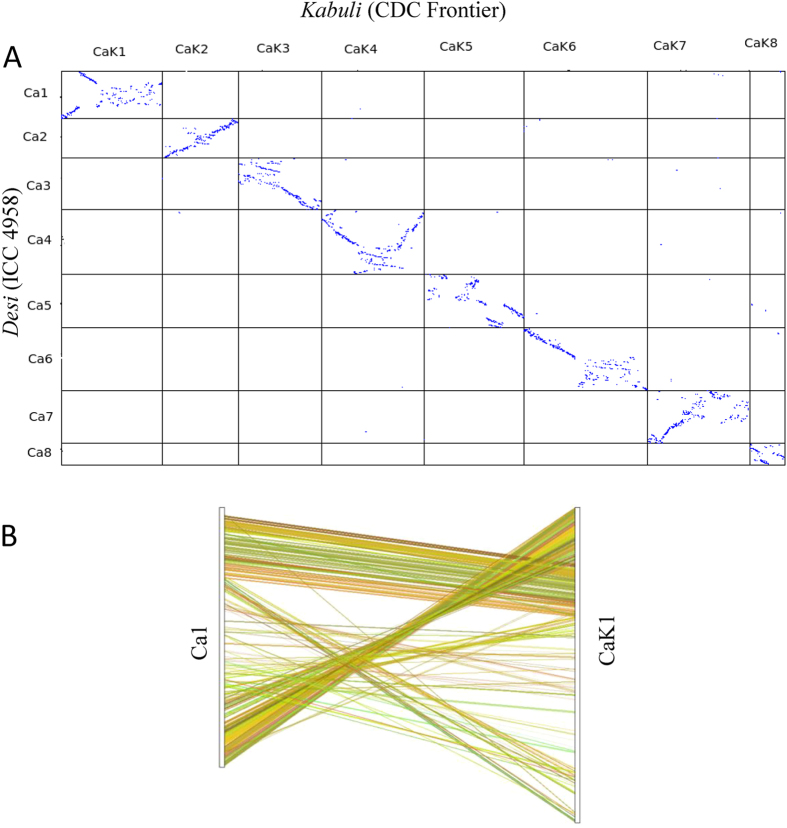
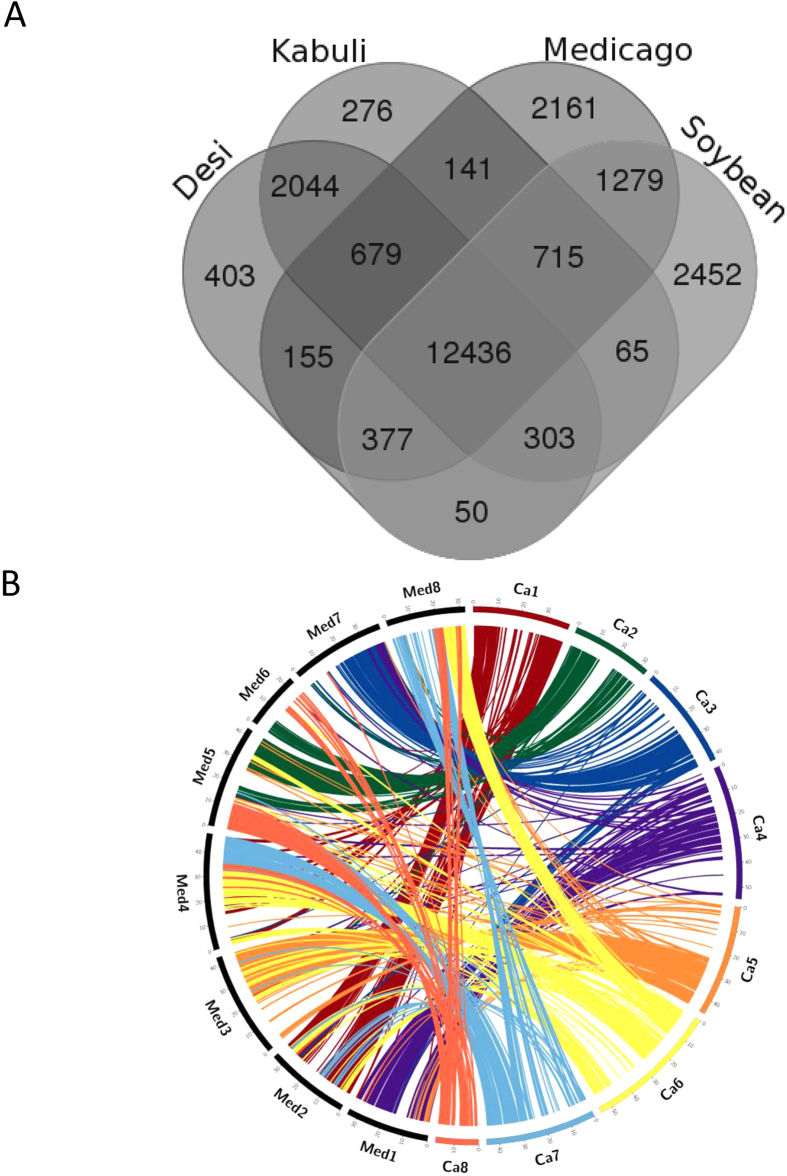
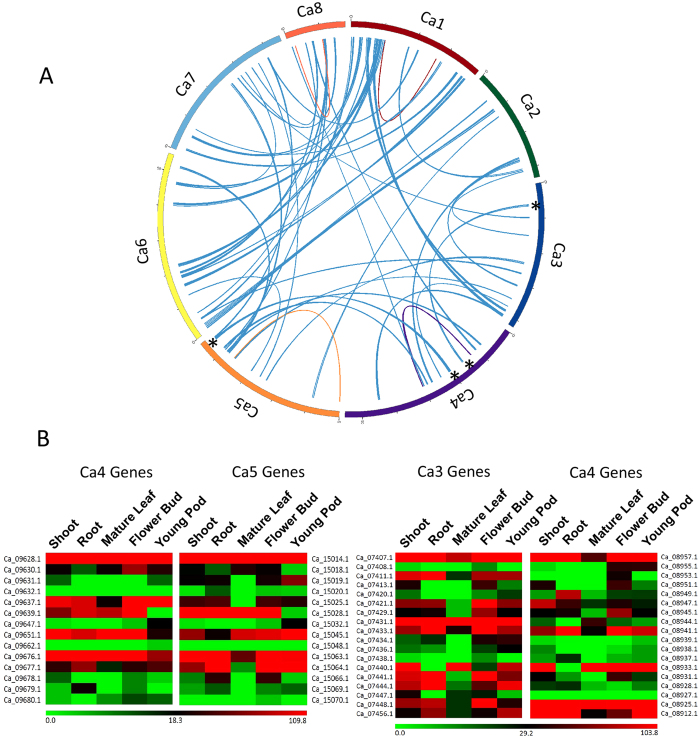
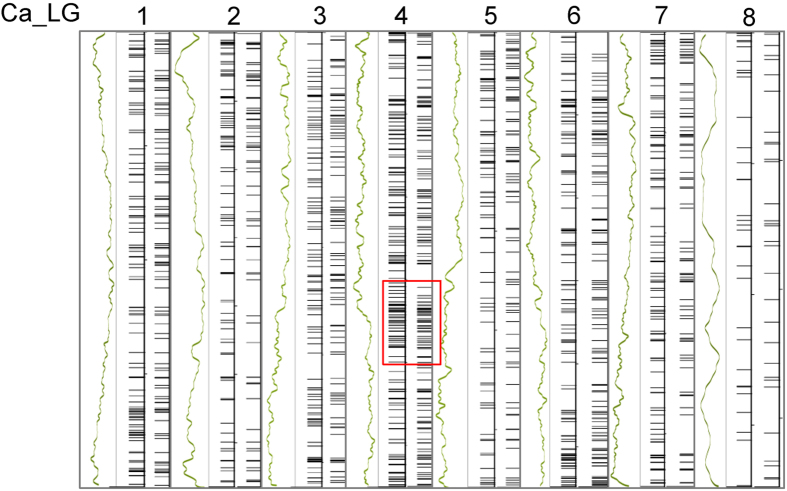
Chickpea (Cicer arietinum L.) is an important pulse legume crop. We previously reported a draft genome assembly of the desi chickpea cultivar ICC 4958. Here we report an advanced version of the ICC 4958 genome assembly (version 2.0) generated using additional sequence data and an improved genetic map. This resulted in 2.7-fold increase in the length of the pseudomolecules and substantial reduction of sequence gaps. The genome assembly covered more than 94% of the estimated gene space and predicted the presence of 30,257 protein-coding genes including 2230 and 133 genes encoding potential transcription factors (TF) and resistance gene homologs, respectively. Gene expression analysis identified several TF and chickpea-specific genes with tissue-specific expression and displayed functional diversification of the paralogous genes. Pairwise comparison of pseudomolecules in the desi (ICC 4958) and the earlier reported kabuli (CDC Frontier) chickpea assemblies showed an extensive local collinearity with incongruity in the placement of large sequence blocks along the linkage groups, apparently due to use of different genetic maps. Single nucleotide polymorphism (SNP)-based mining of intra-specific polymorphism identified more than four thousand SNPs differentiating a desi group and a kabuli group of chickpea genotypes.


Figures

Figure 1
Figure 1. Multi-dimensional topography of chickpea linkage group 1.
(A) Pericentromeric region of linkage group 1 was identified based on comparison of physical distance (X-axis) with gene density (green line, left Y-axis), repeat density (maroon line, right Y-axis) and average genetic distance (purple line, Y-axis). Vertical bars indicate positions of transition from euchromatic arms to pericentromeric arms. (B) Distribution of repeats (a), genes (b), RNAseq reads from vegetative tissues (young root and shoot, matured leaf) (green) and reproductive tissues (flower, young pod) (red) (c), microRNA loci (d), gene models encoding transcription factors (green) and R-genes (red) (e). All measurements are performed in 1 Mb sliding window increasing every 200 kb (other LGs are shown in supplementary figure S4).
Figure 2
Figure 2. Comparison of desi and kabuli chickpea genome assemblies.
(A) A dot-plot matrix comparing the desi (ICC 4958) and the kabuli (CDC Frontier) draft assemblies of the pseudomolecules corresponding to each linkage group. Pairwise comparison of all the pseudomolecules of desi (Ca1-Ca8) and kabuli (CaK1-CaK8) chickpea draft genome assemblies were performed using synteny blocks and anchor filtering algorithms of tool SyMap v4.0. (B) Pairwise collinearity analysis of orthologous genes present in linkage group 1 of desi (Ca1) and kabuli (CaK1) draft assemblies. Analysis was performed using default parameters of tool MCScanX. Comparison of other LGs is shown in supplementary figure S6.
Figure 3
Figure 3. Comparative features of chickpea protein-coding genes.
(A). Venn diagram showing distribution of gene families among desi (ICC 4958) and kabuli (CDC Frontier) type chickpea, Medicago truncatula and soybean. (B). Circos diagram presenting syntenic relationship between chickpea (Ca) and Medicago truncatula (Mt) pseudomolecules. Mt pseudomolecules are shown in black and labeled as Med1–5. Chickpea pseudomolecules are labeled in different colours and labeled as Ca1-8. Colinear blocks are coloured according to the colour of the corresponding chickpea pseudomolecule.
Figure 4
Figure 4. Whole genome duplication and functional diversification analyses.
(A). Duplicated blocks in desi chickpea genome. All eight linkage groups are shown in different colours. The inter-linkage group blocks are shown in blue connecting lines and the intra-linkage group blocks are marked by connecting lines of same colour of the linkage groups. (B). Heatmap showing expression of genes present in the paralogous blocks (marked by * in fig. 4A) in various tissue samples. Gene IDs and tissues are mentioned at the top and sides, respectively. Corresponding linkage group numbers are mentioned at the top. The colour scale represents the number of unique reads mapped per million reads (RPM) values.
Figure 5
Figure 5. Distribution of SNPs within the desi group (39 desi genotypes) and the kabuli group (53 kabuli genotypes) of chickpea along the pseudomolecules (Ca_LG1-8).
Distribution of genes (green) is followed by the SNPs within the desi group and the kabuli group of chickpea geneotypes, respectively. Red rectangle denotes genomic region with maximum variation in chickpea genotypes.

References

    1. Redden R. J. & Berger J.D. Chickpea breeding and management: history and origin of chickpea. (CAB International, Oxfordshire, UK, 2007).
    1. Abbo S., Berger J. D. & Turner N. C. Evolution of cultivated chickpea: four bottlenecks limit diversity and constrain adaptation. Funct. Plant Biol. 30, 1081–1087 (2003). - PubMed
    1. Abbo S., Stienberg D., Lichtenzveig J., Lev-Yadun S. & Gopher A. The chickpea summer cropping, and a new model for pulse domestication in the ancient near East. Quant. Rev. Biol. 78, 435–448 (2003). - PubMed
    1. Arnon I. Crop Production in Dry Regions, Vol I (Leonard Hill, London, UK, 1972).
    1. FAOSTAT. Faostat.fao.org/site/567/DesktopDefault.aspx?PageID=567anchor (2009).

Publication types

LinkOut - more resources