. 2015 Oct 15;593(20):4531-48.
doi: 10.1113/JP271102. Epub 2015 Sep 13.

Membrane potential governs calcium influx into microvascular endothelium: integral role for muscarinic receptor activation

Affiliations

Membrane potential governs calcium influx into microvascular endothelium: integral role for muscarinic receptor activation

Erik J Behringer et al. J Physiol. .

Abstract

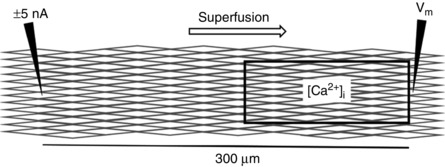
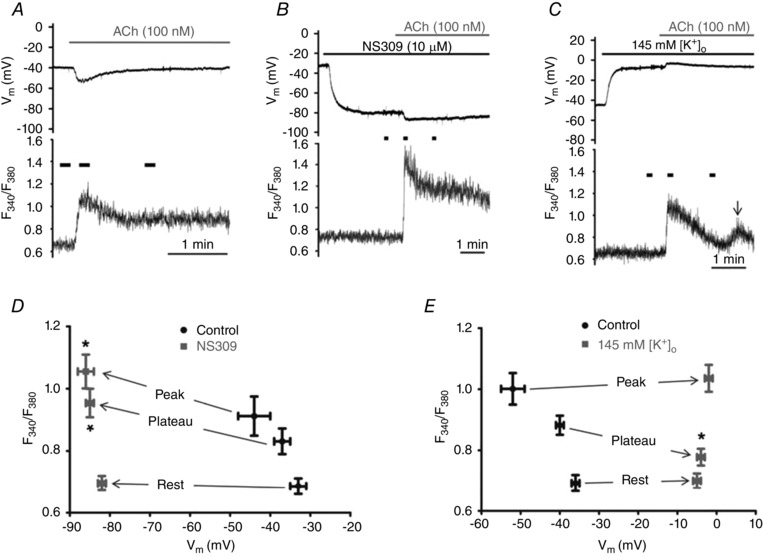
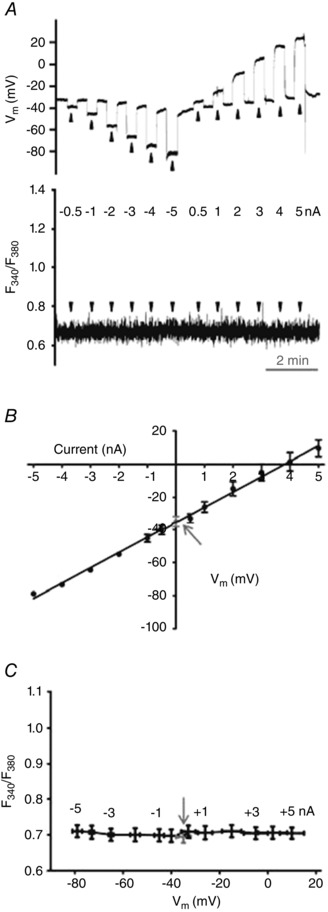
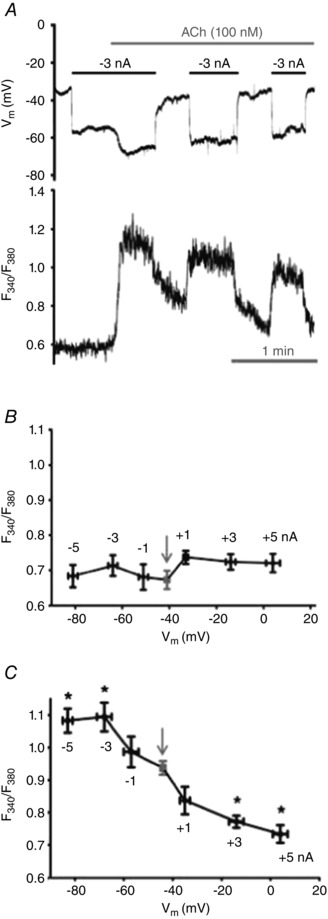
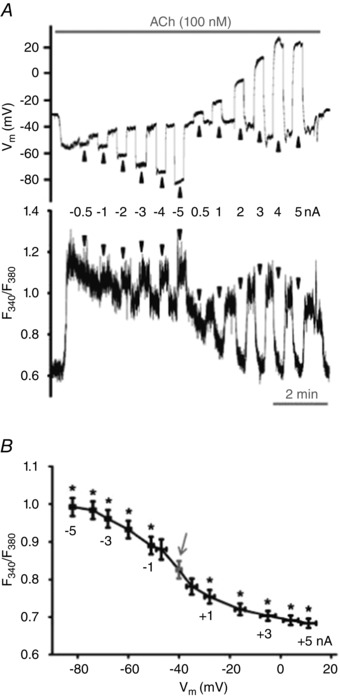
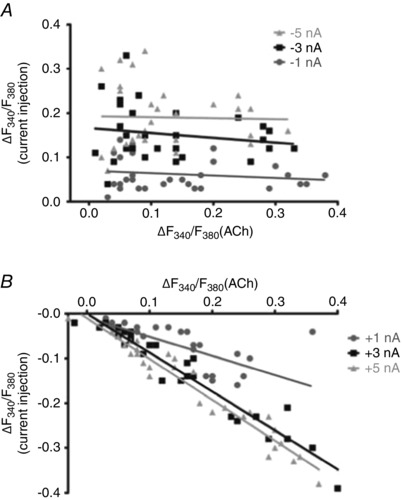
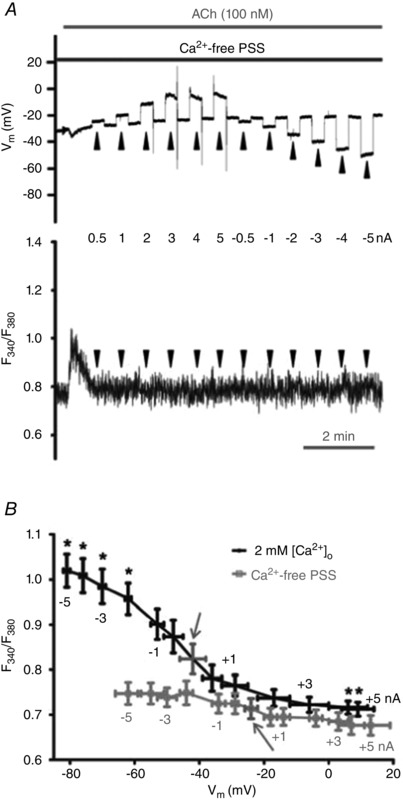
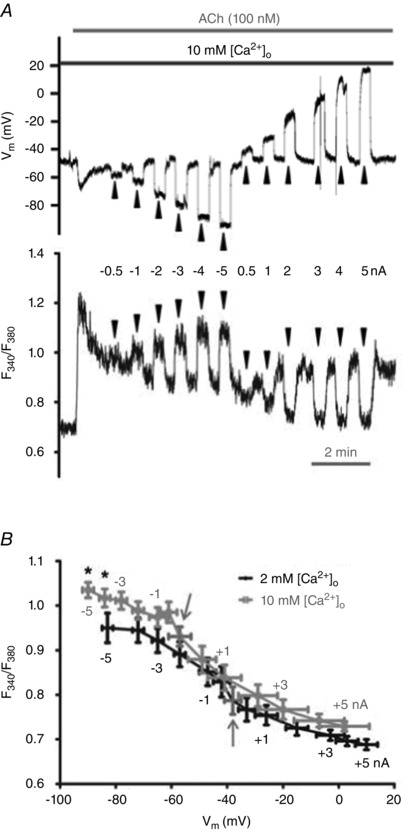
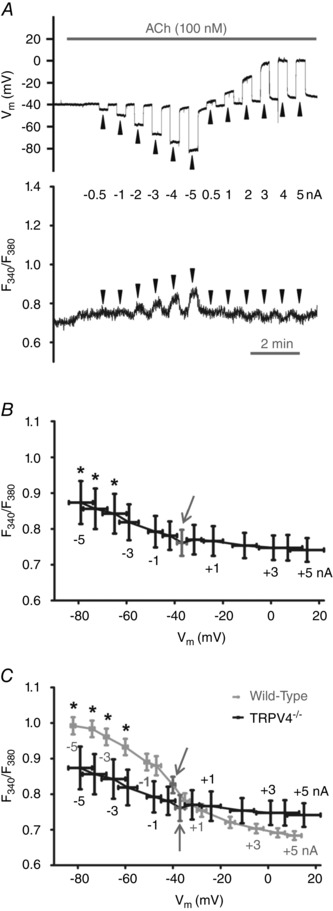
In resistance arteries, coupling a rise of intracellular calcium concentration ([Ca(2+)]i) to endothelial cell hyperpolarization underlies smooth muscle cell relaxation and vasodilatation, thereby increasing tissue blood flow and oxygen delivery. A controversy persists as to whether changes in membrane potential (V(m)) alter endothelial cell [Ca(2+)]i. We tested the hypothesis that V(m) governs [Ca(2+)]i in endothelium of resistance arteries by performing Fura-2 photometry while recording and controlling V(m) of intact endothelial tubes freshly isolated from superior epigastric arteries of C57BL/6 mice. Under resting conditions, [Ca(2+)]i did not change when V(m) shifted from baseline (∼-40 mV) via exposure to 10 μM NS309 (hyperpolarization to ∼-80 mV), via equilibration with 145 mm [K(+)]o (depolarization to ∼-5 mV), or during intracellular current injection (±0.5 to 5 nA, 20 s pulses) while V(m) changed linearly between ∼-80 mV and +10 mV. In contrast, during the plateau (i.e. Ca(2+) influx) phase of the [Ca(2+)]i response to approximately half-maximal stimulation with 100 nm ACh (∼EC50), [Ca(2+)]i increased as V(m) hyperpolarized below -40 mV and decreased as V(m) depolarized above -40 mV. The magnitude of [Ca(2+)]i reduction during depolarizing current injections correlated with the amplitude of the plateau [Ca(2+)]i response to ACh. The effect of hyperpolarization on [Ca(2+)]i was abolished following removal of extracellular Ca(2+), was enhanced subtly by raising extracellular [Ca(2+)] from 2 mm to 10 mm and was reduced by half in endothelium of TRPV4(-/-) mice. Thus, during submaximal activation of muscarinic receptors, V(m) can modulate Ca(2+) entry through the plasma membrane in accord with the electrochemical driving force.


Figures

Figure 1
Figure 1
Diagram of simultaneous [Ca2+]i and Vm measurements in an endothelial tube A window 140 μm × 50 μm (encompassing ∼50 ECs) monitored [Ca2+]i using Fura‐2 dye photometry. For simultaneous measurements, the window was located adjacent to a microelectrode recording V m (right) located 300 μm from a microelectrode injecting current (−5 to +5 nA; left) to control (i.e. clamp) V m at a designated level.
Figure 2
Figure 2
Effects of 10 μm NS309 and 145 mm [K+]o on Vm and [Ca2+]i before and during stimulation with ACh A, simultaneous V m (top) and F 340/F 380 (bottom) recordings during 100 nm ACh under control conditions. B, as in A with 10 μm NS309 pretreatment (2 min) to activate SKCa/IKCa preceding ACh. Top: note hyperpolarization to ∼80 mV with NS309; ACh increased V m to ∼−85 mV. Bottom: note lack of F 340/F 380 response until ACh is introduced. C, as in A with 145 mm [K+]o pretreatment for 2 min. Depolarization to ∼−5 mV had no effect on F 340/F 380 until the addition of ACh. Note diminished F 340/F 380 during plateau phase versus control (compare with A). Arrow indicates a transient secondary rise in F 340/F 380 ∼2 min after initial peak response to ACh. Short horizontal bars above F 340/F 380 traces (bottom panels of A–C) indicate periods of data acquisition for Rest, Peak and Plateau (90 s after Peak) values, respectively; note difference in time scales. D, summary of F 340/F 380 at corresponding V m before (Rest) and during ACh (Peak and Plateau) for paired experiments before and during NS309 (n = 10 endothelial tubes from 10 mice). E, as in D for paired experiments during ACh alone and during ACh with 145 mm [K+]o (n = 9 endothelial tubes from 9 mice). *P < 0.05, NS309 or 145 mm KCl versus respective Control values.
Figure 3
Figure 3
Changing Vm with current injection does not alter resting [Ca2+]i A, simultaneous V m (top) and F 340/F 380 (bottom) recordings during control conditions at rest (V m, −35 ± 3 mV; F 340/F 380, 0.69 ± 0.02) and during current injection (−5 to +5 nA; 20 s pulses at arrowheads). While V m (top) responded in a stepwise manner F 340/F 380 (bottom) did not change. B, linear regression of V m versus injected current (r 2 = 0.990 ± 0.002). C, summary data illustrating stability of F 340/F 380 throughout range of V m during respective levels of current injection (shown near data points for reference). Arrows in B and C indicate resting V m and F 340/F 380, respectively. Summary data binned according to level of current injection for n = 7 endothelial tubes from 6 mice.
Figure 4
Figure 4
Changing Vm with intracellular current injection alters [Ca2+]i only during stimulation with ACh A, simultaneous recordings of V m (top) and F 340/F 380 (bottom) with −3 nA current pulses before and during 100 nm ACh. Note lack of effect of hyperpolarization on [Ca2+]i until ACh is introduced. B, summary of F 340/F 380 values at designated values of V m throughout levels of current injection (shown near data points) prior to ACh. Resting F 340/F 380 was not altered from control (arrow) while V m ranged from −82 ± 2 mV to 4 ± 3 mV. C, summary of F 340/F 380 values at designated values of V m throughout range of current injection during plateau of [Ca2+]i response to ACh; one current level studied during each ACh stimulation. *P < 0.05, F 340/F 380 during current injection versus zero current (arrow; elevated F 340/F 380 versus B due to ACh). Summary data in B and C binned according to level of current injection for n = 6–7 endothelial tubes from 6–7 mice.
Figure 5
Figure 5
[Ca2+]i changes with Vm during stimulation with ACh A, simultaneous V m (top) and F 340/F 380 (bottom) recordings during current injection (−5 to +5 nA; 20 s pulses at arrowheads) during 100 nm ACh. B, summary of F 340/F 380 values for corresponding values of V m at rest (arrow) and during 100 nm ACh; data binned according to level of current injection (shown near data points). This relationship is sigmoidal (R 2 = 0.974 ± 0.005) with V m at half‐maximal F 340/F 380 = −44 ± 2 mV. Note increase in F 340/F 380 with magnitude of hyperpolarization and decrease in F 340/F 380 (to baseline levels) as V m approximates 0 mV. Summary data represent n = 30 endothelial tubes from 25 mice. *P < 0.05, F 340/F 380 during current injection versus F 340/F 380 without current injection (arrow).
Figure 6
Figure 6
Plateau [Ca2+]i responses to ACh correlate with [Ca2+]i responses to depolarization A, scatter plot illustrating magnitude of ∆F 340/F 380 during negative current injections of −1, −3 and −5 nA during the plateau ∆F 340/F 380 response to 100 nm ACh (Y‐axis) versus the plateau ∆F 340/F 380 response (from resting baseline) to 100 nm ACh (X‐axis). Note lack of correlation (R 2 < 0.035). B, as in A during positive current injections of +1, +3 and +5 nA. Note negative correlations between the decreased [Ca2+]i during depolarization and the plateau [Ca2+]i response to ACh (R 2 > 0.55). Individual data points correspond to summary data in Fig. 5 B.
Figure 7
Figure 7
[Ca2+]i responses to changing Vm during stimulation with ACh require extracellular Ca2+ A, simultaneous V m (top) and F 340/F 380 (bottom) recordings during current injection (−5 to +5 nA; 20 s pulses at arrowheads) during 100 nm ACh in Ca2+‐free PSS. Note absence of sustained elevation (i.e. plateau phase) in [Ca2+]i response. B, overlay of summary data for F 340/F 380 values at corresponding levels of V m (binned according to level of current injection) during 100 nm ACh with 2 mm [Ca2+]o and with Ca2+‐free PSS. Arrows indicate V m and F 340/F 380 under respective conditions with zero current. Summary data are paired experiments for n = 8 endothelial tubes from 8 mice. *P < 0.05, F 340/F 380 during current injection versus F 340/F 380 with zero current.
Figure 8
Figure 8
Increasing [Ca2+]o increases [Ca2+]i with maximal hyperpolarization during stimulation with ACh A, simultaneous V m (top) and F 340/F 380 (bottom) recordings during current injection (−5 to +5 nA; 20 s pulses at arrowheads) during 100 nm ACh; [Ca2+]o = 10 mm. B, overlay of summary data for F 340/F 380 values at corresponding levels of V m (binned according to level of current injection). Arrows indicate V m and F 340/F 380 during plateau response to ACh with zero current. Summary data are paired experiments for n = 10 endothelial tubes from 10 mice. *P < 0.05, F 340/F 380 during 10 mm [Ca2+]o versus 2 mm [Ca2+]o.
Figure 9
Figure 9
Lack of TRPV4 expression attenuates Ca2+ influx with hyperpolarization during stimulation with ACh A, simultaneous V m (top) and F 340/F 380 (bottom) recordings in the presence of 100 nm ACh during current injection (alternating 20 s pulses at arrowheads) in endothelial tube from a TRPV4−/− mouse. B, summary data for F 340/F 380 at corresponding V m (binned according to level of current injection) during 100 nm ACh in endothelial tubes from TRPV4−/− mice. *P < 0.05, F 340/F 380 during current injection versus no current injection (arrow). Data represent 8 endothelial tubes from 5 TRPV4−/− mice. C, overlay of summary data from B with data from wild‐type (C57BL/6) mice (from Fig. 5 B) at corresponding levels of V m and current injection (all experiments with [Ca2+]o = 2 mm). Arrows indicate values with zero current. *P < 0.05, F 340/F 380 of wild‐type versus TRPV4−/− at given level of current injection.

References

    1. Bagher P, Beleznai T, Kansui Y, Mitchell R, Garland CJ & Dora KA (2012). Low intravascular pressure activates endothelial cell TRPV4 channels, local Ca2+ events, and IKCa channels, reducing arteriolar tone. Proc Natl Acad Sci USA 109, 18174–18179. - PMC - PubMed
    1. Bagher P & Segal SS (2011). Regulation of blood flow in the microcirculation: role of conducted vasodilation. Acta Physiol (Oxf) 202, 271–284. - PMC - PubMed
    1. Behringer EJ & Segal SS (2012. a). Spreading the signal for vasodilatation: implications for skeletal muscle blood flow control and the effects of ageing. J Physiol 590, 6277–6284. - PMC - PubMed
    1. Behringer EJ & Segal SS (2012. b). Tuning electrical conduction along endothelial tubes of resistance arteries through Ca2+‐activated K+ channels. Circ Res 110, 1311–1321. - PMC - PubMed
    1. Behringer EJ, Shaw RL, Westcott EB, Socha MJ & Segal SS (2013). Aging impairs electrical conduction along endothelium of resistance arteries through enhanced Ca2+‐activated K+ channel activation. Arterioscler Thromb Vasc Biol 33, 1892–1901. - PMC - PubMed

Publication types

MeSH terms

LinkOut - more resources