. 2016 Apr;27(4):1015-28.
doi: 10.1681/ASN.2015010060. Epub 2015 Aug 10.

A Quantitative Approach to Screen for Nephrotoxic Compounds In Vitro

Affiliations

A Quantitative Approach to Screen for Nephrotoxic Compounds In Vitro

Melanie Adler et al. J Am Soc Nephrol. 2016 Apr.

Abstract

Nephrotoxicity due to drugs and environmental chemicals accounts for significant patient mortality and morbidity, but there is no high throughput in vitro method for predictive nephrotoxicity assessment. We show that primary human proximal tubular epithelial cells (HPTECs) possess characteristics of differentiated epithelial cells rendering them desirable to use in such in vitro systems. To identify a reliable biomarker of nephrotoxicity, we conducted multiplexed gene expression profiling of HPTECs after exposure to six different concentrations of nine human nephrotoxicants. Only overexpression of the gene encoding heme oxygenase-1 (HO-1) significantly correlated with increasing dose for six of the compounds, and significant HO-1 protein deregulation was confirmed with each of the nine nephrotoxicants. Translatability of HO-1 increase across species and platforms was demonstrated by computationally mining two large rat toxicogenomic databases for kidney tubular toxicity and by observing a significant increase in HO-1 after toxicity using an ex vivo three-dimensional microphysiologic system (kidney-on-a-chip). The predictive potential of HO-1 was tested using an additional panel of 39 mechanistically distinct nephrotoxic compounds. Although HO-1 performed better (area under the curve receiver-operator characteristic curve [AUC-ROC]=0.89) than traditional endpoints of cell viability (AUC-ROC for ATP=0.78; AUC-ROC for cell count=0.88), the combination of HO-1 and cell count further improved the predictive ability (AUC-ROC=0.92). We also developed and optimized a homogenous time-resolved fluorescence assay to allow high throughput quantitative screening of nephrotoxic compounds using HO-1 as a sensitive biomarker. This cell-based approach may facilitate rapid assessment of potential nephrotoxic therapeutics and environmental chemicals.

Keywords: acute renal failure; nephrotoxicity; tubule cells.


Figures

Figure 1.
Figure 1.
Human proximal tubular epithelial cells (HPTECs) demonstrate a well-defined differentiated phenotype resembling human proximal tubule kidney cells. (A) Immunohistochemical staining (green) of a representative cell monolayer, seeded on glass slides, shows expression of cytokeratin 18, zonula occludens-1, N-cadherin and E-cadherin proteins (Original magnification, ×40). DAPI was used to counterstain nuclei and is merged with indicated immunofluorescence staining. (B) Semiquantitative PCR gel for proximal tubule-specific genes such as kidney-specific cadherin (356 bp), megalin (296 bp), aquaporin-1 (365 bp), MRP2 (356 bp), MDR1 (251 bp), organic cation transporter 2 (217 bp). Glyceraldehyde-3-phosphate dehydrogenase was used as a loading control (GAPDH, 197 bp). PCR was performed on RNA isolated from HPTECs grown on 12-well plates in two independent experiments cultured up to 10 d and four different passages. RNA from HK2 cells and human kidney were used as comparators. (C) Cells develop a transepithelial electrical resistance (TEER) when cultured on transwell-24 support with an initial density of 25,000 cells/filter. TEER increases to a maximum of 55.07±2.7Ω cm2 in 7 d. (D) Cumulative uptake of [14C]-sucrose via the apical (A) to basolateral (B) or B to A directions was measured after 7, 15, 30, and 60 min. Similar B–A sucrose flux was observed in cells grown on transwell filters and well plate. (E) Rhodamine 123 (Rho123), a fluorescent dye, was used to measure MDR1 activity. The significant decrease in Rho123 fluorescence was determined after incubation with 0.5 µg/ml for 2 h by flow cytometry over a period of 60 min. (F) Cells show dose and time-dependent uptake of a fluorescent glucose substrate (2-NBDG) and inhibition assays suggest activity of Na+-dependent glucose transport (SGLT inhibition with phlorizin) as well as Na+-independent (GLUT inhibition with cytochalasin B). (G) Effect of cadmium chloride on the γ-glutamyl transferase (GGT) activity and glutathione (GSH) levels in HPTECs. (H) Activity and functionality of mitochondria in HPTECs is shown after perturbation with carbonyl cyanide m-chlorophenyl hydrazone (CCCP) (decreases MMP without induction of ROS), and oligomycin A (induces ROS without loss of MMP). Data corresponds to the mean±SEM from three independent experiments performed in triplicate (*P<0.05 compared with control).
Figure 2.
Figure 2.
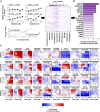
HMOX1 differential expression is positively correlated with doses across the highest number of compounds. High throughput gene expression profiling based on the measurement of 1000 genes was performed in human proximal tubular epithelial cells (HPTECs) exposed to a discovery panel of 10 compounds in six different concentrations for 3, 6, 12, and 24 h. (A) For each time point, we calculated the Spearman’s correlation between the six doses and the fold change in mRNA for each gene. A representative example is shown for HMOX1 and cisplatin. The sum of square of the four correlation values is compared with the distribution of values with random data to yield a P value for each pair of gene and compound. Results are shown in a heat map. (B) Based on a cutoff of false discovery rate of 0.05, we ordered genes based on the number of compounds for which gene expression is significantly correlated with dose. HMOX1 is identified as the top gene showing a dose-dependent correlation in six of the nine toxic compounds. Color intensity reflects the average P value for significantly correlated toxicants (the darker, the more significant). (C) Dose and time dependent fold change of gene expression (z-scored for each gene) for the top four genes of across all 10 compounds. Compounds are ordered for each gene based on the P value of the correlation. A black line separates the compounds with significant correlations from the others, while carboplatin is shown on the right as it serves as a nontoxic control. In addition to HMOX1, an early stress response protein, genes associated with growth arrest and DNA damage (GADD45A), transcriptional regulation of TNF (ZFP36) and apoptosis (PMAIP1) were found to be significantly upregulated in five of nine compounds. Gene expression changes were calculated as mean compared with 0.1% DMSO controls (n=4).
Figure 3.
Figure 3.
Induction of HO-1 protein in response to nephrotoxic compounds correlates with mRNA expression in human proximal tubular epithelial cells (HPTECs). (A) Changes of HO-1 at mRNA and protein levels measured by ELISA, quantitative RT-PCR, and immunostaining in HPTECs after incubation with model compounds of the discovery panel for 24 h. HO-1 protein and mRNA expression was measured in cell lysates of HPTECs cultured and treated in 6-well plates in triplicate in three independent experiments. Results are presented as mean±SEM (n=3). *P<0.05. Staining of HO-1 (green) was performed in cells seeded on 8-well collagen-coated glass-well chamber slides (Original magnification, ×40). Representative images are shown for the highest concentration of each compound. (B) Modulation of cellular HO-1 does not exclusively correlate with increase in ROS. ROS was quantified using CellROX dye and fluorescence intensity was calculated as fold change compared with 0.5% DMSO control.
Figure 4.
Figure 4.
Increase of HO-1 expression in rats and 3D human kidney microfluidic systems following renal injury. (A) Normalized expression intensity of HMOX1 and HAVCR1 in samples positive (+) for tubular necrosis is higher than samples negative (–) for tubule necrosis in the in vivo toxicogenomic databases (DrugMatrix and Toxicogenomics Project-Genomics Assisted Toxicity Evaluation System (TG-GATES)). Each data point represents intensity for a given sample. The bounding box extends from the first to third quartiles, with the central bar indicating the median intensity. Whiskers extend from the ends of the box to the outermost data point that falls within the third quartile+1.5×(interquartile range) and first quartile–1.5×(interquartile range), or to the end of the range. Data points are jittered. (B) Schematic diagram depicting concept of human kidney-on-a-chip. Human proximal tubule epithelial cells (HPTECs) form a confluent tubule in the chip as depicted by the phase contrast of cells and DAPI fluorescent imaging of nuclei. Exposure of HPTECs in the chips with 25 µM CdCl2 for 48 h resulted in an upregulation of HO-1 depicted by the FITC fluorescent stain. Control devices showed minimal expression of HO-1. KIM-1 expression, absent in untreated devices, marginally increased in response to cadmium chloride in two of four devices.
Figure 5.
Figure 5.
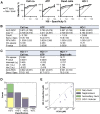
Comparison of HO-1 as biomarker for kidney injury with known cell viability/cell death assays. Predictive value of four different assays (cell number [DAPI nuclear stain], ATP concentration [CellTiter Glo], dead cell number [TOTO-3 stain], and HO-1 concentration [immunofluorescence stain]) across 39 compounds of the validation panel (eight non-nephrotoxic, 24 directly nephrotoxic (proximal tubule (PT)), and seven indirectly nephrotoxic (via secondary mechanisms)). (A) Receiver-operator characteristic curves computed either just for PT toxic drugs (black line) or also including indirect nephrotoxicants (gray line). (B) Table displays area under the curve receiver-operator characteristic curves (AUC-ROC) both for PT toxic drugs only and when indirect nephrotoxicants are included (in brackets). Maximal Youden index is calculated as sensitivity (%)+specificity (%)–100 and was used to determine the optimal cutoff point for each assay where sensitivity and specificity are maximal. Applying this cutoff, sensitivity was calculated by dividing the number of true positive toxicants (TP) by the number of total toxicants in the validation panel. Specificity was calculated by dividing the number of true negative nontoxicants (TN) by the number of total nontoxicants in the set. The positive predictive value is defined as the ratio of TP to all compounds identified as toxic and the negative predictive value is calculated as the ratio of TN to all compounds identified as nontoxic. Chi-squared test statistic and corresponding P value describe the goodness of fit of the observed distribution (measured results in the respective assays) to the theoretical one (toxic or nontoxic). (C) Improvement of predictivity via combination of cell death/viability assays with HO-1 was calculated using logistic regression. A combined output was calculated as αo+α1*value assay 1(HO-1)+α2*value assay 2. The final AUC-ROC were calculated using the combined output values both for PT toxic drugs only and when indirect nephrotoxicants are included (in brackets). (D) Assay response category (based on dose-response curves of HO-1 fold change and cell number) versus clinical toxicity classification. Each bar represents one assay response category; the colored segments correspond to clinical toxicity classes. Curcumin, a known nontoxic HO-1 inducer, is included for reference. (E) Scatter plot of CHO-1 (drug concentration at significant HO-1 induction) versus IC25 (drug concentration at 25% decrease in cell number). Observe that most drugs show significant HO-1 induction at a concentration an order of magnitude or more below the IC25. Each compound was tested in eight concentrations, starting from 0.1 µM to 554 µM for 24 h (n=4).
Figure 6.
Figure 6.
Development and evaluation of an homogeneous time resolved fluorescence (HTRF) assay for quantification of HO-1 in a high throughput manner. (A) Scheme of the experimental procedure of HO-1 HTRF assay performed in 384-well plate. When the acceptor labeled antihuman HO-1 antibody and the donor labeled antibody bind to HO-1, the two dyes are brought into close proximity with each other. Excitation of the donor with a light source triggers a fluorescence resonance energy transfer (FRET) toward the acceptor and the emission fluorescence (665 nm) can be detected after incubation for 4 h. This signal is proportional to the amount of human HO-1 present in the cell lysate. (B) Assay optimization based on the signal readout included best antibody pair analysis, serial dilution of the antibodies, time-dependent FRET signal development, cell number, and conditions for lysis of human proximal tubule epithelial cells (HPTECs) using several lysate buffers. Optimized assay revealed a robust signal difference between background, negatives (medium, DMSO) and positives (gentamicin, cadmium chloride). (C) Detection of recombinant human HO-1 protein verified that the HTRF assay results are reproducible. Data are presented from eight independent experiments, measured in duplicate (mean±SD, n=8). Delta F (%) is calculated by the following formula: sample-ratio–ratio background/ratio background). (D, E) Correlation between ELISA versus HTRF, and immunofluorescence versus HTRF performed in different assay formats. (D) Fold change of HO-1 was measured in lysates of HPTECs incubated with 10 compounds in 96-well plates after 24 h (see used concentrations in Figure 3; triplicate per experiment, n=3). (E) HO-1 response was quantified in HPTECs treated with 39 compounds in four concentrations starting from 554 µM (10-fold dilution) in 384-well plate for 24 h (n=4). Results were normalized to DMSO control and plotted as mean fold change.

References

    1. Bonventre JV, Vaidya VS, Schmouder R, Feig P, Dieterle F: Next-generation biomarkers for detecting kidney toxicity. Nat Biotechnol 28: 436–440, 2010 - PMC - PubMed
    1. Soderland P, Lovekar S, Weiner DE, Brooks DR, Kaufman JS: Chronic kidney disease associated with environmental toxins and exposures. Adv Chronic Kidney Dis 17: 254–264, 2010 - PubMed
    1. Hartung T: Toxicology for the twenty-first century. Nature 460: 208–212, 2009 - PubMed
    1. Fuchs TC, Hewitt P: Biomarkers for drug-induced renal damage and nephrotoxicity – an overview for applied toxicology. AAPS J 13: 615–631, 2011 - PMC - PubMed
    1. Sun H, Xia M, Austin CP, Huang R: Paradigm shift in toxicity testing and modeling. AAPS J 14: 473–480, 2012 - PMC - PubMed

Publication types