

Genetic structure and relationships of 16 Asian and European cattle populations using DigiTag2 assay
- PMID: 26260416
- PMCID: PMC5042107
- DOI: 10.1111/asj.12416
Genetic structure and relationships of 16 Asian and European cattle populations using DigiTag2 assay
Abstract
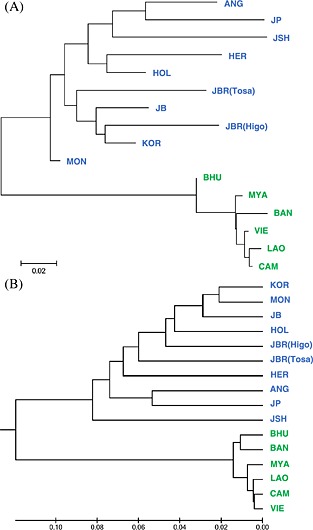
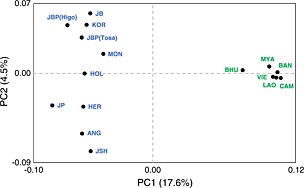
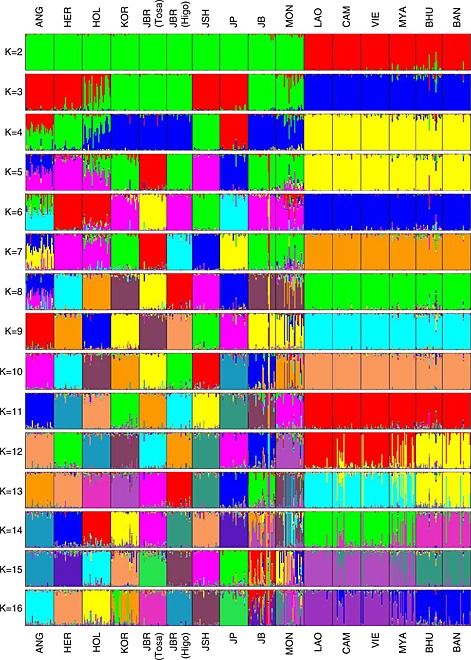
In this study, we genotyped 117 autosomal single nucleotide polymorphisms using a DigiTag2 assay to assess the genetic diversity, structure and relationships of 16 Eurasian cattle populations, including nine cattle breeds and seven native cattle. Phylogenetic and principal component analyses showed that Bos taurus and Bos indicus populations were clearly distinguished, whereas Japanese Shorthorn and Japanese Polled clustered with European populations. Furthermore, STRUCTURE analysis demonstrated the distinct separation between Bos taurus and Bos indicus (K=2), and between European and Asian populations (K=3). In addition, Japanese Holstein exhibited an admixture pattern with Asian and European cattle (K=3-5). Mongolian (K=13-16) and Japanese Black (K=14-16) populations exhibited admixture patterns with different ancestries. Bos indicus populations exhibited a uniform genetic structure at K=2-11, thereby suggesting that there are close genetic relationships among Bos indicus populations. However, the Bhutan and Bangladesh populations formed a cluster distinct from the other Bos indicus populations at K=12-16. In conclusion, our study could sufficiently explain the genetic construction of Asian cattle populations, including: (i) the close genetic relationships among Bos indicus populations; (ii) the genetic influences of European breeds on Japanese breeds; (iii) the genetic admixture in Japanese Holstein, Mongolian and Japanese Black cattle; and (iv) the genetic subpopulations in Southeast Asia.
Keywords: Asia; DigiTag2 assay; SNP; cattle; genetic structure.
© 2015 The Authors. Animal Science Journal published by Wiley Publishing Asia Pty Ltd on behalf of Japanese Society of Animal Science.
Figures
Similar articles
-
Genetic diversity and structure in Bos taurus and Bos indicus populations analyzed by SNP markers.Anim Sci J. 2010 Jun;81(3):281-9. doi: 10.1111/j.1740-0929.2010.00744.x. Anim Sci J. 2010. PMID: 20597883
-
The patterns of admixture, divergence, and ancestry of African cattle populations determined from genome-wide SNP data.BMC Genomics. 2020 Dec 7;21(1):869. doi: 10.1186/s12864-020-07270-x. BMC Genomics. 2020. PMID: 33287702 Free PMC article.
-
Allele frequencies of gene polymorphisms related to economic traits in Bos taurus and Bos indicus cattle breeds.Anim Sci J. 2011 Dec;82(6):717-21. doi: 10.1111/j.1740-0929.2011.00910.x. Epub 2011 Aug 4. Anim Sci J. 2011. PMID: 22111625
-
Physiological differences and implications to reproductive management of Bos taurus and Bos indicus cattle in a tropical environment.Soc Reprod Fertil Suppl. 2010;67:357-75. doi: 10.7313/upo9781907284991.028. Soc Reprod Fertil Suppl. 2010. PMID: 21755684 Review.
-
Metabolic and endocrine differences between Bos taurus and Bos indicus females that impact the interaction of nutrition with reproduction.Theriogenology. 2016 Jul 1;86(1):32-40. doi: 10.1016/j.theriogenology.2016.04.016. Epub 2016 Apr 21. Theriogenology. 2016. PMID: 27156680 Review.
Cited by
-
Phylogenomics and Spatiotemporal Dynamics of Bovine Leukemia Virus Focusing on Asian Native Cattle: Insights Into the Early Origin and Global Dissemination.Front Microbiol. 2022 Jun 24;13:917324. doi: 10.3389/fmicb.2022.917324. eCollection 2022. Front Microbiol. 2022. PMID: 35814709 Free PMC article.
-
New hematological key for bovine leukemia virus-infected Japanese Black cattle.J Vet Med Sci. 2018 Feb 20;80(2):316-319. doi: 10.1292/jvms.17-0455. Epub 2018 Jan 22. J Vet Med Sci. 2018. PMID: 29353857 Free PMC article.
-
An insight into the evolutionary history of Indonesian cattle assessed by whole genome data analysis.PLoS One. 2020 Nov 10;15(11):e0241038. doi: 10.1371/journal.pone.0241038. eCollection 2020. PLoS One. 2020. PMID: 33170846 Free PMC article.
-
Effect of two non-synonymous ecto-5'-nucleotidase variants on the genetic architecture of inosine 5'-monophosphate (IMP) and its degradation products in Japanese Black beef.BMC Genomics. 2017 Nov 13;18(1):874. doi: 10.1186/s12864-017-4275-4. BMC Genomics. 2017. PMID: 29132308 Free PMC article.
-
Adipogenic/lipogenic gene expression and fatty acid composition in chuck, loin, and round muscles in response to grain feeding of Yanbian Yellow cattle.J Anim Sci. 2018 Jun 29;96(7):2698-2709. doi: 10.1093/jas/sky161. J Anim Sci. 2018. PMID: 29931237 Free PMC article.
References
-
- Chen S, Lin BZ, Baig M, Mitra B, Lopes RJ, Santos AM, et al. 2010. Zebu cattle are an exclusive legacy of the South Asia neolithic. Molecular Biology and Evolution 27, 1–6. - PubMed
-
- Evanno G, Regnaut S, Goudet J. 2005. Detecting the number of clusters of individuals using the software STRUCTURE: a simulation study. Molecular Ecology 14, 2611–2620. - PubMed
Publication types
MeSH terms
LinkOut - more resources
Full Text Sources
Other Literature Sources
