

Splenic red pulp macrophages are intrinsically superparamagnetic and contaminate magnetic cell isolates
- PMID: 26260698
- PMCID: PMC4531335
- DOI: 10.1038/srep12940
Splenic red pulp macrophages are intrinsically superparamagnetic and contaminate magnetic cell isolates
Abstract
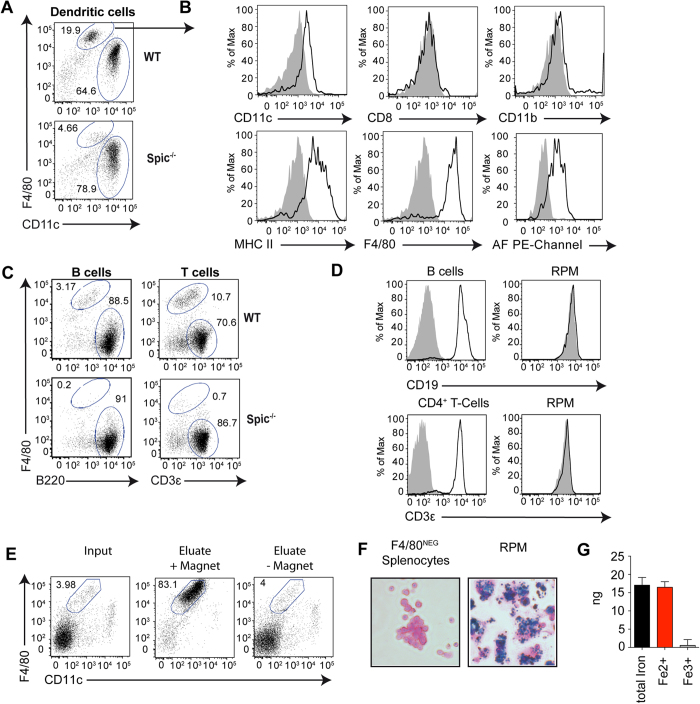
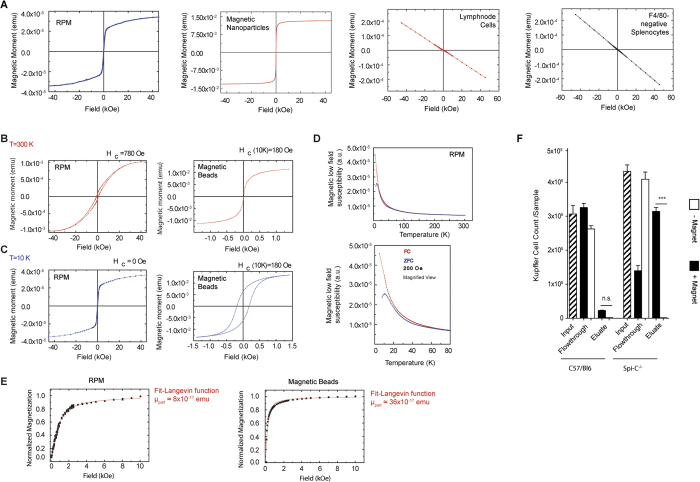
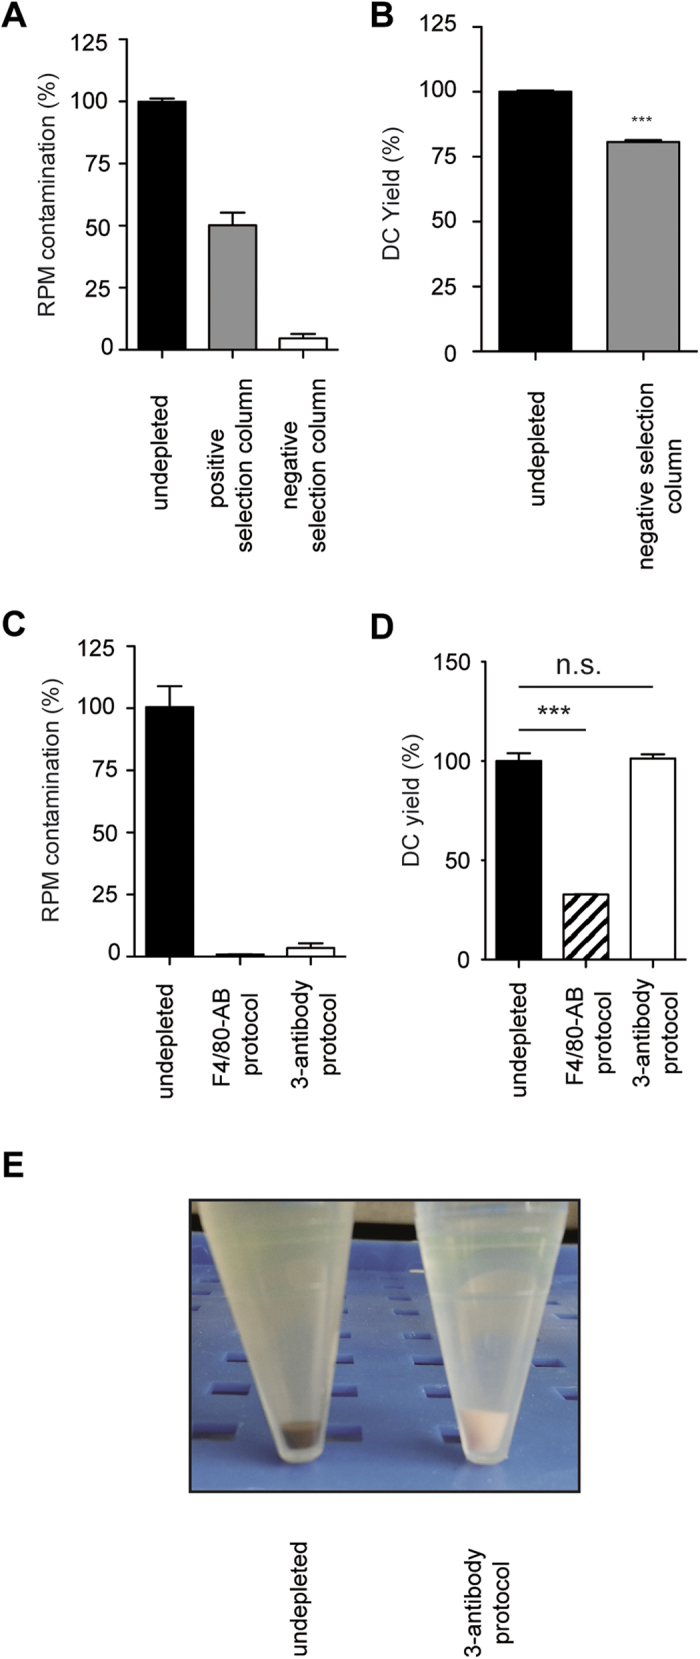
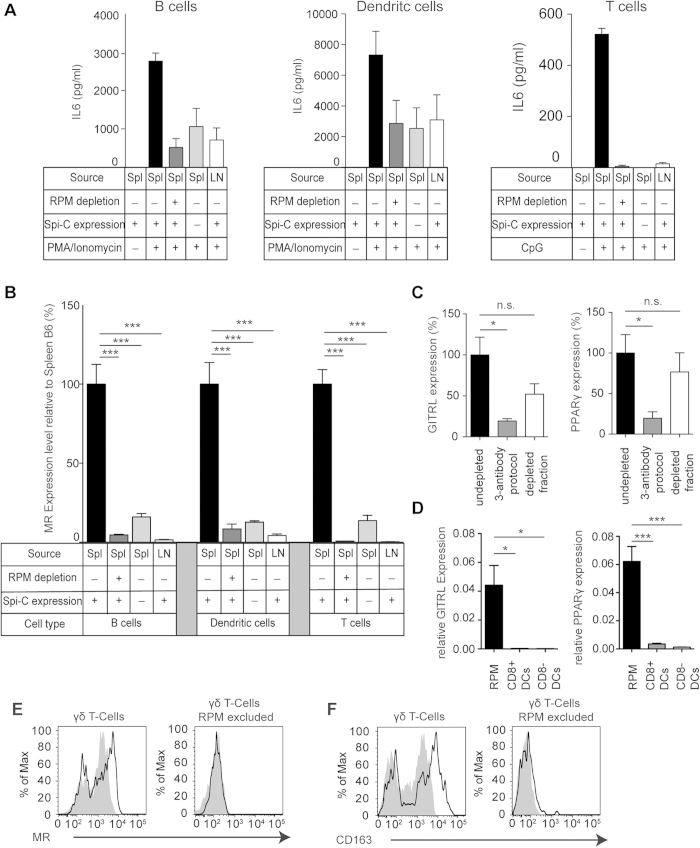
A main function of splenic red pulp macrophages is the degradation of damaged or aged erythrocytes. Here we show that these macrophages accumulate ferrimagnetic iron oxides that render them intrinsically superparamagnetic. Consequently, these cells routinely contaminate splenic cell isolates obtained with the use of MCS, a technique that has been widely used in immunological research for decades. These contaminations can profoundly alter experimental results. In mice deficient for the transcription factor SpiC, which lack red pulp macrophages, liver Kupffer cells take over the task of erythrocyte degradation and become superparamagnetic. We describe a simple additional magnetic separation step that avoids this problem and substantially improves purity of magnetic cell isolates from the spleen.
Figures
Similar articles
-
Role for Spi-C in the development of red pulp macrophages and splenic iron homeostasis.Nature. 2009 Jan 15;457(7227):318-21. doi: 10.1038/nature07472. Epub 2008 Nov 26. Nature. 2009. PMID: 19037245 Free PMC article.
-
Macrophage colony-stimulating factor is indispensable for repopulation and differentiation of Kupffer cells but not for splenic red pulp macrophages in osteopetrotic (op/op) mice after macrophage depletion.Cell Tissue Res. 2008 May;332(2):245-56. doi: 10.1007/s00441-008-0586-8. Epub 2008 Mar 12. Cell Tissue Res. 2008. PMID: 18335245
-
Corticotropin-releasing factor receptors in mouse spleen: identification of receptor-bearing cells as resident macrophages.Endocrinology. 1990 Jul;127(1):440-52. doi: 10.1210/endo-127-1-440. Endocrinology. 1990. PMID: 2163323
-
Functions and development of red pulp macrophages.Microbiol Immunol. 2015 Feb;59(2):55-62. doi: 10.1111/1348-0421.12228. Microbiol Immunol. 2015. PMID: 25611090 Review.
-
Macrophages and Iron Metabolism.Microbiol Spectr. 2016 Oct;4(5). doi: 10.1128/microbiolspec.MCHD-0037-2016. Microbiol Spectr. 2016. PMID: 27763254 Review.
Cited by
-
Splenic Capture and In Vivo Intracellular Biodegradation of Biological-Grade Graphene Oxide Sheets.ACS Nano. 2020 Aug 25;14(8):10168-10186. doi: 10.1021/acsnano.0c03438. Epub 2020 Jul 28. ACS Nano. 2020. PMID: 32658456 Free PMC article.
-
Mannose receptor induces T-cell tolerance via inhibition of CD45 and up-regulation of CTLA-4.Proc Natl Acad Sci U S A. 2016 Sep 20;113(38):10649-54. doi: 10.1073/pnas.1605885113. Epub 2016 Sep 6. Proc Natl Acad Sci U S A. 2016. PMID: 27601670 Free PMC article.
-
Multifunctional magnetic nanoparticles elicit anti-tumor immunity in a mouse melanoma model.Mater Today Bio. 2023 Sep 24;23:100817. doi: 10.1016/j.mtbio.2023.100817. eCollection 2023 Dec. Mater Today Bio. 2023. PMID: 37822453 Free PMC article.
-
The Phagocytic Function of Macrophage-Enforcing Innate Immunity and Tissue Homeostasis.Int J Mol Sci. 2017 Dec 29;19(1):92. doi: 10.3390/ijms19010092. Int J Mol Sci. 2017. PMID: 29286292 Free PMC article. Review.
-
Iron Induces Anti-tumor Activity in Tumor-Associated Macrophages.Front Immunol. 2017 Nov 8;8:1479. doi: 10.3389/fimmu.2017.01479. eCollection 2017. Front Immunol. 2017. PMID: 29167669 Free PMC article.
References
-
- Dzionek A. et al. BDCA-2, BDCA-3, and BDCA-4: three markers for distinct subsets of dendritic cells in human peripheral blood. J Immunol 165, 6037–6046 (2000). - PubMed
-
- Shortman K. & Naik S. H. Steady-state and inflammatory dendritic-cell development. Nat Rev Immunol 7, 19–30 (2007). - PubMed
-
- Heath W. R. et al. Cross-presentation, dendritic cell subsets, and the generation of immunity to cellular antigens. Immunol Rev 199, 9–26 (2004). - PubMed
Publication types
MeSH terms
Substances
LinkOut - more resources
Full Text Sources
Other Literature Sources
