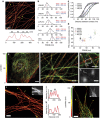
. 2015 Aug 11:6:7933.
doi: 10.1038/ncomms8933.

Resolving bundled microtubules using anti-tubulin nanobodies

Affiliations

Resolving bundled microtubules using anti-tubulin nanobodies

Marina Mikhaylova et al. Nat Commun. .

Abstract

Microtubules are hollow biopolymers of 25-nm diameter and are key constituents of the cytoskeleton. In neurons, microtubules are organized differently between axons and dendrites, but their precise organization in different compartments is not completely understood. Super-resolution microscopy techniques can detect specific structures at an increased resolution, but the narrow spacing between neuronal microtubules poses challenges because most existing labelling strategies increase the effective microtubule diameter by 20-40 nm and will thereby blend neighbouring microtubules into one structure. Here we develop single-chain antibody fragments (nanobodies) against tubulin to achieve super-resolution imaging of microtubules with a decreased apparent diameter. To test the resolving power of these novel probes, we generate microtubule bundles with a known spacing of 50-70 nm and successfully resolve individual microtubules. Individual bundled microtubules can also be resolved in different mammalian cells, including hippocampal neurons, allowing novel insights into fundamental mechanisms of microtubule organization in cell- and neurobiology.


Figures

Figure 1
Figure 1. Smaller labels allow resolving bundled microtubules.
(a) Simulations of conventional (top) and single-molecule localization-based microtubule images for different probe densities, localization precision cutoffs and probe positions (distance between target molecule and fluorophore). Unless specified otherwise, probe position is 2.5 nm and precision cutoff is 8 nm. Probe density is 100% and 50% for the third and fourth row, respectively. A Gaussian localization accuracy distribution with mean±s.d. of 7.5±2.5 nm is used. (b) FWHM of Gaussian fits to microtubule cross sections integrated over 512 nm length as a function of probe density and for different probe positions. Error bars represent s.e.m. Each point is the average of 150 FWHMs measured on 512 nm long microtubule (MT; empty stretches along the MT were not included). (c) MT FWHM versus probe position for different cutoffs of the localization accuracy distribution. (d) Estimation of resolving power for staining of microtubules with probes at increasing distance from the microtubule. Probe density is 7%, localization precision cutoff threshold is 13 nm. Two-hundred and fifty profiles per distance. (e) Illustration of the different labelling strategies compared in this study. (f) Scheme of the in vitro microtubule bundling assay to test the resolving power of different microtubule labelling strategies. Rhodamine-labelled microtubules are assembled into planar bundles with defined spacing formed by the microtubule-bundler GFP–AtMAP65-1. (g) Conventional (top) and SMLM (middle and bottom left) images and representative line scans (bottom right) of in vitro microtubule bundles stained with a fluorescently labelled primary anti-α-tubulin antibody (1ary-AF647) or two novel tubulin nanobodies (VHH#1 and VHH#2) conjugated to AF647. Scale bar, 1 μm. More examples are provided in Supplementary Fig. 3.
Figure 2
Figure 2. Resolving bundled microtubules in cells using tubulin nanobodies.
(a) SMLM reconstruction of a Ptk2 cell stained with VHH#1 and intensity profile of closely spaced microtubules along the yellow line. Yellow arrows indicate microtubule ends. Scale bar, 1 μm. A larger field of view of the same cell can be found in Supplementary Fig. 4b. (b) Histograms of microtubule FWHM for different probes. scFvs: mixture of human single-chain antibody fragments (scFvs) recognizing α- and β-tubulin. For representative images, see Supplementary Fig. 4a. (From top to bottom: n=1,365, 547, 352, 2,462, 2,460 profiles from N=10, 5, 9, 10, 10 different acquisitions). Mean (blue) and mode (red) value are indicated±s.e.m. (using N). (c) Estimation of resolving power for different labels obtained by combining arbitrarily selected line profiles at increasing distance between centres. (d) Scatter plot of FRC resolution estimate versus microtubule FWHM for images of microtubules in COS-7 cells stained with different labels. Error bars depict 95% confidence intervals. (e) Overview 3D-SMLM reconstruction of a U2OS cell stained with AF647-labelled VHH#1. The z-depth is colour-coded according to the scale on the left of the image. Scale bar, 5 μm. (f) Magnified image of the inset in e. Colour code is the same as in (e). Scale bar, 500 nm. (g) Area containing parallel microtubules at different depth in the cell. Colour code is the same as in e. Scale bar, 500 nm. (h) Collapsed cross section (z-x) of the volume depicted in g. Scale bar, 100 nm. (ik) SMLM reconstruction of microtubule bundles labelled with VHH#1 in the dendrites of a hippocampal primary neuron. Yellow arrows indicate microtubule ends and yellow lines were used for line scans across densely packed microtubule bundles (j,k). Inset shows the diffraction-limited fluorescence image. Scale bar, 2 μm. (l) 3D-SMLM reconstruction of a hippocampal primary neuron labelled with VHH#1. The Z-depth is colour-coded according to the scale on the left of the image. Yellow arrows indicate microtubule ends. Inset shows the diffraction-limited fluorescence image. Scale bar, 2 μm.

References

    1. Kapitein L. C. & Hoogenraad C. C. Which way to go? Cytoskeletal organization and polarized transport in neurons. Mol. Cell Neurosci. 46, 9–20 (2011). - PubMed
    1. Chen J., Kanai Y., Cowan N. J. & Hirokawa N. Projection domains of MAP2 and tau determine spacings between microtubules in dendrites and axons. Nature 360, 674–677 (1992). - PubMed
    1. Ries J., Kaplan C., Platonova E., Eghlidi H. & Ewers H. A simple, versatile method for GFP-based super-resolution microscopy via nanobodies. Nat. Methods 9, 582–584 (2012). - PubMed
    1. Royle S. J. Super-duper resolution imaging of mitotic microtubules. Nat. Rev. Mol. Cell Biol. 16, 67 (2015). - PubMed
    1. Nizak C. et al. Recombinant antibodies against subcellular fractions used to track endogenous Golgi protein dynamics in vivo. Traffic 4, 739–753 (2003). - PubMed

Publication types