. 2015 Nov;36(11):4421-37.
doi: 10.1002/hbm.22927. Epub 2015 Aug 11.

Atrophy patterns in early clinical stages across distinct phenotypes of Alzheimer's disease

Affiliations

Atrophy patterns in early clinical stages across distinct phenotypes of Alzheimer's disease

Rik Ossenkoppele et al. Hum Brain Mapp. 2015 Nov.

Abstract

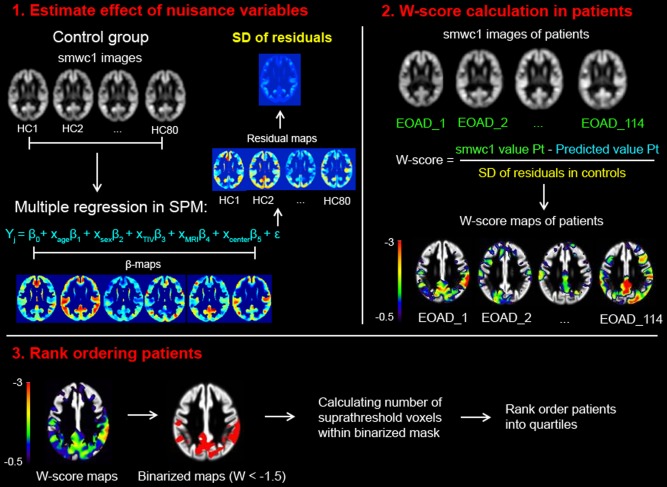
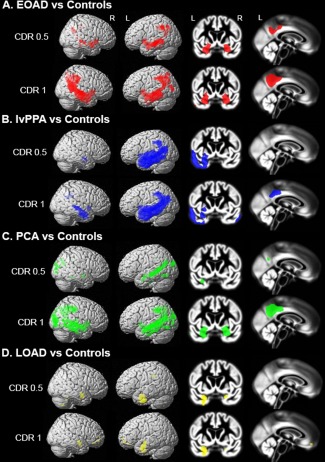
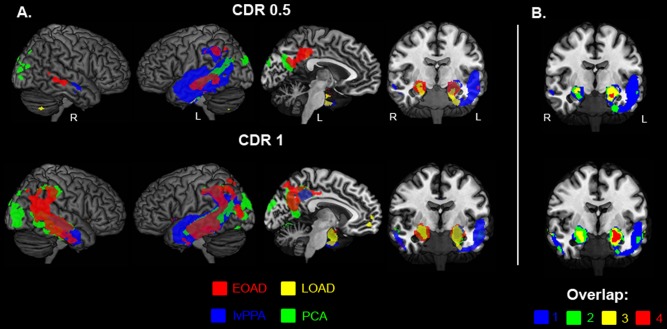
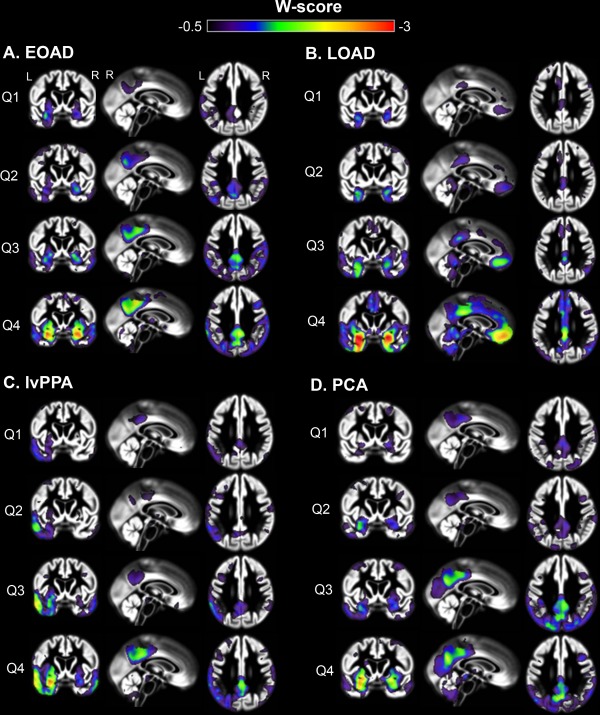
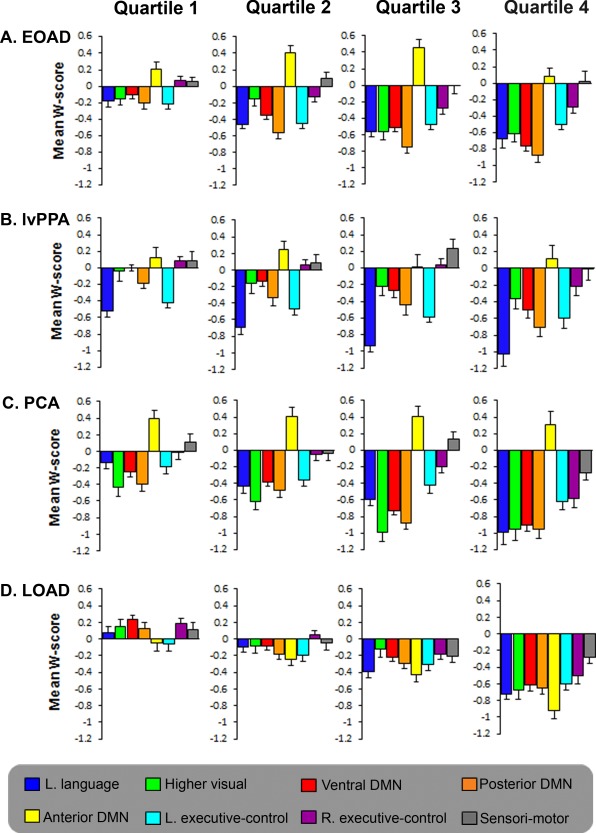
Alzheimer's disease (AD) can present with distinct clinical variants. Identifying the earliest neurodegenerative changes associated with each variant has implications for early diagnosis, and for understanding the mechanisms that underlie regional vulnerability and disease progression in AD. We performed voxel-based morphometry to detect atrophy patterns in early clinical stages of four AD phenotypes: Posterior cortical atrophy (PCA, "visual variant," n=93), logopenic variant primary progressive aphasia (lvPPA, "language variant," n=74), and memory-predominant AD categorized as early age-of-onset (EOAD, <65 years, n=114) and late age-of-onset (LOAD, >65 years, n=114). Patients with each syndrome were stratified based on: (1) degree of functional impairment, as measured by the clinical dementia rating (CDR) scale, and (2) overall extent of brain atrophy, as measured by a neuroimaging approach that sums the number of brain voxels showing significantly lower gray matter volume than cognitively normal controls (n=80). Even at the earliest clinical stage (CDR=0.5 or bottom quartile of overall atrophy), patients with each syndrome showed both common and variant-specific atrophy. Common atrophy across variants was found in temporoparietal regions that comprise the posterior default mode network (DMN). Early syndrome-specific atrophy mirrored functional brain networks underlying functions that are uniquely affected in each variant: Language network in lvPPA, posterior cingulate cortex-hippocampal circuit in amnestic EOAD and LOAD, and visual networks in PCA. At more advanced stages, atrophy patterns largely converged across AD variants. These findings support a model in which neurodegeneration selectively targets both the DMN and syndrome-specific vulnerable networks at the earliest clinical stages of AD.

Keywords: Alzheimer's disease; atrophy; default mode network; early-onset dementia; language; logopenic variant primary progressive aphasia; magnetic resonance imaging (MRI); memory; posterior cortical atrophy; vision; voxel-based morphometry.


Figures

Figure 1
Figure 1
A neuroimaging approach for staging of disease severity. Smoothed, warped, and modulated gray matter images of healthy controls were used to estimate the effect of nuisance variables on voxel intensities (1). Using multiple regressions in SPM, the beta's and residuals were used to determine the predicted value for each patient given their specific covariate (i.e. age, sex, total intracranial volume, MRI field strength, and center). Based on individual raw values in Alzheimer's disease patients, W‐scores can be calculated using the formula shown in (2). Finally, W‐scores maps were binarized at W < −1.5 and the number of voxels below this threshold were calculated for each patient (3). These numbers were rank‐ordered separately for each Alzheimer's disease variant and patients were grouped into quartiles.
Figure 2
Figure 2
Atrophy maps of Alzheimer's disease variants compared with controls. Regional differences between healthy controls and EOAD (A), lvPPA (B), PCA (C) and LOAD (D) patients at CDR 0.5 and 1. Voxelwise contrasts were adjusted for age, sex, total intracranial volume, MRI field strength and center, and thresholded at P < 0.05 with family‐wise error correction. Results are superimposed on the SPM8 new single‐subject template (left) and the study‐specific DARTEL template (right).
Figure 3
Figure 3
The intersection of distinct Alzheimer's disease phenotypes. Binarized maps of significant voxelwise differences between Alzheimer's disease variants and healthy controls (at P < 0.05 family‐wise error corrected) are overlaid on the MRIcron ch2better template for EOAD (red), lvPPA (blue), PCA (green), and LOAD (yellow) for both CDR 0.5 and 1 (A). (B) Represents a coronal view that displays the overlap between AD variants (blue = only 1 AD variant, green = 2 AD variants, yellow = 3 AD variants and 4 = all AD variants), most prominent in the medial temporal lobe.
Figure 4
Figure 4
Mean W‐score maps across quartiles for distinct Alzheimer's disease variants. Mean W‐score maps show changes of atrophy patterns with increasing quartiles for each of the Alzheimer's disease variants. W‐score maps are superimposed on the study‐specific template obtained with VBM. Q = quartile (1 = lowest extent of whole‐brain atrophy, 4 = highest).
Figure 5
Figure 5
Mean W‐score atrophy values within distinct intrinsic connectivity networks. The y‐axis represents mean W‐scores for brain atrophy extracted within eight functional connectivity network maps for each quartile in EOAD (A), lvPPA (B), PCA (C), and LOAD (D) patients. Statistical comparisons between networks in quartile 1 and within networks across quartiles are shown in Table 3 and Supporting Information Table I.

References

    1. Adriaanse SM, Binnewijzend MA, Ossenkoppele R, Tijms BM, van der Flier WM, Koene T, Smits LL, Wink AM, Scheltens P, van Berckel BN, Barkhof F (2014): Widespread disruption of functional brain organization in early‐onset Alzheimer's disease. PLoS One 9:e102995. - PMC - PubMed
    1. Albert MS, DeKosky ST, Dickson D, Dubois B, Feldman HH, Fox NC, Gamst A, Holtzman DM, Jagust WJ, Petersen RC, Snyder PJ, Carrillo MC, Thies B, Phelps CH (2011): The diagnosis of mild cognitive impairment due to Alzheimer's disease: recommendations from the National Institute on Aging‐Alzheimer's Association workgroups on diagnostic guidelines for Alzheimer's disease. Alzheimers Dement 7:270–279. - PMC - PubMed
    1. Alladi S, Xuereb J, Bak T, Nestor P, Knibb J, Patterson K, Hodges JR (2007): Focal cortical presentations of Alzheimer's disease. Brain 130:2636–2645. - PubMed
    1. Andrews‐Hanna JR, Reidler JS, Sepulcre J, Poulin R, Buckner RL (2010): Functional‐anatomic fractionation of the brain's default network. Neuron 65:550–562. - PMC - PubMed
    1. Beach TG, Monsell SE, Phillips LE, Kukull W (2012): Accuracy of the clinical diagnosis of Alzheimer disease at National Institute on Aging Alzheimer Disease Centers, 2005‐2010. J Neuropathol Exp Neurol 71:266–273. - PMC - PubMed

Publication types