. 2015 Oct 15;43(18):8990-9005.
doi: 10.1093/nar/gkv814. Epub 2015 Aug 10.

TDP-43 affects splicing profiles and isoform production of genes involved in the apoptotic and mitotic cellular pathways

Affiliations

TDP-43 affects splicing profiles and isoform production of genes involved in the apoptotic and mitotic cellular pathways

Laura De Conti et al. Nucleic Acids Res. .

Abstract

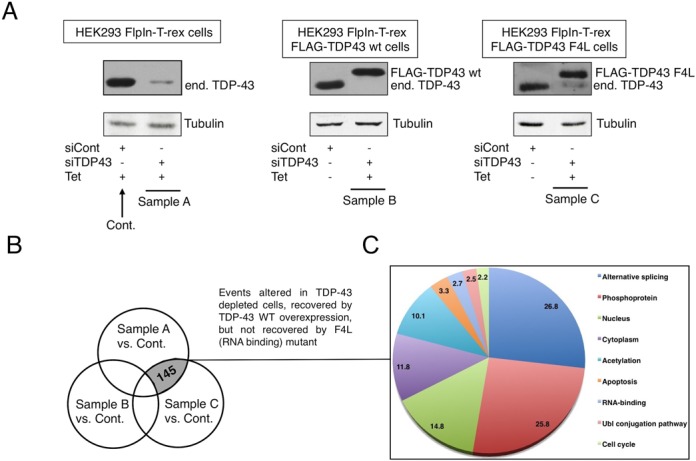
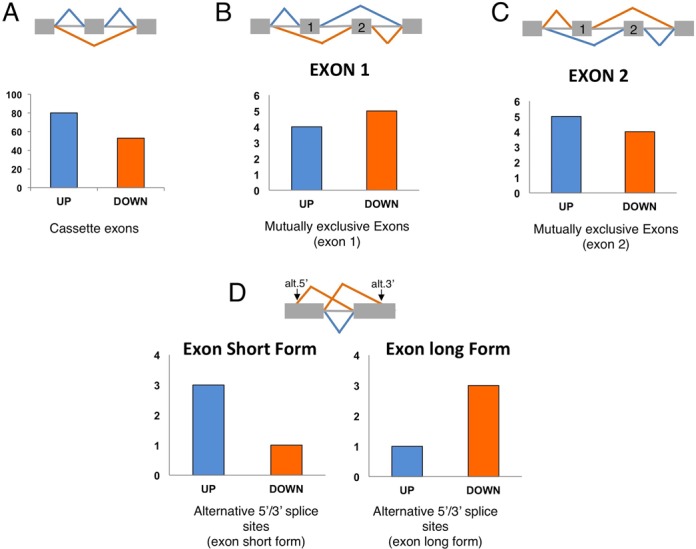
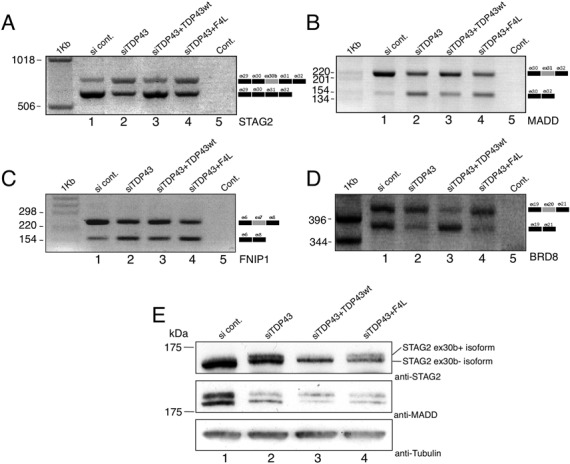
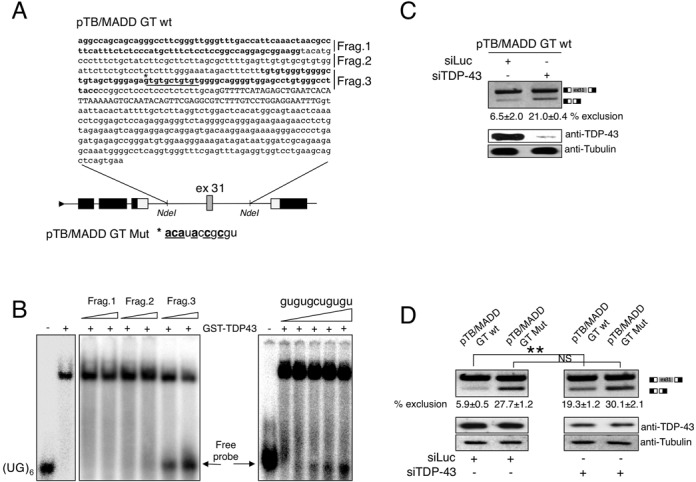
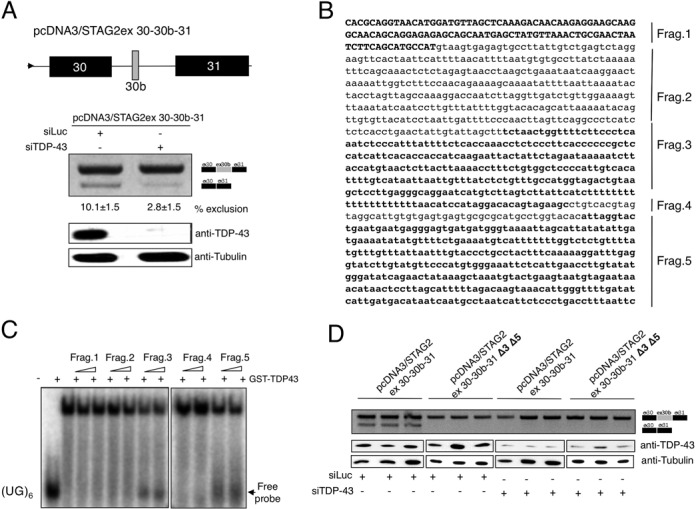
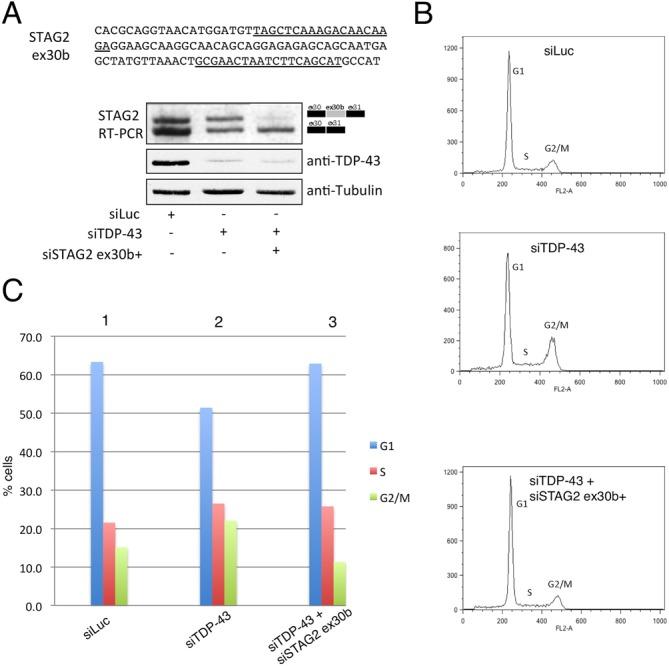
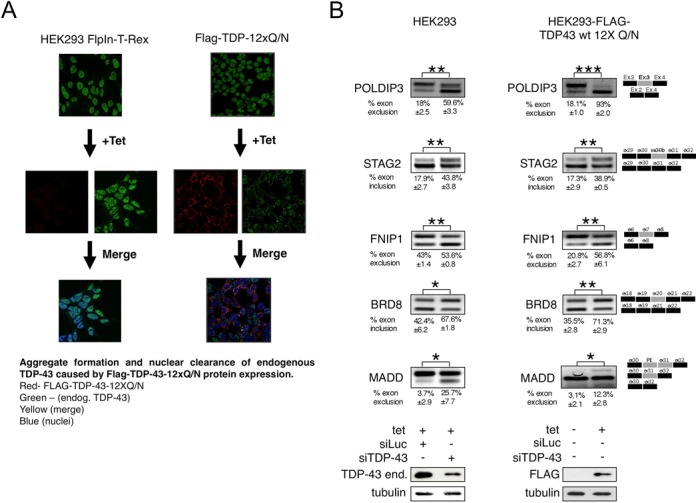
In recent times, high-throughput screening analyses have broadly defined the RNA cellular targets of TDP-43, a nuclear factor involved in neurodegeneration. A common outcome of all these studies is that changing the expression levels of this protein can alter the expression of several hundred RNAs within cells. What still remains to be clarified is which changes represent direct cellular targets of TDP-43 or just secondary variations due to the general role played by this protein in RNA metabolism. Using an HTS-based splicing junction analysis we identified at least six bona fide splicing events that are consistent with being controlled by TDP-43. Validation of the data, both in neuronal and non-neuronal cell lines demonstrated that TDP-43 substantially alters the levels of isoform expression in four genes potentially important for neuropathology: MADD/IG20, STAG2, FNIP1 and BRD8. For MADD/IG20 and STAG2, these changes could also be confirmed at the protein level. These alterations were also observed in a cellular model that successfully mimics TDP-43 loss of function effects following its aggregation. Most importantly, our study demonstrates that cell cycle alterations induced by TDP-43 knockdown can be recovered by restoring the STAG2, an important component of the cohesin complex, normal splicing profile.


Figures

Figure 1.
Figure 1.
TDP-43 expressing cell lines and splice sensitive microarray analysis. (A) The first panel on the left shows the control HEK293 Flp-In T-rex cell line, the central panel shows the HEK293 Flp-In T-rex cell line that can inducibly express a siRNA-resistant wild-type TDP-43 (FLAG-TDP43-WT) and the right panel shows the HEK293 Flp-In T-rex cell line that can inducibly express a siRNA-resistant mutant form of TDP-43 unable to bind RNA (FLAG-TDP43 F4L). Each group of cells was treated either with control Luciferase siRNA or TDP-43 siRNA. All cells were also treated with Tet in order to provide identical conditions for analysis. Expression of WT TDP-43 and the F4L mutant and endogenous TDP-43 silencing were determined by western blot analysis using a polyclonal antibody against this protein. An anti-tubulin antibody was used as protein loading control. Samples used for microarray analysis are indicated as Control, Sample A, Sample B and Sample C. (B) Venn diagram showing which type of splicing events were further analysed. (C) KEGG analysis showing the cellular pathways in which the selected genes are involved.
Figure 2.
Figure 2.
Analysis of the splicing events mediated by TDP-43. (A) Bar graphs show the number of exons included (Up) and excluded (Down) of the cassette exons analyzed. (B and C) Bar graphs show the number of exons included (Up) or excluded (Down) of the nine mutually exclusive exons analysed (exon 1 in B and exon 2 in C). (D) Bar graphs show the number of exons included (Up) and excluded (Down) of the analysed alternative 5′/3′ splice sites (exon short form, left graph, and exon long form, right graph).
Figure 3.
Figure 3.
Effect of TDP-43 on the alternative splicing of selected genes. Differentially treated HEK293 stable cell lines were used to validate each candidate gene: control siRNA Luciferase transfected cells (lane 1, si cont.), depleted of TDP-43 (lane 2, siTDP43), depleted of endogenous TDP-43 but expressing a siRNA resistant transgenic TDP-43 (lane 3, siTDP43 + TDP43wt), depleted of endogenous TDP-43 and expressing a mutant form of a siRNA resistant protein unable to bind RNA (lane 4, siTDP43 + F4L). (A) Standard RT-PCR of STAG2 transcripts. The diagrams on the right are a schematic representation of the amplicons. The grey box represents the alternative exon 30b. (B) Standard RT-PCR of MADD transcripts. The diagrams on the right are a schematic representation of the amplicons. The grey box represents the alternative exon 31. (C) Standard RT-PCR of FNIP1 transcripts. The diagrams on the right are a schematic representation of the amplicons. The grey box represents the alternative exon 7. (D) Standard RT-PCR of BRD8 transcripts. The diagrams on the right are a schematic representation of the amplicons. The grey box represents the alternative exon 20. (E) Endogenous STAG2 and MADD protein expression levels following treatment with siTDP-43 (lane 2), rescue in the cell line expressing an si-resistant TDP-43 (lane 3, siTDP43+TDP43wt), and following expression of the RNA-binding impaired mutant F4L (lane 4, siTDP43 + F4L). Anti-tubulin was used for protein loading control.
Figure 4.
Figure 4.
Mapping the functional TDP-43 binding sites in the region surrounding MADD exon 31. (A) Schematic diagram of the minigene system to test the effect of TDP-43 on MADD exon 31 inclusion (pTB/MADD GT WT). The α-globin, fibronectin EDB and human MADD exon 31 are shown as black, white and grey boxes, respectively. Diagram on the top shows MADD exon 31 (upper case) together with part of its intronic flanking regions cloned in the minigene. For the EMSA competition analysis the upstream intron was divided into three fragments (Frag1–3), which are indicated with alternating bold and plain letters. The underlined tg-gt-repeated sequence in the upstream intron represents the putative TDP-43 binding region. Mutagenesis of the TDP-43 binding region is shown and indicated as pTB/MADD GT Mut. (B) Band shift competition analysis using recombinant TDP-43 and labelled (UG)6 RNA. As competitors, cold RNAs of the indicated fragments of exon 31-upstream intron were used. The arrow indicates labelled unbound (UG)6 RNA which increases in accordance with increasing amounts of competitor used. (C) RT-PCR analysis performed on pTB/MADD GT WT-transfected in HEK293 cells upon treatment with control siRNA Luciferase and TDP-43 siRNA. Schematic representation of the amplicons is shown on the right. Efficiency of TDP-43 knockdown is shown in the lower panels by western blot. An anti-tubulin antibody was used as protein loading control (bottom of the panel). ImageJ quantification of exon exclusion percentage and corresponding standard deviations performed on three different experiments are indicated. (D) RT-PCR performed on HEK293 cells transfected with the minigene carrying the wild-type TDP-43 binding region (pTB/MADD GT wt) and the mutated one (pTB/MADD GT Mut) upon treatment with control siRNA Luciferase and TDP-43 siRNA. Schematic representation of the amplicons is shown on the right. Efficiency of TDP-43 knockdown is shown in the lower panels by western blot. An anti-tubulin antibody was used as protein loading control (bottom of the panel). ImageJ quantification of exon exclusion percentage and corresponding standard deviations performed on three different experiments are indicated, as well as P-values where *** means P ≤ 0.001, ** means P ≤ 0.01 and *means P ≤ 0.05. NS indicates not statistically significant difference.
Figure 5.
Figure 5.
Mapping the functional TDP-43 binding sites in the region surrounding STAG2 exon 30b. (A) Schematic diagram of the minigene system to test the effect of TDP-43 on STAG2 exon 30b inclusion. The STAG2 exon 30 along with its downstream intron, exon 30b along with most of its downstream intron and exon 31 were cloned in pCDNA 3.1. The lower panel shows an RT-PCR analysis performed on minigene-transfected cells upon treatment with control Luciferase siRNA (siLuc) and TDP-43 siRNA (siTDP-43). Schematic representation of the amplicons is shown on the right. Efficiency of TDP-43 knockdown is reported in the western blots below. An antibody anti-tubulin was used as protein loading control (bottom panel). ImageJ quantification of exon exclusion percentage and corresponding standard deviations were performed on three different experiments and are indicated. (B) Sequence of exon 30b (capital letters) together with its downstream intronic region divided into five fragments (Frag.1-Frag.5) shown with alternating bold and plain letters and used in the EMSA analysis are shown. (C) Band shift competition analysis using recombinant TDP-43 and labelled (UG)6 RNA. As competitor, cold RNAs of Fragments 1–5 were used. The arrow indicates labelled unbound (UG)6 RNA which increases in accordance with the increasing amount of fragments number 3 and 5. (D) RT-PCR analysis performed on control Luciferase siRNA and TDP-43 siRNA treated cells following transfection of STAG2 minigene (named pcDNA3/STAG2ex 30–30b-31) and of the same minigene in which the two TDP-43 binding regions 3 and 5 were depleted (named pcDNA3/STAG2ex 30–30b-31 Δ3 Δ5). Three replicates for each condition are shown. Schematic representation of the amplicons is shown on the right. Efficiency of TDP-43 knockdown is shown in the western blot below and an antibody anti-tubulin was used as protein loading control (bottom panel).
Figure 6.
Figure 6.
Functional effects of STAG2 exon 30b-containing isoform in TDP-43 depleted cells. (A) The upper panel shows the sequence of STAG2 exon 30b with the siRNA target sequences underlined. The lower panels show the effects of these siRNAs in specifically silencing the expression of this isoform following treatment with TDP-43 siRNA. (B) Flow cytometry profiles of HeLa cells treated with siRNA Luciferase (upper panel), siRNA TDP-43 (middle panel) and siRNAs against TDP-43 and STAG2 exon 30b-containing isoform (lower panel). (C) Histogram quantifying the cells distribution in the different phases of the cell cycle following differential siRNA treatment of cells illustrated in (B). The quantifications represent the average of three independent experiments. Corresponding standard deviations were the following: ±1.11, ±0.81, ±0.83 for the siRNA Luciferase treated cells in G1, S, G2/M respectively; ±0.83, ±0.12, ±0.72 for the siTDP-43 treated cells in G1, S, G2/M respectively and ±0.7, ±1.42, ±0.93 for the siTDP-43/STAG2 treated cells in G1, S, G2/M respectively. Significance values were calculated using the Student's t-test and were the following: for cells in G1 phase P-values were <0.05 for siRNA Luciferase versus siTDP-43 treated cells, for siRNA Luciferase versus siTDP-43/STAG2 treated cells and for siTDP-43 versus SiTDP-43/STAG2 treated cells; for cells in S-phase P-values were <0.01 for siRNA Luciferase versus SiTDP-43 treated cells, ns for siRNA Luciferase versus siTDP-43/STAG2 treated cells and for siTDP-43 versus siTDP-43/STAG2 treated cells; for cells in G2/M phase P-values were <0.05 for siRNA Luciferase versus siTDP-43 treated cells and for for siRNA Luciferase versus siTDP-43/STAG2 treated cells, <0.001 for siTDP-43 versus siTDP-43/STAG2 treated cells.
Figure 7.
Figure 7.
Alterations in pre-mRNA splicing levels using a TDP-43 loss of function cellular system. (A) Immunofluorescence of the endogenous TDP-43 present in untreated HEK293 FlpIn-T-Rex and FLAG-TDP-43–12XQ/N cell lines that is predominantly localized in the nucleus (visualized using an anti-TDP-43 antibody, upper panels). Following tetracycline induction the FLAG-TDP-43–12XQ/N is induced and observed using an anti-FLAG (red, middle right panels). On the other hand, no FLAG signal is observed when a non-transgenic cell line is treated with Tetracycline (middle left panels). A merge between anti-FLAG/anti-TDP-43 antibodies is reported in the lower panels showing, in the case of FLAG-TDP-43–12XQ/N cell line, the prominent aggregate formation in the cytoplasm often accompanied by TDP-43 nuclear clearance. The cell nuclei were stained with the reagent TOPRO-3. (B) shows the splicing pattern of the endogenous gene SKAR/POLDIP3, STAG2, FNIP1, BRD8 and MADD/IG20 following induction of FLAG-TDP-43–12xQ/N proteins (right panels, compare −Tet and +Tet lanes). In all cases, the result of knocking down the endogenous TDP-43 is reported (left panels). Exon inclusion was evaluated by RT-PCR. Schematic representation of the amplicons is shown on the right. Efficiency of TDP-43 knock down is reported in the western blots below. An antibody anti-tubulin was used as protein loading control (bottom panel). ImageJ quantification of exon inclusion or exclusion percentage and corresponding standard deviations were performed on three different experiments and are indicated.

References

    1. Neumann M., Sampathu D.M., Kwong L.K., Truax A.C., Micsenyi M.C., Chou T.T., Bruce J., Schuck T., Grossman M., Clark C.M., et al. Ubiquitinated TDP-43 in frontotemporal lobar degeneration and amyotrophic lateral sclerosis. Science. 2006;314:130–133. - PubMed
    1. Arai T., Hasegawa M., Akiyama H., Ikeda K., Nonaka T., Mori H., Mann D., Tsuchiya K., Yoshida M., Hashizume Y., et al. TDP-43 is a component of ubiquitin-positive tau-negative inclusions in frontotemporal lobar degeneration and amyotrophic lateral sclerosis. Biochem. Biophys. Res. Commun. 2006;351:602–611. - PubMed
    1. Buratti E., Baralle F.E. TDP-43: gumming up neurons through protein-protein and protein-RNA interactions. Trends Biochem. Sci. 2012;37:237–247. - PubMed
    1. Lee E.B., Lee V.M., Trojanowski J.Q. Gains or losses: molecular mechanisms of TDP43-mediated neurodegeneration. Nat. Rev. Neurosci. 2012;13:38–50. - PMC - PubMed
    1. Romano M., Buratti E. Targeting RNA binding proteins involved in neurodegeneration. J. Biomol. Screen. 2013;18:967–983. - PubMed

Publication types

MeSH terms