. 2015 Aug 25;112(34):10738-43.
doi: 10.1073/pnas.1506085112. Epub 2015 Aug 10.

Reciprocal regulation of two G protein-coupled receptors sensing extracellular concentrations of Ca2+ and H

Affiliations

Reciprocal regulation of two G protein-coupled receptors sensing extracellular concentrations of Ca2+ and H

Wei-Chun Wei et al. Proc Natl Acad Sci U S A. .

Abstract

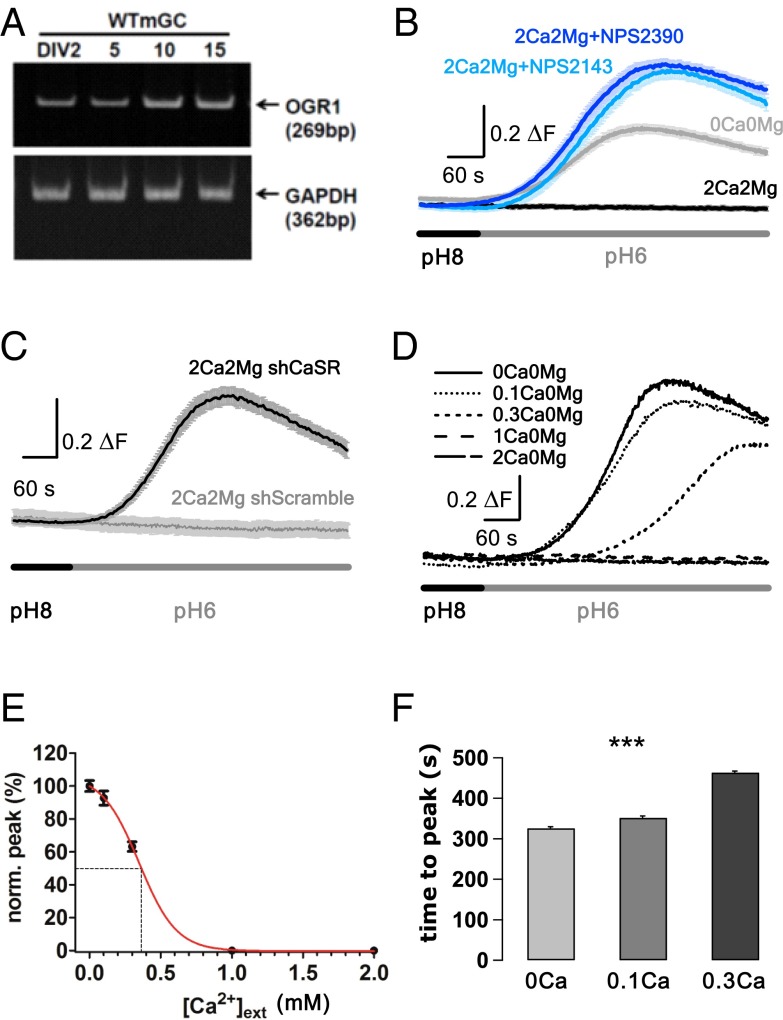
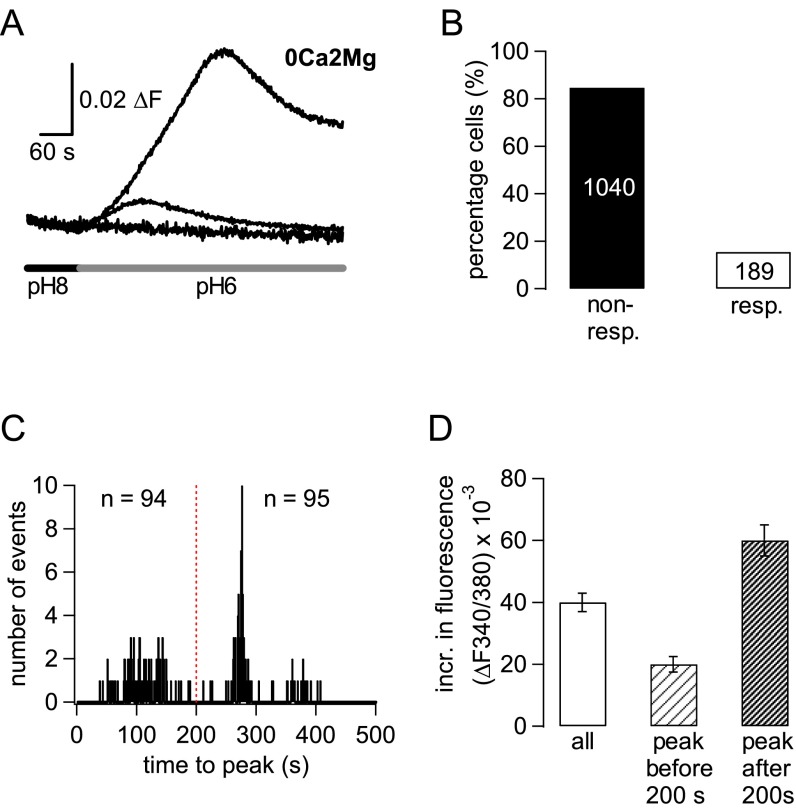
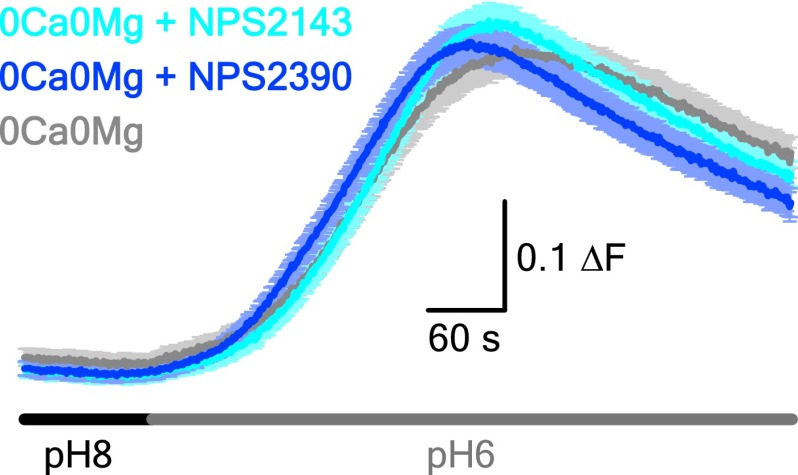
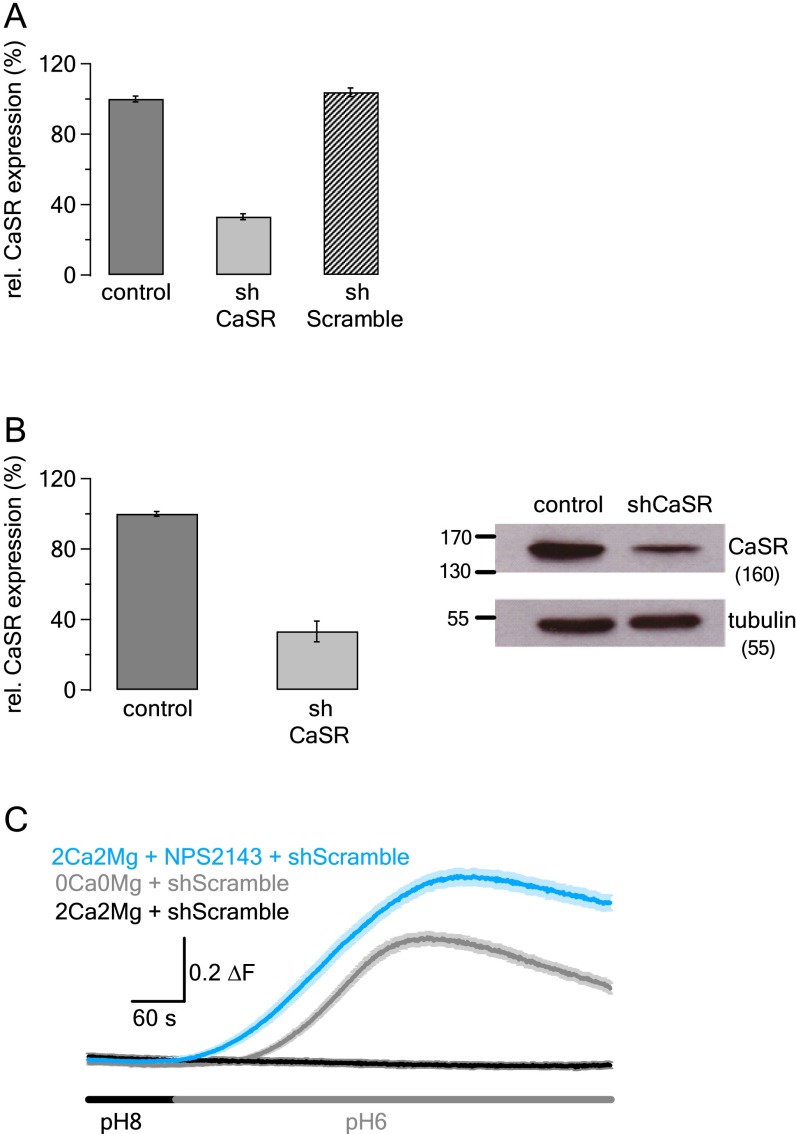
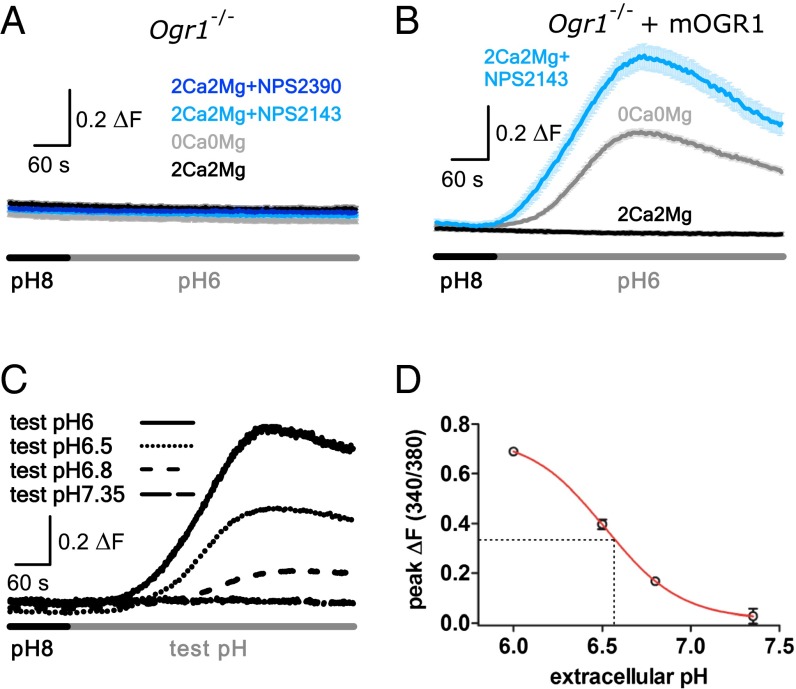
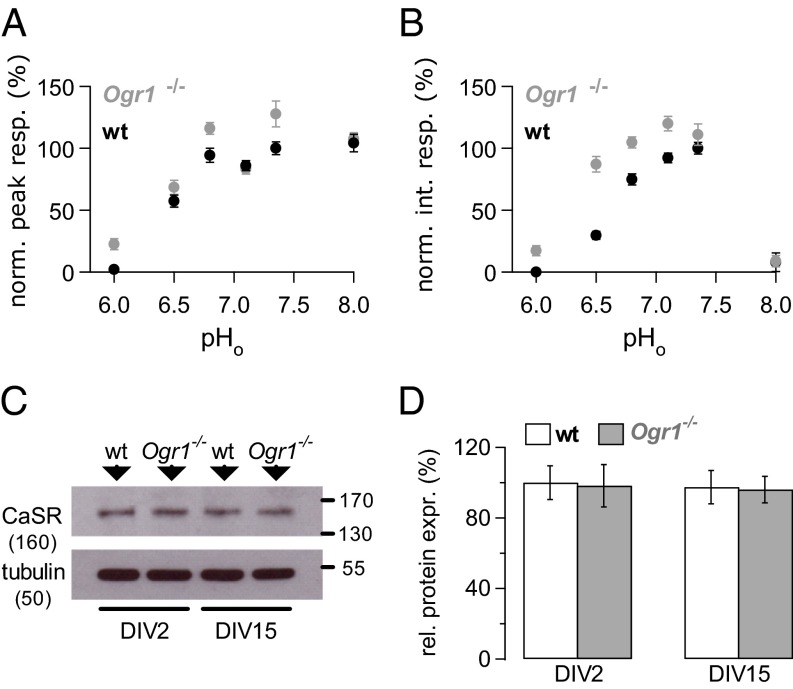
G protein-coupled receptors (GPCRs) are cell surface receptors that detect a wide range of extracellular messengers and convey this information to the inside of cells. Extracellular calcium-sensing receptor (CaSR) and ovarian cancer gene receptor 1 (OGR1) are two GPCRs that sense extracellular Ca(2+) and H(+), respectively. These two ions are key components of the interstitial fluid, and their concentrations change in an activity-dependent manner. Importantly, the interstitial fluid forms part of the microenvironment that influences cell function in health and disease; however, the exact mechanisms through which changes in the microenvironment influence cell function remain largely unknown. We show that CaSR and OGR1 reciprocally inhibit signaling through each other in central neurons, and that this is lost in their transformed counterparts. Furthermore, strong intracellular acidification impairs CaSR function, but potentiates OGR1 function. Thus, CaSR and OGR1 activities can be regulated in a seesaw manner, whereby conditions promoting signaling through one receptor simultaneously inhibit signaling through the other receptor, potentiating the difference in their relative signaling activity. Our results provide insight into how small but consistent changes in the ionic microenvironment of cells can significantly alter the balance between two signaling pathways, which may contribute to disease progression.

Keywords: CaSR; OGR1; extracellular acidosis; microenvironment; pH sensing.


Conflict of interest statement

The authors declare no conflict of interest.

Figures

Fig. 1.
Fig. 1.
CaSR inhibits extracellular acidification-mediated [Ca2+]i signaling. (A) Murine cerebellar granule cells express OGR1 mRNA at different DIV stages. (B) Average fluorescence traces recorded in WT granule cells in response to extracellular acidification from pH 8 to pH 6 in the absence (0Ca0Mg) and presence of 2 mM Ca2+o and Mg2+o (2Ca2Mg), and in the additional presence of CaSR inhibitors 10 μM NPS2143 (2Ca2Mg+NPS2143) or NPS2390 (2Ca2Mg+NPS2390). n = 46–56 cells. (C) Average fluorescence traces in WT granule cells in response to extracellular acidification in the presence of extracellular divalents following knockdown of CaSR (shCaSR) and using a scrambled sh construct (shScrambled) as a negative control. n = 38–49 cells. (D) Representative raw traces showing the effects of extracellular acidification in presence of increasing [Ca2+]o in WT granule cells. All experiments were performed in the absence of [Mg2+]o. (E) Average peak fluorescence signals in response to acidification from pHo8–6 for a given [Ca2+]o were normalized to average peak fluorescence signal at 0 mM Ca2+o (taken as 100%). Experimental conditions were as in D. Dotted lines indicate the position of 50% of the control fluorescence signal at 0 mM Ca2+o. n = 85–92 cells. (F) Average time delay between extracellular acidification and peak response in presence of increasing [Ca2+]o, measured in seconds. Same cells as for E. ***P < 0.0001.
Fig. S1.
Fig. S1.
Acidosis-induced [Ca2+]i signals have variable responses in Ca2+-free conditions. (A) Individual traces representing typical changes in fluorescence signals on extracellular acidification from pH 8 to pH 6 in extracellular solution containing 0 mM Ca2+ and 2 mM Mg2+ (0Ca2Mg; Ca2+-free conditions, 0.1 mM EGTA present). (B) Percentage of cells (not) responding to a drop in pHo from pH 8 to pH 6 under Ca2+-free conditions; n = 1,040 cells for nonresponders (nonresp.) and n = 189 for responders (resp.). (C) Histogram showing that responding cells fall into two groups, depending on their time to peak (i.e., interval between pH drop and peak fluorescence response), with 49.7% of cells responding before 200 s and 50.3% of cells responding after 200 s. (D) Bar charts showing average increase in fluorescence signal following pHo change from pH8 to pH6 for all responding cells (all), for those 94 cells that peaked before 200 s, and for those 95 cells that peaked after 200 s.
Fig. S2.
Fig. S2.
Pharmacologic block of CaSR does not lead to larger fluorescence signal in WT granule cells in response to extracellular acidification under divalent-free conditions. Average fluorescence traces in the absence of [Ca2+]o and [Mg2+]o (divalent-free conditions) under control conditions (0Ca0Mg, gray) and in the additional presence of either 10 μM NPS2143 (0Ca0Mg + NPS2143, light blue) or 10 μM NPS2390 (0Ca0Mg + NPS2390, dark blue) in response to a drop in pHo from pH 8 to pH 6. n = 48–55 cells. Error bars represent SEM.
Fig. S3.
Fig. S3.
Control experiments for CaSR knockdown in WT granule cells using an shRNA approach. To assess the extent of CaSR knockdown using the shRNA approach, we carried out experiments in which we compared CaSR protein expression using a CaSR antibody in cells that had been successfully transfected with shRNA against CaSR, a scrambled sh construct as a negative control, and untransfected cells (SI Materials and Methods). These experiments showed that shCaSR-transfection resulted in a 66.9 ± 1.7% knockdown of CaSR protein compared with untransfected cells and cells transfected with scrambled sh construct (Fig. S3B). In another set of experiments, we used an automatic cell sorter to separate nontransfected cells from shCaSR-transfected cells. Protein extraction from these two cell populations and subsequent Western blot analyses revealed that CaSR was knocked down by 66.8 ± 5.9% in shCaSR-transfected cells. (A) Bar charts depicting average relative CaSR protein expression in WT granule cells under control conditions (control; n = 54 cells) and following transfection of cells with shRNA targeted against CaSR (shCaSR; n = 31 cells) or with scrambled shRNA as a negative transfection control (sh Scrambled; n = 46 cells). Protein expression levels were normalized to control CaSR expression. Error bars represent SEM. The quantification method is described in Materials and Methods. (B) Bar charts depicting average relative CaSR protein expression in WT granule cells under control conditions and following transfection of cells with shRNA targeted against CaSR (shCaSR). Cells were sorted automatically on the basis of the fluorescent tag of the sh construct. Protein was isolated, and Western blot analyses were carried out with an antibody against CaSR and α-tubulin for quantification (n = 3 repeats). (Left) Average relative CaSR expression. (Right) Representative Western blot results. Molecular weights are given in kDa. Error bars represent SEM. Experimental procedures are described in Materials and Methods. (C) Transfection of murine WT granule cells with scrambled shRNA for CaSR (shScramble) does not lead to a disinhibition of acidosis-mediated [Ca2+]i signals in these cells. Experiments serve as negative controls for experiments using shRNA against CaSR and were carried out in the absence of extracellular divalents (0Ca0Mg + shScramble; n = 30 cells), in the presence of extracellular divalents (2Ca2Mg + shScramble; n = 49 cells), and in the additional presence of 10 μM NPS2143 (2Ca2Mg + NPS2143 + shScramble; n = 48 cells). shScramble-expressing cells were identified with the help of their RFP signals.
Fig. 2.
Fig. 2.
OGR1 underlies the acidification-mediated [Ca2+]i signaling. (A) Average fluorescence response to acidification from pHo8–6 measured in Ogr1−/− granule cells in the absence (0Ca0Mg), and presence of 2 mM Ca2+o and Mg2+o (2Ca2Mg), and in the additional presence of NPS2143 (10 μM; 2Ca2Mg+NPS2143) or NPS2390 (10 μM; 2Ca2Mg+NPS2390). n = 46–56 cells. (B) The same experiments as in A, but following transfection of murine Ogr1 into Ogr1−/− cells (Ogr1−/− + mOGR1). n = 26–49 cells. (C) Representative raw traces showing the dose–response curve of OGR1 signaling to extracellular acidosis in absence of extracellular divalent cations in WT granule cells. (D) Experiments performed as in C. Average peak Ca2+ signals were plotted against the pHo at which they occurred. All data were obtained in WT granule cells. n = 47–53 cells. Dotted lines indicate the pHo at which the measured response is one-half that measured at pH 6.
Fig. S4.
Fig. S4.
Control experiments for OGR1 transfection into granule cells derived from Ogr1−/− mice. Transfection of the empty RFP vector into granule cells derived from Ogr1−/− mice was done to rule out that the possibility that the transfection procedure could give rise to responses resembling OGR1 responses. Experiments were carried out in the absence of extracellular divalents (0Ca0Mg + RFP; n = 29 cells), in the presence of extracellular divalents (2Ca2Mg + RFP; n = 25 cells), and in the additional presence of 10 μM NPS2390 (2Ca2Mg + NPS2390 + RFP; n = 30 cells). Only RFP-positive cells were used for analysis.
Fig. S5.
Fig. S5.
Kinetics of OGR1 responses in response to various extents of extracellular acidification. Same cells and experimental procedures as in Fig. 2D. Shown is the average time to peak of the [Ca2+]i signal in response to extracellular acidification to pHo 6.8, 6.5, and 6, measured in seconds. ***P < 0.0001.
Fig. 3.
Fig. 3.
CaSR is subject to inhibition by OGR1. (A) Averaged peak fluorescence responses following activation of CaSR by increasing [Ca2+]o from 0 to 2 mM at varying pHo values. All data points are normalized to the average peak WT response at pH 7.35. n = 39–108 cells. (B) Data points depicting the integral (int.) of the CaSR response. Same cells and experiments as in A. All data points are normalized to the average integral response in WT at pH7.35. (C) Western blot of CaSR expression in WT and Ogr1−/− granule cells at DIV2 and 15. α−tubulin served as an internal control. Molecular weights are given in kDa. (D) Average relative (rel.) CaSR protein expression (expr.) level. All values are normalized to the average CaSR expression in WT granule cell cultures at DIV2. n = 2 repeats per condition.
Fig. S6.
Fig. S6.
OGR1 inhibits Ca2+ influx on CaSR activation. Shown are average fluorescence traces for experiments in WT and Ogr1−/− cerebellar granule cells on increasing [Ca2+]o from 0 to 2 mM in the absence of [Mg2+]o (arrow) at pHo 6.8, 6.5, and 6. Scale bars are identical for all three graphs; error bars represent SEM. Same cells as used for bar charts for pH 6, 6.5, and 6.8 in Fig. 3 A and B; n = 38–71 cells.
Fig. S7.
Fig. S7.
Control experiments for intracellular acidification. (A) pHi depending on pHo. pHi was measured using BCECF following an pHo change (5 min after changing pHo) for 2 min in WT granule cells, recording fluorescence ratios every 5 s. Each data point represents the average of n = 33–59 cells; error bars represent SEM. (B) pHi following application of 0, 12.5, 25, or 50 mM NaAc at pHo 8; pHi was measured using BCECF (with fluorescence ratios recorded every 5 s) in WT granule cells, and the peak decrease in pHi was used for calculation of average pHi in response to NaAc application. Each data point represents the average of n = 19–33 cells; error bars represent SEM. (C) Comparison of average pHi following acidification of pHo to pH 6 or application of 25 and 50 mM NaAc, respectively (data derived from A and B; n = 35–22 cells/condition). The decreases in pHi are not statistically significantly different among the three conditions (P = 0.4836, ANOVA). (D) pHi change in response to acidification of pHo in WT and Ogr1−/− granule cells. n = 33–59. Change in pHi was assessed using the fluorescent H+ dye BCECF (details in Materials and Methods).
Fig. 4.
Fig. 4.
Intracellular acidosis inhibits CaSR and potentiates OGR1. (A) Average (± SEM) CaSR fluorescence responses at pHo8 under control conditions (black) and following intracellular acidification with 25 mM NaAc (purple). n = 30–37 cells. Responses were evoked by increasing [Ca2+]o from 0 to 2 mM (in the absence of [Mg2+]o). (B) Average graph showing the impact of intracellular acidification by 50 mM NaAc at extracellular pH 7.35 in the presence of extracellular divalents and 10 μM NPS2390 in WT cells (n = 52). (C and D) Same experimental protocol as for B, but either at pHo 8 in WT granule cells (n = 27) (C) or using Ogr1−/−granule cells (n = 27) (D). (E) Black, pHo 8 acidified to pHo 6 after 150 s. Purple, pHo 8 constant and pHi acidified with 50 mM sodium acetate after 50 s. Green, pHi acidified with 50 mM sodium acetate after 50 s (pHo 8), and pHo acidified to 6 after 150 s. n = 66–74 cells. (F) Same experiments as in E, but carried out in Ogr1−/− granule cells. n = 31–45 cells.
Fig. S8.
Fig. S8.
Metabotropic ATP receptors P2Y1R and P2Y6R are affected by intracellular acidification in their signaling ability. Bar charts show the effect of intracellular acidification on average peak P2Y1R- and P2Y6R-activated Ca2+ release from intracellular Ca2+ stores. Error bars represent SEM. Black hatched bars represent control conditions (pHo 8, in the absence of [Ca2+]o); purple hatched bars are in the additional presence of 25 mM sodium acetate (+NaAc). P2Y1 receptors were activated using 1 μM MRS 2354, and P2Y6 receptors were activated using 1 μM MRS 2693; n = 151–161 cells. The observed differences were not quite statistically significant (P = 0.05979 for P2Y1; P = 0.0882 for P2Y6).
Fig. 5.
Fig. 5.
Transformed granule cells lack CaSR-mediated inhibition of OGR1-dependent [Ca2+]i signals and reduced CaSR signaling activity. (A) Average data (±SEM) for OGR1-mediated intracellular fluorescence change in DAOY cells (n = 30 cells) in response to extracellular acidification from pH 7.35–6; experiments in the presence of divalents. (B) Average graphs (± SEM) showing CaSR responses in DAOY (blue; n = 46) and WT granule cells (black; n = 67). All experiments were done in the absence of [Mg2+]o.

References

    1. Lavin Y, et al. Tissue-resident macrophage enhancer landscapes are shaped by the local microenvironment. Cell. 2014;159(6):1312–1326. - PMC - PubMed
    1. Gosselin D, et al. Environment drives selection and function of enhancers controlling tissue-specific macrophage identities. Cell. 2014;159(6):1327–1340. - PMC - PubMed
    1. Quail DF, Joyce JA. Microenvironmental regulation of tumor progression and metastasis. Nat Med. 2013;19(11):1423–1437. - PMC - PubMed
    1. Hussell T, Bell TJ. Alveolar macrophages: Plasticity in a tissue-specific context. Nat Rev Immunol. 2014;14(2):81–93. - PubMed
    1. DeCoursey TE. Voltage-gated proton channels: Molecular biology, physiology, and pathophysiology of the H(V) family. Physiol Rev. 2013;93(2):599–652. - PMC - PubMed

Publication types

MeSH terms

LinkOut - more resources