

Cryptic infection of a broad taxonomic and geographic diversity of tadpoles by Perkinsea protists
- PMID: 26261337
- PMCID: PMC4553764
- DOI: 10.1073/pnas.1500163112
Cryptic infection of a broad taxonomic and geographic diversity of tadpoles by Perkinsea protists
Abstract
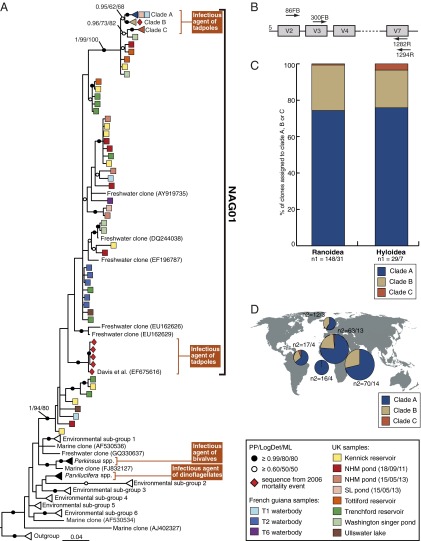
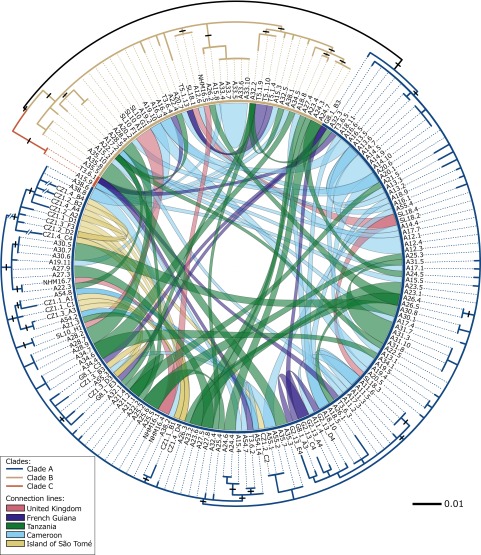
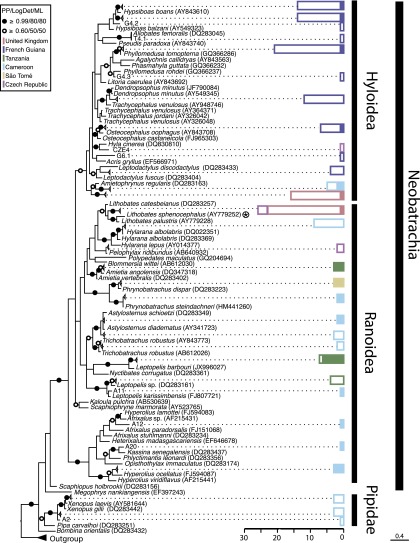
The decline of amphibian populations, particularly frogs, is often cited as an example in support of the claim that Earth is undergoing its sixth mass extinction event. Amphibians seem to be particularly sensitive to emerging diseases (e.g., fungal and viral pathogens), yet the diversity and geographic distribution of infectious agents are only starting to be investigated. Recent work has linked a previously undescribed protist with mass-mortality events in the United States, in which infected frog tadpoles have an abnormally enlarged yellowish liver filled with protist cells of a presumed parasite. Phylogenetic analyses revealed that this infectious agent was affiliated with the Perkinsea: a parasitic group within the alveolates exemplified by Perkinsus sp., a "marine" protist responsible for mass-mortality events in commercial shellfish populations. Using small subunit (SSU) ribosomal DNA (rDNA) sequencing, we developed a targeted PCR protocol for preferentially sampling a clade of the Perkinsea. We tested this protocol on freshwater environmental DNA, revealing a wide diversity of Perkinsea lineages in these environments. Then, we used the same protocol to test for Perkinsea-like lineages in livers of 182 tadpoles from multiple families of frogs. We identified a distinct Perkinsea clade, encompassing a low level of SSU rDNA variation different from the lineage previously associated with tadpole mass-mortality events. Members of this clade were present in 38 tadpoles sampled from 14 distinct genera/phylogroups, from five countries across three continents. These data provide, to our knowledge, the first evidence that Perkinsea-like protists infect tadpoles across a wide taxonomic range of frogs in tropical and temperate environments, including oceanic islands.
Keywords: alveolates; emerging disease; frog decline; molecular diversity; parasite.
Conflict of interest statement
The authors declare no conflict of interest.
Figures
Similar articles
-
Diverse alveolate infections of tadpoles, a new threat to frogs?PLoS Pathog. 2020 Feb 13;16(2):e1008107. doi: 10.1371/journal.ppat.1008107. eCollection 2020 Feb. PLoS Pathog. 2020. PMID: 32053700 Free PMC article. Review. No abstract available.
-
Expanded host and geographic range of tadpole associations with the Severe Perkinsea Infection group.Biol Lett. 2021 Jun;17(6):20210166. doi: 10.1098/rsbl.2021.0166. Epub 2021 Jun 16. Biol Lett. 2021. PMID: 34129800 Free PMC article.
-
Pathogenic lineage of Perkinsea associated with mass mortality of frogs across the United States.Sci Rep. 2017 Aug 31;7(1):10288. doi: 10.1038/s41598-017-10456-1. Sci Rep. 2017. PMID: 28860470 Free PMC article.
-
Diverse molecular signatures for ribosomally 'active' Perkinsea in marine sediments.BMC Microbiol. 2014 Apr 29;14:110. doi: 10.1186/1471-2180-14-110. BMC Microbiol. 2014. PMID: 24779375 Free PMC article.
-
Emerging Parasitic Protists: The Case of Perkinsea.Front Microbiol. 2022 Jan 13;12:735815. doi: 10.3389/fmicb.2021.735815. eCollection 2021. Front Microbiol. 2022. PMID: 35095782 Free PMC article. Review.
Cited by
-
Diverse alveolate infections of tadpoles, a new threat to frogs?PLoS Pathog. 2020 Feb 13;16(2):e1008107. doi: 10.1371/journal.ppat.1008107. eCollection 2020 Feb. PLoS Pathog. 2020. PMID: 32053700 Free PMC article. Review. No abstract available.
-
New Perkinsea Parasitoids of Dinoflagellates Distantly Related to Parviluciferaceae Members.Front Microbiol. 2021 Aug 5;12:701196. doi: 10.3389/fmicb.2021.701196. eCollection 2021. Front Microbiol. 2021. PMID: 34421856 Free PMC article.
-
Clarifying the Cryptic Host Specificity of Blastocystis spp. Isolates from Alouatta palliata and A. pigra Howler Monkeys.PLoS One. 2017 Jan 5;12(1):e0169637. doi: 10.1371/journal.pone.0169637. eCollection 2017. PLoS One. 2017. PMID: 28056072 Free PMC article.
-
Expanded host and geographic range of tadpole associations with the Severe Perkinsea Infection group.Biol Lett. 2021 Jun;17(6):20210166. doi: 10.1098/rsbl.2021.0166. Epub 2021 Jun 16. Biol Lett. 2021. PMID: 34129800 Free PMC article.
-
A Novel Parasitoid of Marine Dinoflagellates, Pararosarium dinoexitiosum gen. et sp. nov. (Perkinsozoa, Alveolata), Showing Characteristic Beaded Sporocytes.Front Microbiol. 2021 Nov 29;12:748092. doi: 10.3389/fmicb.2021.748092. eCollection 2021. Front Microbiol. 2021. PMID: 34912310 Free PMC article.
References
-
- Monastersky R. Biodiversity: Life—A status report. Nature. 2014;516(7530):158–161. - PubMed
-
- Collins JP, Storfer A. Global amphibian declines: Sorting the hypotheses. Divers Distrib. 2003;9(2):89–98.
Publication types
MeSH terms
LinkOut - more resources
Full Text Sources
Other Literature Sources
Molecular Biology Databases
