. 2016 Jan;10(1):11-20.
doi: 10.1038/ismej.2015.117. Epub 2015 Aug 11.

The activated sludge ecosystem contains a core community of abundant organisms

Affiliations

The activated sludge ecosystem contains a core community of abundant organisms

Aaron M Saunders et al. ISME J. 2016 Jan.

Abstract

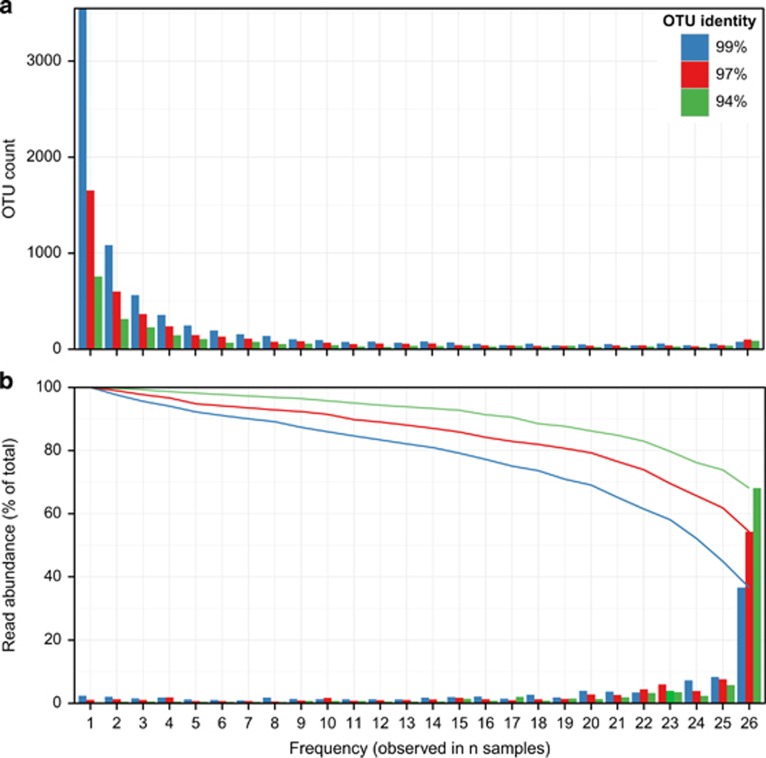
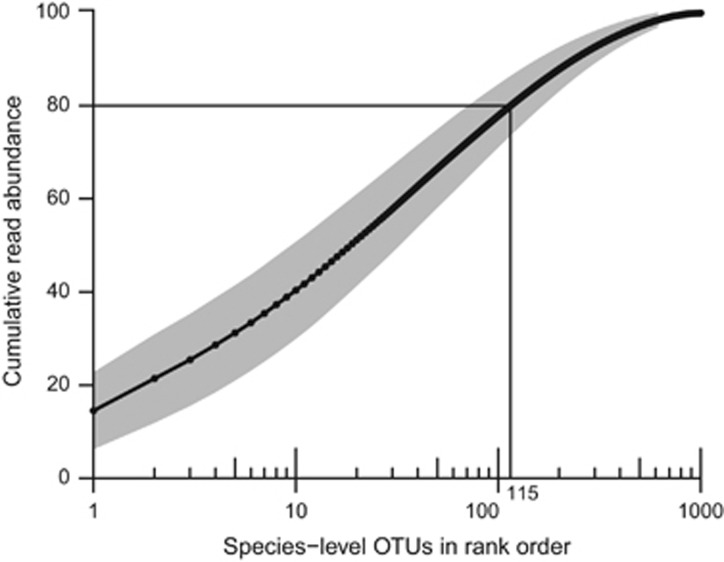
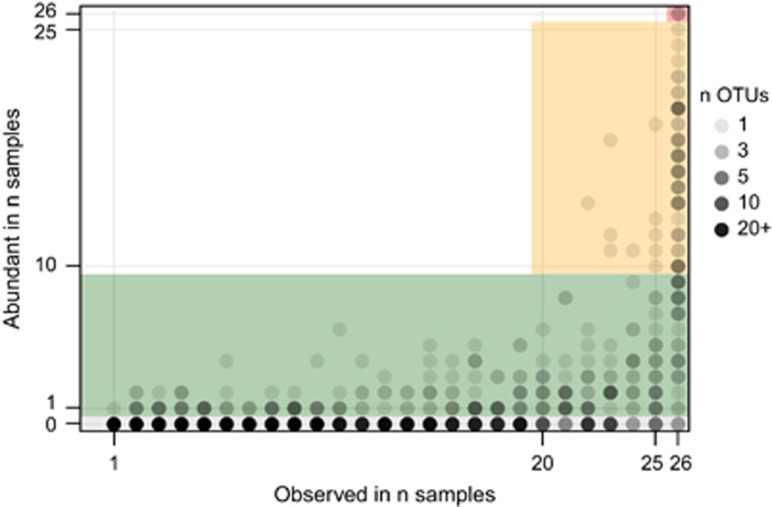
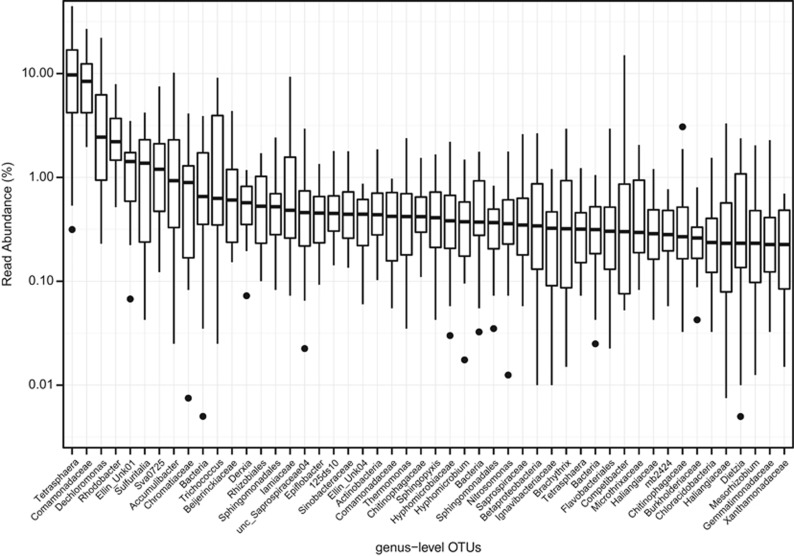
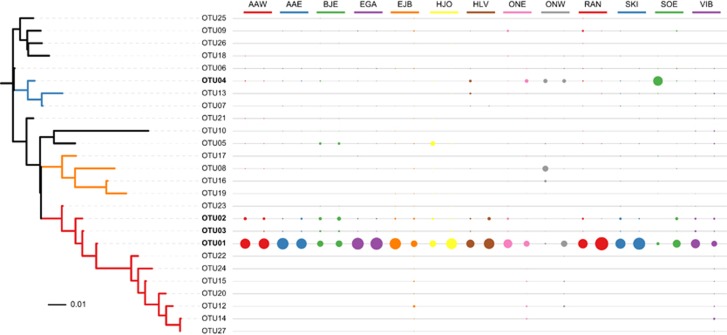
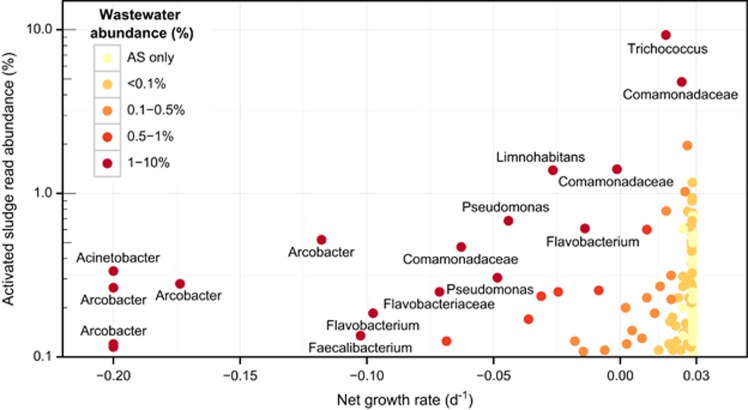
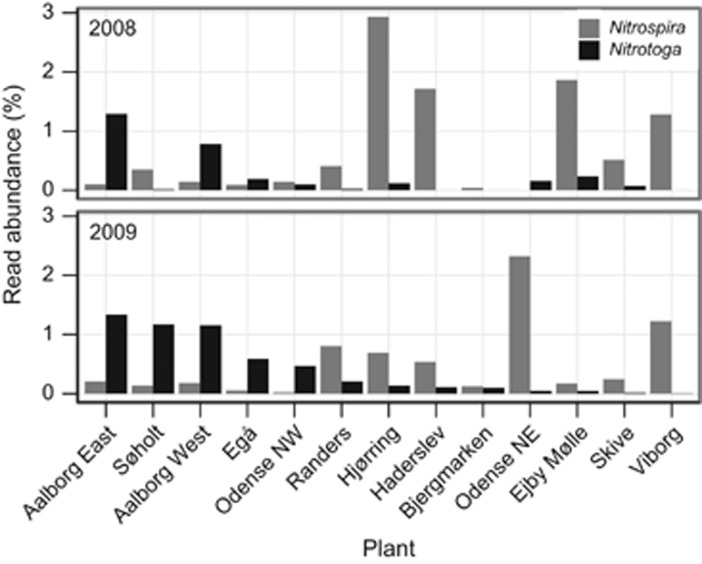
Understanding the microbial ecology of a system requires that the observed population dynamics can be linked to their metabolic functions. However, functional characterization is laborious and the choice of organisms should be prioritized to those that are frequently abundant (core) or transiently abundant, which are therefore putatively make the greatest contribution to carbon turnover in the system. We analyzed the microbial communities in 13 Danish wastewater treatment plants with nutrient removal in consecutive years and a single plant periodically over 6 years, using Illumina sequencing of 16S ribosomal RNA amplicons of the V4 region. The plants contained a core community of 63 abundant genus-level operational taxonomic units (OTUs) that made up 68% of the total reads. A core community consisting of abundant OTUs was also observed within the incoming wastewater to three plants. The net growth rate for individual OTUs was quantified using mass balance, and it was found that 10% of the total reads in the activated sludge were from slow or non-growing OTUs, and that their measured abundance was primarily because of immigration with the wastewater. Transiently abundant organisms were also identified. Among them the genus Nitrotoga (class Betaproteobacteria) was the most abundant putative nitrite oxidizer in a number of activated sludge plants, which challenges previous assumptions that Nitrospira (phylum Nitrospirae) are the primary nitrite-oxidizers in activated sludge systems with nutrient removal.


Figures

Figure 1
Figure 1
Frequency distribution of OTUs across samples. Core OTUs common to all 26 samples. Core and frequently observed OTUs made up a larger fraction of the total reads than transiently observed OTUs. The number of samples in which each OTU is observed against (a) the number of OTUs observed at each frequency and (b) the bars denote the relative read abundance of OTUs observed at each frequency and the lines present the cumulative total these frequencies from most- to least-frequently observed (lines). Colors denote OTUs clustered at genus-level (green, 94%), species-level (red, 97%), subspecies-level (blue, 99%).
Figure 2
Figure 2
Cumulative read abundance across 26 activated sludge samples. Cumulative read abundance (mean±SD) of species-level OTUs plotted in rank order for the 26 samples. In each sample, the 10 most abundant OTUs made up 40% (±10%) of the total reads on average and the 100 most abundant OTUs made up 78% (±6.8%). OTUs were considered abundant in a sample when they were among the OTUs making up the top 80% of reads.
Figure 3
Figure 3
Comparison of observation frequency and frequency of high abundance. Genus-level OTUs were plotted with slight transparency (alpha=0.2) such that darker points indicate more OTUs with those characteristics at that position. The OTUs were then classified as (a) Group 1: always abundant (26 samples, red), (b) Group 2: frequently abundant (⩾10 samples, yellow), (c) Group 3: transiently abundant in ⩾1 sample, green) and (d) Group 4: not abundant in any sample (gray). This was compared with the frequency at which the OTU was observed: transient (<20 samples), frequent (⩾20 samples) or core (26 samples).
Figure 4
Figure 4
Boxplot of the abundance of the top 50 genus-level OTUs (by median). The upper and lower bounds of boxes denote the 25th and 75th percentiles and the lines denote the max and min values, outliers are shown as dots. OTU labels are the lowest assigned taxonomic rank.
Figure 5
Figure 5
Relative abundance of 99% OTUs Tetrasphaera across 13 plants. The relationship between the OTUs is presented as a maximum likelihood phylogenetic tree; the branches are colored to denote OTUs from Clade 1 (blue), Clade 2 (yellow) and Clade 3 (red). The size of the circles denotes the relative abundance of each OTU.
Figure 6
Figure 6
Comparison of the read abundance in the activated sludge and the net growth rate for the Aalborg East plant. Points are colored by their abundance in the influent wastewater, and taxa >1% in the wastewater are named. Few abundant species-level OTUs had a low net growth rate, indicating that their abundance was due to contribution from the influent bacteria.
Figure 7
Figure 7
Read abundance of nitrite-oxidizing bacteria. Nitrospira (gray) and Nitrotoga (black) in activated sludge samples from 13 plants taken during summer of 2008 and 2009. The NOBs in most plants were dominated by Nitrospira, but Nitrotoga dominated in some cases.

References

    1. Alawi M, Lipski A, Sanders T, Spieck E. (2007). Cultivation of a novel cold-adapted nitrite oxidizing betaproteobacterium from the Siberian Arctic. ISME J 1: 256–264. - PubMed
    1. Alawi M, Off S, Kaya M, Spieck E. (2009). Temperature influences the population structure of nitrite-oxidizing bacteria in activated sludge. Environ Microbiol Rep 1: 184–190. - PubMed
    1. Albertsen M, Hugenholtz P, Skarshewski A, Nielsen KL, Tyson GW, Nielsen PH. (2013). Genome sequences of rare, uncultured bacteria obtained by differential coverage binning of multiple metagenomes. Nat Biotechnol 31: 533–538. - PubMed
    1. Berry D, Ben Mahfoudh K, Wagner M, Loy A. (2011). Barcoded primers used in multiplex amplicon pyrosequencing bias amplification. Appl Environ Microbiol 77: 7846–7849. - PMC - PubMed
    1. Caporaso JG, Kuczynski J, Stombaugh J, Bittinger K, Bushman FD, Costello EK et al. (2010). QIIME allows analysis of high-throughput community sequencing data. Nat Methods 7: 335–336. - PMC - PubMed

Publication types