

Validation of Next-Generation Sequencing of Entire Mitochondrial Genomes and the Diversity of Mitochondrial DNA Mutations in Oral Squamous Cell Carcinoma
- PMID: 26262956
- PMCID: PMC4532422
- DOI: 10.1371/journal.pone.0135643
Validation of Next-Generation Sequencing of Entire Mitochondrial Genomes and the Diversity of Mitochondrial DNA Mutations in Oral Squamous Cell Carcinoma
Abstract
Background: Oral squamous cell carcinoma (OSCC) is mainly caused by smoking and alcohol abuse and shows a five-year survival rate of ~50%. We aimed to explore the variation of somatic mitochondrial DNA (mtDNA) mutations in primary oral tumors, recurrences and metastases.
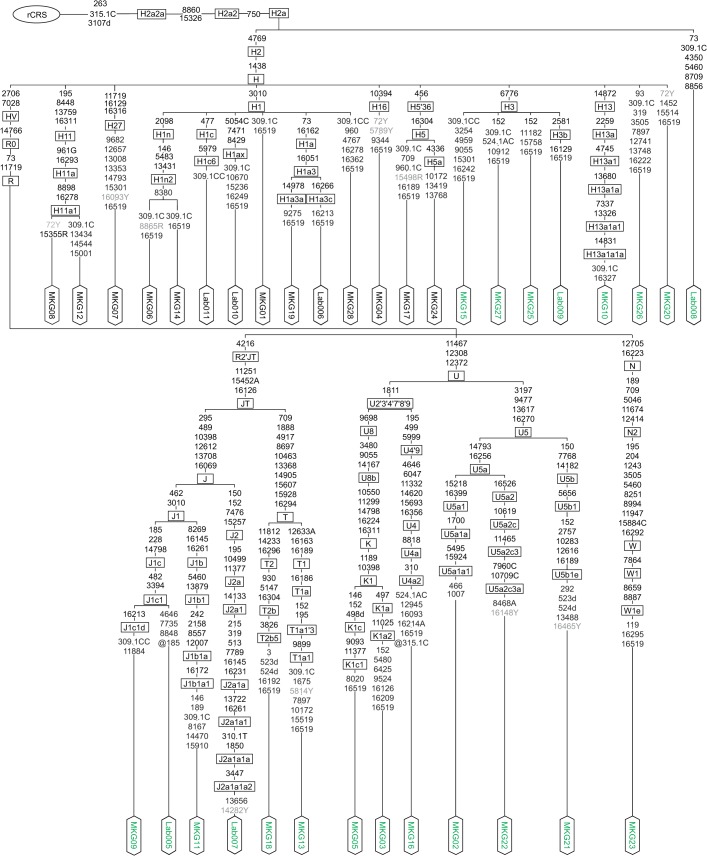
Methods: We performed an in-depth validation of mtDNA next-generation sequencing (NGS) on an Illumina HiSeq 2500 platform for its application to cancer tissues, with the goal to detect low-level heteroplasmies and to avoid artifacts. Therefore we genotyped the mitochondrial genome (16.6 kb) from 85 tissue samples (tumors, recurrences, resection edges, metastases and blood) collected from 28 prospectively recruited OSCC patients applying both Sanger sequencing and high-coverage NGS (~35,000 reads per base).
Results: We observed a strong correlation between Sanger sequencing and NGS in estimating the mixture ratio of heteroplasmies (r = 0.99; p<0.001). Non-synonymous heteroplasmic variants were enriched among cancerous tissues. The proportions of somatic and inherited variants in a given gene region were strongly correlated (r = 0.85; p<0.001). Half of the patients shared mutations between benign and cancerous tissue samples. Low level heteroplasmies (<10%) were more frequent in benign samples compared to tumor samples, where heteroplasmies >10% were predominant. Four out of six patients who developed a local tumor recurrence showed mutations in the recurrence that had also been observed in the primary tumor. Three out of five patients, who had tumor metastases in the lymph nodes of their necks, shared mtDNA mutations between primary tumors and lymph node metastases. The percentage of mutation heteroplasmy increased from the primary tumor to lymph node metastases.
Conclusions: We conclude that Sanger sequencing is valid for heteroplasmy quantification for heteroplasmies ≥10% and that NGS is capable of reliably detecting and quantifying heteroplasmies down to the 1%-level. The finding of shared mutations between primary tumors, recurrences and metastasis indicates a clonal origin of malignant cells in oral cancer.
Conflict of interest statement
Figures


References
-
- Perez-Sayans M, Somoza-Martin JM, Barros-Angueira F, Reboiras-Lopez MD, Gandara Rey JM, Garcia-Garcia A. Genetic and molecular alterations associated with oral squamous cell cancer (Review). Oncol Rep. 2009;22(6):1277–82. - PubMed
-
- Heck JE, Berthiller J, Vaccarella S, Winn DM, Smith EM, Shan'gina O, et al. Sexual behaviours and the risk of head and neck cancers: a pooled analysis in the International Head and Neck Cancer Epidemiology (INHANCE) consortium. Int J Epidemiol. 2010;39(1):166–81. dyp350 [pii]; 10.1093/ije/dyp350 - DOI - PMC - PubMed
-
- Wolff D, Hassfeld S, Hofele C. Influence of marginal and segmental mandibular resection on the survival rate in patients with squamous cell carcinoma of the inferior parts of the oral cavity. J Craniomaxillofac Surg. 2004;32(5):318–23. 10.1016/j.jcms.2004.05.005 S1010-5182(04)00086-1 [pii]. - DOI - PubMed
Publication types
MeSH terms
Substances
Associated data
- Actions
- Actions
- Actions
- Actions
- Actions
- Actions
- Actions
- Actions
- Actions
- Actions
- Actions
- Actions
- Actions
- Actions
- Actions
- Actions
- Actions
- Actions
- Actions
- Actions
- Actions
- Actions
- Actions
- Actions
- Actions
- Actions
- Actions
- Actions
- Actions
- Actions
- Actions
- Actions
- Actions
- Actions
- Actions
LinkOut - more resources
Full Text Sources
Other Literature Sources
Medical
