. 2015 Aug 11;10(8):e0133660.
doi: 10.1371/journal.pone.0133660. eCollection 2015.

GDSCalc: A Web-Based Application for Evaluating Discrete Graph Dynamical Systems

Affiliations

GDSCalc: A Web-Based Application for Evaluating Discrete Graph Dynamical Systems

Sherif H Elmeligy Abdelhamid et al. PLoS One. .

Abstract

Discrete dynamical systems are used to model various realistic systems in network science, from social unrest in human populations to regulation in biological networks. A common approach is to model the agents of a system as vertices of a graph, and the pairwise interactions between agents as edges. Agents are in one of a finite set of states at each discrete time step and are assigned functions that describe how their states change based on neighborhood relations. Full characterization of state transitions of one system can give insights into fundamental behaviors of other dynamical systems. In this paper, we describe a discrete graph dynamical systems (GDSs) application called GDSCalc for computing and characterizing system dynamics. It is an open access system that is used through a web interface. We provide an overview of GDS theory. This theory is the basis of the web application; i.e., an understanding of GDS provides an understanding of the software features, while abstracting away implementation details. We present a set of illustrative examples to demonstrate its use in education and research. Finally, we compare GDSCalc with other discrete dynamical system software tools. Our perspective is that no single software tool will perform all computations that may be required by all users; tools typically have particular features that are more suitable for some tasks. We situate GDSCalc within this space of software tools.


Conflict of interest statement

Competing Interests: The authors have declared that no competing interests exist.

Figures

Fig 1
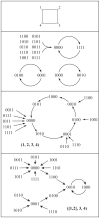
Fig 1. Phase spaces for three GDSs.
The bidirected graph X = Circle4 (top), and the phase spaces of the synchronous GDS; a sequential GDS with update permutation π = (1,2,3,4); and a block sequential GDS with block permutation π B = ([1, 2],3,4). All vertices use the nor function.
Fig 2
Fig 2. Sequence of high-level user activities to run an analysis in GDSC.
Fig 3
Fig 3. Experimental results generated with GDSC showing the maximum cycle length versus number of graph vertices when the condition Δ = k 10k 01 ≤ 1 is minimally violated.
The goal is to produce GDSs that generate larger limit cycles than fixed points. The three tree structures on the left were found experimentally, and results were used to prove that there exist graphs with particular structures that produce limit cycles of any specified size for sequential update (see plot at right). Functional forms of these relationships are given in [8]. These structures differ in the smallest limit cycles they can produce and in the maximum cycle size for a given number of vertices. Data for the sequential update scheme are presented as solid lines; limit cycle size increases without bound for increasing graph size. Data for synchronous update, for all graph structures, is the dashed black curve.
Fig 4
Fig 4. A 3-vertex-state, multi-threshold system where each vertex state transition is governed by a distinct threshold.
Threshold k ij governs the transition from state i to j.
Fig 5
Fig 5. Results that guided proofs of bifurcations in r-state sequential GDS maps.
When the threshold vector is k = (k 01, k 10, k 12, k 21, k 02, k 20) = (2,3,6,6,4,5), the maximum cycle size ℓ = 1 is fixed for all n of Circlen because the fixed point conditions do not depend on n. When k 01 is reduced from 2 to 1, the maximum cycle length increases with number of vertices in Circlen graphs as ℓ = n − 1.
Fig 6
Fig 6. Phase space for a bithreshold sequential GDS and an ergodic set for the attractor graph.
A bithreshold sequential GDS with (k 01, k 10) = (1,3) and permutation π = (1,2,4,3). The four basins of attraction in the phase space are highlighted (top). The resulting attractor graph (bottom) forms an ergodic set (i.e., a strongly connected component) of size 4.
Fig 7
Fig 7. Representative results on ergodic sets generated with the help of GDSC.
The 49-vertex graph X on the left has n s = 3 subgraphs X i, 1 ≤ in s, shown in blue, orange, and maroon. There are three results implied by experiments on smaller graphs and theory-based extensions to larger graphs; see text for details. All three of these results significantly extend characterizations of ergodic sets.
Fig 8
Fig 8. Biological network from [5] modeled by GDSC.
Edge weights are given next to edges, and vertex thresholds are specified inside the vertices.

References

    1. Epstein J (2002) Modeling civil violence: An agent-based computational approach. PNAS 99: 7243–7250. 10.1073/pnas.092080199 - DOI - PMC - PubMed
    1. Valente TW (2012) Network interventions. Science 337: 49–53. 10.1126/science.1217330 - DOI - PubMed
    1. Hatfield E, Cacioppo JT, Rapson RL (1994) Emotional Contagion. Cambridge University Press.
    1. Ugander J, Backstrom L, Marlow C, Kleinberg J (2012) Structural diversity in social contagion. Proceedings of the Naitonal Academy of Sciences (PNAS 2012) 109: 5962–5966. 10.1073/pnas.1116502109 - DOI - PMC - PubMed
    1. Demongeot J, Goles E, Morvan M, Noual M, Sene S (2010) Attraction basins as gauges of robustness against boundary conditions in biological complex systems. PLoS One 5: e11793–1–e11793–18. 10.1371/journal.pone.0011793 - DOI - PMC - PubMed

Publication types

LinkOut - more resources