. 2015 Aug 11;10(8):e0135358.
doi: 10.1371/journal.pone.0135358. eCollection 2015.

The Role of MKP-1 in the Anti-Proliferative Effects of Glucocorticoids in Primary Rat Pre-Osteoblasts

Affiliations

The Role of MKP-1 in the Anti-Proliferative Effects of Glucocorticoids in Primary Rat Pre-Osteoblasts

Micheline Sanderson et al. PLoS One. .

Abstract

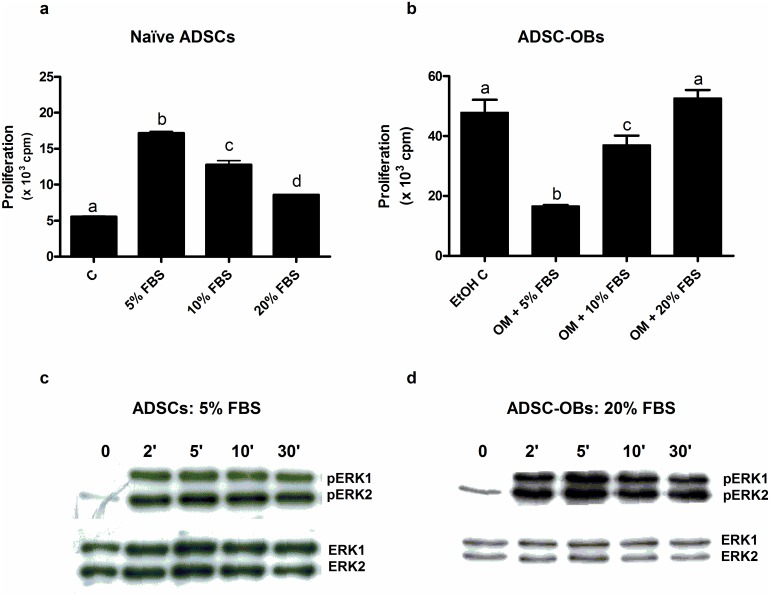
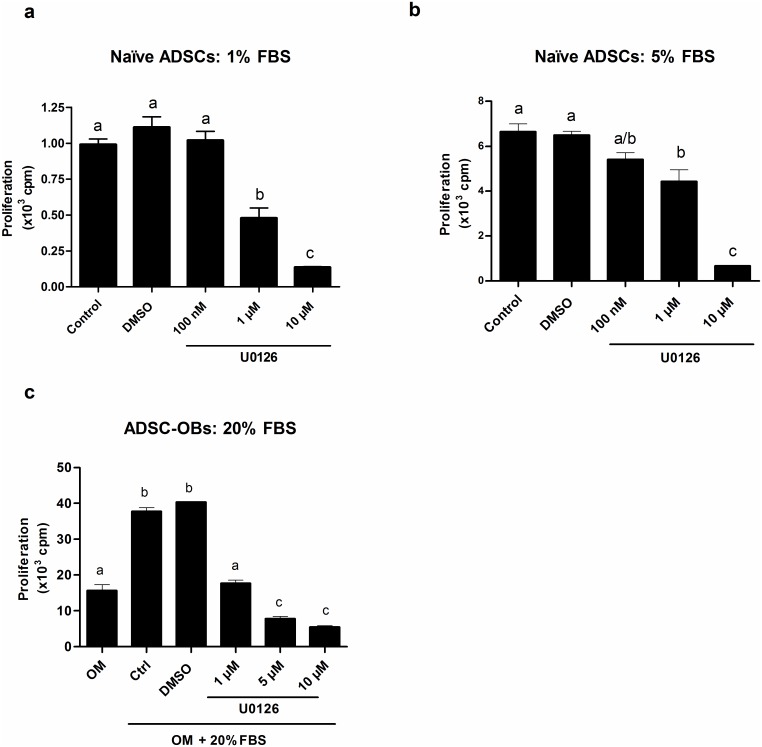
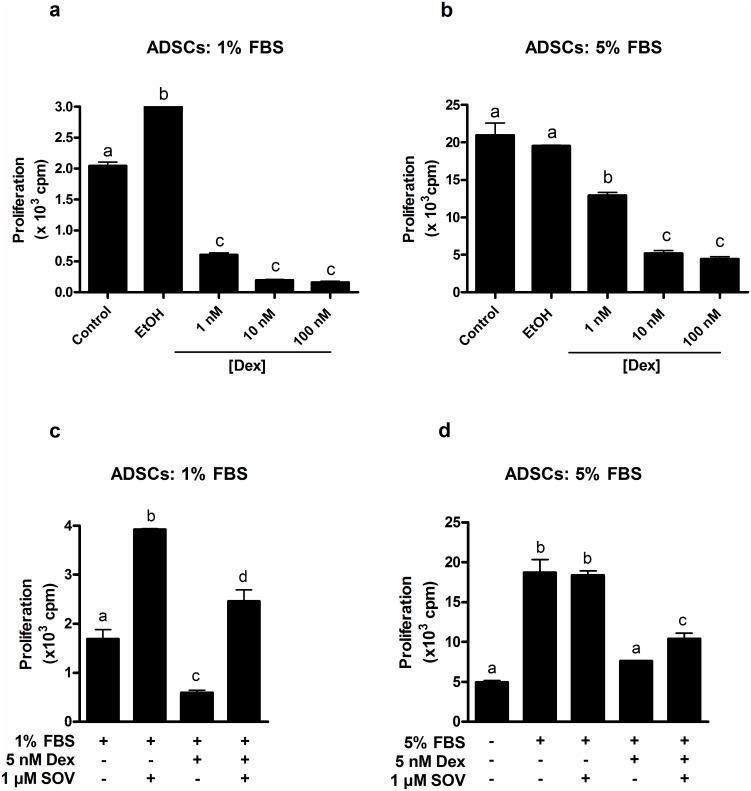
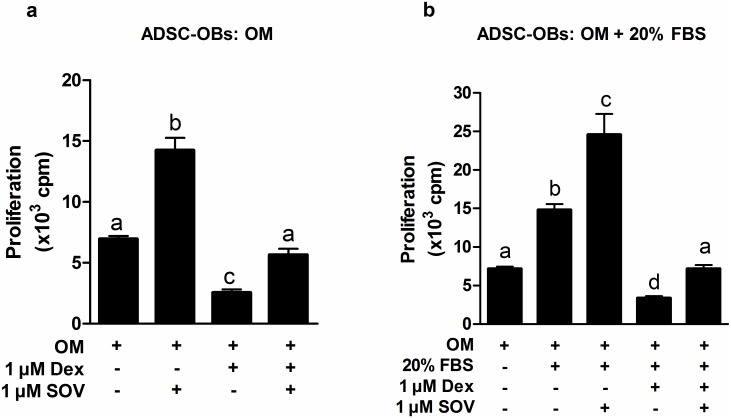
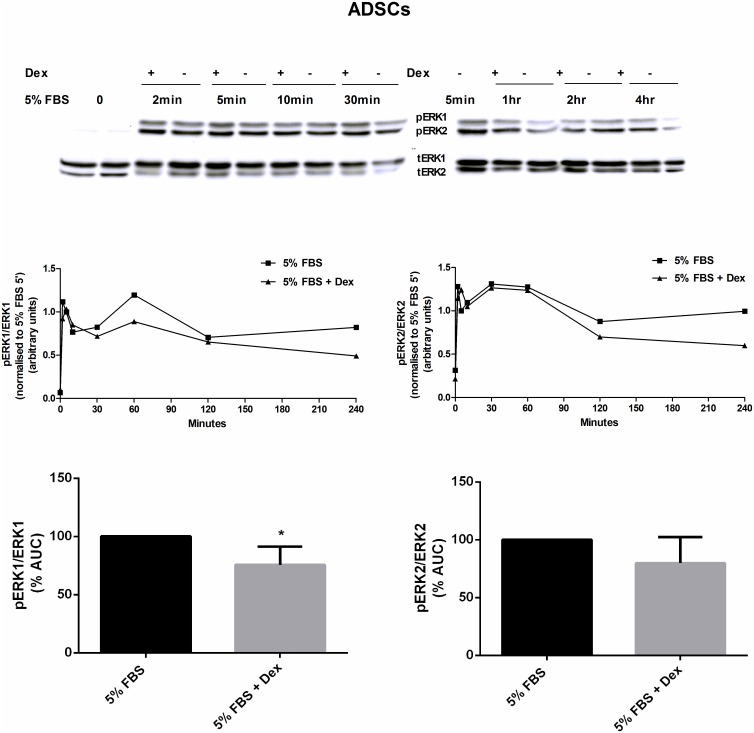
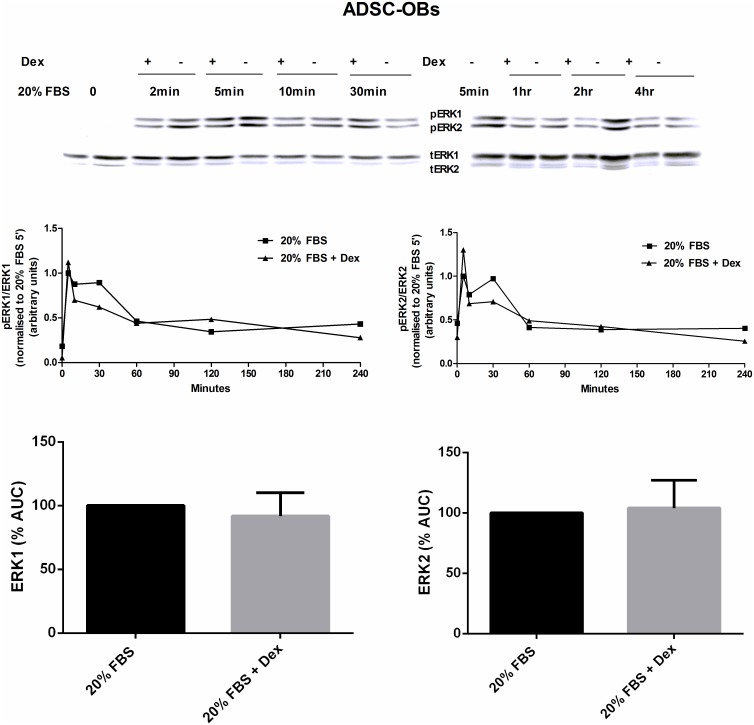
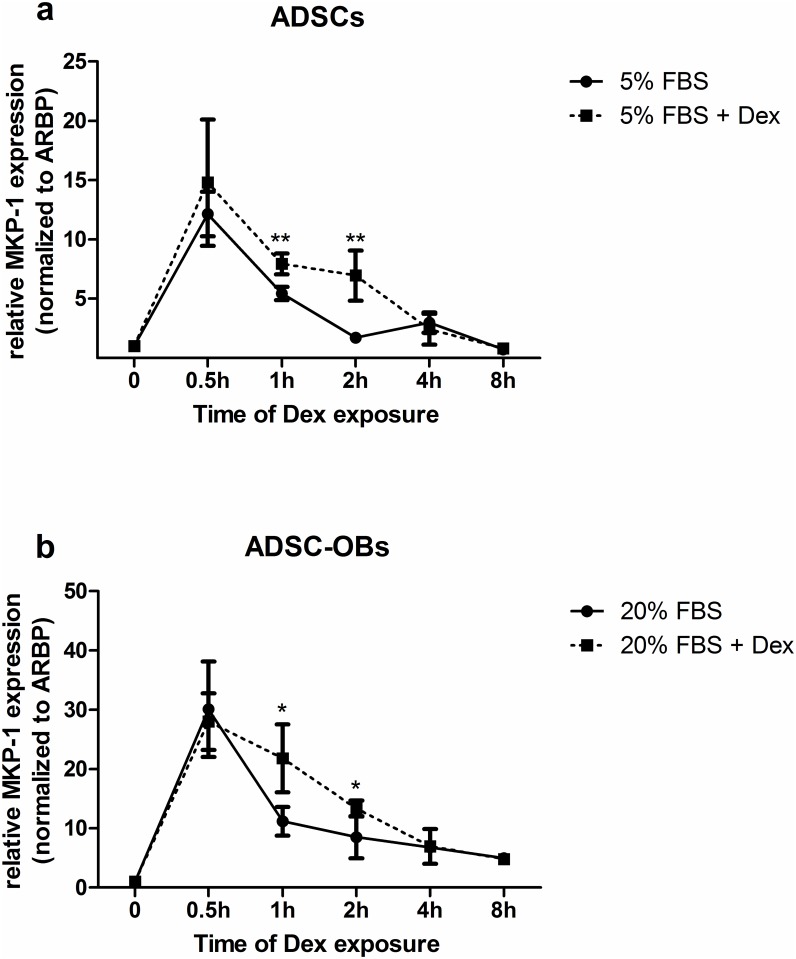
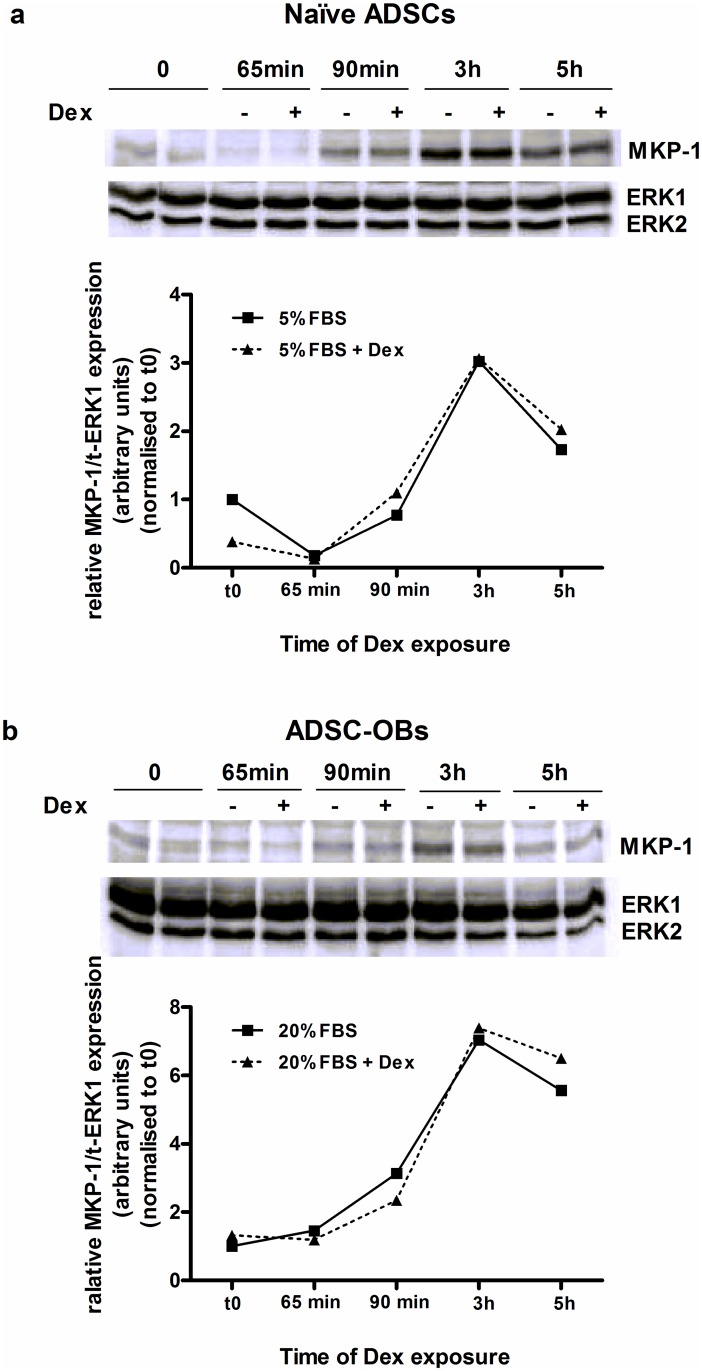
Glucocorticoid (GC)-induced osteoporosis has been attributed to a GC-induced suppression of pre-osteoblast proliferation. Our previous work identified a critical role for mitogen-activated protein kinase (MAPK) phosphatase-1 (MKP-1) in mediating the anti-proliferative effects of GCs in immortalized pre-osteoblasts, but we subsequently found that MKP-1 null mice were not protected against the pathological effects of GCs on bone. In order to reconcile this discrepancy, we have assessed the effects of GCs on proliferation, activation of the MAPK ERK1/2 and MKP-1 expression in primary adipose-derived stromal cells (ADSCs) and ADSC-derived pre-osteoblasts (ADSC-OBs). ADSCs were isolated by means of collagenase digestion from adipose tissue biopsies harvested from adult male Wistar rats. ADSC-OBs were prepared by treating ADSCs with osteoblast differentiation media for 7 days. The effects of increasing concentrations of the GC dexamethasone on basal and mitogen-stimulated cell proliferation were quantified by tritiated thymidine incorporation. ERK1/2 activity was measured by Western blotting, while MKP-1 expression was quantified on both RNA and protein levels, using semi-quantitative real-time PCR and Western blotting, respectively. GCs were strongly anti-proliferative in both naïve ADSCs and ADSC-OBs, but had very little effect on mitogen-induced ERK1/2 activation and did not upregulate MKP-1 protein expression. These findings suggest that the anti-proliferative effects of GCs in primary ADSCs and ADSC-OBs in vitro do not require the inhibition of ERK1/2 activation by MKP-1, which is consistent with our in vivo findings in MKP-1 null mice.


Conflict of interest statement

Competing Interests: The authors have declared that no competing interests exist.

Figures

Fig 1
Fig 1. Stimulation of proliferation and ERK1/2 activation by FBS.
(a): Naïve ADSCs were plated in 24-well plates and grown to 80% confluence, after which they were cultured in DMEM + 1% FBS for 24h. Cells were subsequently treated for 24h with DMEM supplemented with FBS at the concentrations given, and proliferation was quantified by means of [3H]dT incorporation. (b): Naïve ADSCs were plated in 24-well plates and grown to 100% confluence, upon which they were treated for 7 days with vehicle control (0.1% EtOH) or with OM to generate ADSC-OBs, which were subsequently treated for 24h with OM supplemented with FBS at the concentrations indicated. Proliferation was quantified as for (a). (c,d): Western blotting for total ERK1/2 and phospho-ERK1/2 was subsequently performed on cell lysates. (c): Naïve ADSCs were plated in 100mm dishes and grown to 80% confluence, after which they were cultured in DMEM + 1% FBS for 24h. Cells were subsequently treated with DMEM + 5% FBS for the time-points indicated, and cell lysates were prepared. (d): ADSC-OBs were generated as for (a) and subsequently treated with OM + 20% FBS for the time-points indicated, after which cell lysates were prepared. Panels a and b show the representative results of three independent experiments, performed in triplicate. Panels c and d show the representative results of three independent experiments. Different lower-case letters indicate statistically significant differences (P < 0.05).
Fig 2
Fig 2. ERK1/2 activity is essential for basal and mitogen-stimulated proliferation.
(a,b): Naïve ADSCs were plated in 24-well plates and grown to 80% confluence, after which they were cultured in DMEM + 1% FBS for 24h and subsequently treated with (a) DMEM + 1% FBS, maintaining basal proliferation or (b) mitogenically stimulated with DMEM + 5% FBS, in the absence (DMSO control) or presence of different concentrations of U0126, for 24h. Proliferation was quantified by means of [3H]dT incorporation. (c): Naïve ADSCs were plated in 24-well plates, grown to 100% confluence and treated with OM for 7 days to generate ADSC-OBs, which were subsequently mitogenically stimulated with OM + 20% FBS, in the absence (DMSO control) or presence of different concentrations of U0126, for 24h. Proliferation was quantified as for (a). Panels a-c show the representative results of three independent experiments, performed in triplicate. Different lower-case letters indicate statistically significant differences (P < 0.05).
Fig 3
Fig 3. The anti-proliferative effects of GCs on naïve ADSCs are reversed by sodium orthovanadate (SOV).
(a-d): Naïve ADSCs were plated into 24-well plates and grown to 80% confluence, after which they were cultured in DMEM + 1% FBS for 24h. (a,b): Cells were subsequently treated for 24h with (a) DMEM + 1% FBS or (b) DMEM + 5% FBS, in the absence (EtOH) or presence of different concentrations of dexamethasone (Dex). (c,d): Cells were subsequently treated for 24h with (c) DMEM + 1% FBS or (d) DMEM + 5% FBS in the absence or presence of 5 nM Dex and 1 μM SOV. For a-d, proliferation was quantified by means of [3H]dT incorporation. All panels show the representative results of three independent experiments, performed in triplicate. Different lower-case letters indicate statistically significant differences (P < 0.05).
Fig 4
Fig 4. Sodium orthovanadate (SOV) also reversed the anti-proliferative effects of GCs on ADSC-OBs.
(a,b): Naïve ADSCs were plated in 24-well plates, grown to 100% confluence and treated with OM for 7 days to generate ADSC-OBs, which were subsequently cultured for 24h in (a) OM + 10% FBS or (b) OM + 20% FBS, in the absence or presence of 1 μM Dex and 1 μM SOV. Proliferation was quantified by means of [3H]dT incorporation. All panels show the representative results of three independent experiments, performed in triplicate. Different lower-case letters indicate statistically significant differences (P < 0.05).
Fig 5
Fig 5. The effect of GC treatment on mitogen-stimulated ERK1/2 activity in ADSCs.
Naïve ADSCs were plated in 100mm dishes and grown to 80% confluence, after which they were cultured in DMEM + 1% FBS for 24h. Cells were subsequently pretreated with 10 nM Dex (in the presence of standard growth media: DMEM + 10% FBS) for 1 hour, and then mitogenically stimulated with DMEM + 5% FBS, in the presence of 10 nM Dex (5% FBS + Dex), for the time-points indicated. Control cells were treated with DMEM + 5% FBS (5% FBS). Western blotting for total ERK1/2 and phospho-ERK1/2 was subsequently performed on cell lysates. Immunoresponsive bands were quantified and plotted as the relative intensity of the signal over time, and the area under the curve (AUC) was calculated using Prism software. The representative results of four independent experiments are shown, with * = P < 0.05.
Fig 6
Fig 6. The effect of GC treatment on mitogen-stimulated ERK1/2 activity in ADSC-OBs.
Naïve ADSCs were plated in 100mm dishes, grown to 100% confluence and treated with OM for 7 days to generate ADSC-OBs, which were subsequently pretreated with 1 μM Dex (in the presence of OM) for 1 hour, and then mitogenically stimulated with OM + 20% FBS, in the presence of 1 μM Dex (20% FBS + Dex), for the time-points indicated. Control cells were treated with OM + 20% FBS (20% FBS). Western blotting for total ERK1/2 and phospho-ERK1/2 was subsequently performed on cell lysates. Immunoresponsive bands were quantified and plotted as the relative intensity of the signal over time, and the area under the curve (AUC) was calculated using Prism software. The representative results of four independent experiments are shown, with * = P < 0.05.
Fig 7
Fig 7. MKP-1 RNA expression is upregulated by mitogenic stimulation and by Dex.
(a): Naïve ADSCs were plated in 60mm dishes and grown to 80% confluence before being treated with DMEM + 5% FBS in the absence (solid line) or presence (dotted line) of 1 μM Dex for various time points, after which RNA was isolated. (b): Naïve ADSCs were plated in 60mm dishes, grown to 100% confluence and treated with OM for 7 days to generate ADSC-OBs, which were subsequently treated with OM + 20% FBS in the absence (solid line) or presence (dotted line) of 1 μM Dex for various time points before RNA was isolated. MKP-1 RNA expression levels were quantified by means of qRT-PCR and normalized to expression of the house-keeping gene ARBP. Normalized MKP-1 expression levels in untreated control samples were set as 1. All panels show the representative results of four independent experiments, performed in triplicate. * = P<0.05, ** = P<0.01.
Fig 8
Fig 8. MKP-1 protein expression is upregulated by mitogenic stimulation, but unaffected by Dex.
(a): Naïve ADSCs were plated in 100mm dishes and grown until 80% confluence, after which they were pre-treated for 1 hour with 1 μM Dex (in standard growth media: DMEM + 10% FBS) and subsequently mitogenically stimulated with DMEM + 5% FBS, in the presence of 1 μM Dex, for 5 minutes, 30 minutes, 2 hours and 4 hours (5% FBS + Dex). Control cells were treated with DMEM + 5% FBS for 5 minutes, 30 minutes, 2 hours and 4 hours (5% FBS). (b): Naïve ADSCs were plated in 100mm dishes, grown until 100% confluence and with OM for 7 days to generate ADSC-OBs, which were pre-treated for 1 hour with 1 μM Dex (in OM) and subsequently treated with OM + 20% FBS, in the presence of 1 μM Dex (20% FBS + Dex), for the time-points mentioned in (a). Control cells were treated with OM + 20% FBS for the time-points mentioned in (a). Cell lysates were prepared and Western blotting for MKP-1 and total ERK1/2 was performed. MKP-1 protein expression levels (normalized to total ERK1) in untreated control samples were set as 1. All panels show the representative results of four independent experiments.

Similar articles

Cited by

References

    1. Canalis E. Clinical review 83: Mechanisms of glucocorticoid action in bone: implications to glucocorticoid-induced osteoporosis. J Clin Endocrinol Metab. 1996; 81: 3441–3447. - PubMed
    1. Hahn TJ, Halstead LR, Teitelbaum SL, Hahn BH. Altered mineral metabolism in glucocorticoid-induced osteopenia. Effect of 25-hydroxyvitamin D administration. J Clin Invest. 1979; 64: 655–665. - PMC - PubMed
    1. Van Staa TP, Leufkens HG, Abenhaim L, Zhang B, Cooper C. Use of oral corticosteroids and risk of fractures. J Bone Miner Res. 2000; 15: 993–1000. - PubMed
    1. Canalis E, Mazziotti G, Giustina A, Bilezikian JP. Glucocorticoid-induced osteoporosis: pathophysiology and therapy. Osteoporos Int. 2007; 18: 1319–1328. - PubMed
    1. Ishida Y, Heersche JN. Glucocorticoid-induced osteoporosis: both in vivo and in vitro concentrations of glucocorticoids higher than physiological levels attenuate osteoblast differentiation. J Bone Miner Res. 1998; 13: 1822–1826. - PubMed

Publication types

MeSH terms

Substances