miR-98 and its host gene Huwe1 target Caspase-3 in Silica nanoparticles-treated male germ cells
- PMID: 26263183
- PMCID: PMC4531786
- DOI: 10.1038/srep12938
miR-98 and its host gene Huwe1 target Caspase-3 in Silica nanoparticles-treated male germ cells
Abstract
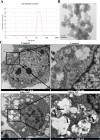
Silica nanoparticles (NP) is one of the most commonly used nanomaterials with potential health hazards. However, the effects of Silica NP on germ cells and the underlying mechanisms are still unclear. In this study, GC-2 and TM-4, which are two different types of male germ cells were exposed to Silica NP for 24h, and then general cytotoxicity and multi-parameter cytotoxicity were evaluated. Our results showed that Silica NP could induce apoptosis in GC-2 cells. Transmission electron microscopy (TEM) results showed that Silica NP was localized in the lysosomes of GC-2 cells. High content screening (HCS) showed that Silica NP exposure could increased cell permeabilization and decreased mitochondrial membrane potential in GC-2 cells. The mRNA and protein levels of apoptosis markers (Bax, Caspase-3, Caspase-9) in GC-2 cells were significantly increased, while Bcl-2 was decreased. Accordingly, the expression level of miR-98, which can regulate Caspase-3, was significantly decreased. Huwe1, the host gene of miR-98, was positively associated with miR-98 expression after Silica NP exposure. Dual luciferase reporter assay suggested that miR-98 directly targets Caspase-3. These results suggest that Silica NP induces apoptosis via loss of mitochondrial membrane potential and Caspase-3 activation, while miR-98 plays key role in modulating this effect.
Figures


Similar articles
-
Deregulated miR-155 promotes Fas-mediated apoptosis in human intervertebral disc degeneration by targeting FADD and caspase-3.J Pathol. 2011 Oct;225(2):232-42. doi: 10.1002/path.2931. Epub 2011 Jun 27. J Pathol. 2011. PMID: 21706480
-
The comparative effects of mesoporous silica nanoparticles and colloidal silica on inflammation and apoptosis.Biomaterials. 2011 Dec;32(35):9434-43. doi: 10.1016/j.biomaterials.2011.08.042. Epub 2011 Sep 1. Biomaterials. 2011. PMID: 21889200
-
Cytotoxicity and mitochondrial damage caused by silica nanoparticles.Toxicol In Vitro. 2011 Dec;25(8):1619-29. doi: 10.1016/j.tiv.2011.06.012. Epub 2011 Jun 24. Toxicol In Vitro. 2011. PMID: 21723938
-
Induction of apoptosis and growth arrest in human breast carcinoma cells by a snake (Walterinnesia aegyptia) venom combined with silica nanoparticles: crosstalk between Bcl2 and caspase 3.Cell Physiol Biochem. 2012;30(3):653-65. doi: 10.1159/000341446. Epub 2012 Jul 30. Cell Physiol Biochem. 2012. PMID: 22854437
-
Luteolin Inhibits Ischemia/Reperfusion-Induced Myocardial Injury in Rats via Downregulation of microRNA-208b-3p.PLoS One. 2015 Dec 14;10(12):e0144877. doi: 10.1371/journal.pone.0144877. eCollection 2015. PLoS One. 2015. PMID: 26658785 Free PMC article.
Cited by
-
PLAC8 gene knockout increases the radio-sensitivity of xenograft tumors in nude mice with nasopharyngeal carcinoma by promoting apoptosis.Am J Transl Res. 2021 Jun 15;13(6):5985-6000. eCollection 2021. Am J Transl Res. 2021. PMID: 34306339 Free PMC article.
-
Expression profiles and function analysis of microRNAs in postovulatory aging mouse oocytes.Aging (Albany NY). 2017 Apr;9(4):1186-1201. doi: 10.18632/aging.101219. Aging (Albany NY). 2017. PMID: 28394765 Free PMC article.
-
An Analysis of Mechanisms for Cellular Uptake of miRNAs to Enhance Drug Delivery and Efficacy in Cancer Chemoresistance.Noncoding RNA. 2021 Apr 16;7(2):27. doi: 10.3390/ncrna7020027. Noncoding RNA. 2021. PMID: 33923485 Free PMC article. Review.
-
PPARγ increases HUWE1 to attenuate NF-κB/p65 and sickle cell disease with pulmonary hypertension.Blood Adv. 2021 Jan 26;5(2):399-413. doi: 10.1182/bloodadvances.2020002754. Blood Adv. 2021. PMID: 33496741 Free PMC article.
-
Evaluation of immunoresponses and cytotoxicity from skin exposure to metallic nanoparticles.Int J Nanomedicine. 2018 Aug 1;13:4445-4459. doi: 10.2147/IJN.S170745. eCollection 2018. Int J Nanomedicine. 2018. PMID: 30122919 Free PMC article. Review.
References
-
- Knopp D., Tang D., Niessner R. Review: bioanalytical applications of biomolecule- functionalized nanometer-sized doped silica particles. Anal. Chim. Acta. 647, 14–30 (2009). - PubMed
-
- Terlega K., Latocha M. Nanotechnology future of medicine. Pol. Merkur. Lekarski. 33, 229–232 (2012). - PubMed
-
- Augustin M. A., Sanguansri P. Nanostructured Materials in the Food Industry. Adv. Food. Nutr. Res. 58, 183–213 (2009). - PubMed
-
- Dekkers S. et al. Presence and risks of nanosilica in food products. Nanotoxicology. 5, 393–405 (2011). - PubMed
Publication types
MeSH terms
Substances
LinkOut - more resources
Full Text Sources
Other Literature Sources
Research Materials
Miscellaneous

