. 2015 Aug 12:15:29.
doi: 10.1186/s12880-015-0068-x.

Metrics for evaluating 3D medical image segmentation: analysis, selection, and tool

Affiliations

Metrics for evaluating 3D medical image segmentation: analysis, selection, and tool

Abdel Aziz Taha et al. BMC Med Imaging. .

Abstract

Background: Medical Image segmentation is an important image processing step. Comparing images to evaluate the quality of segmentation is an essential part of measuring progress in this research area. Some of the challenges in evaluating medical segmentation are: metric selection, the use in the literature of multiple definitions for certain metrics, inefficiency of the metric calculation implementations leading to difficulties with large volumes, and lack of support for fuzzy segmentation by existing metrics.

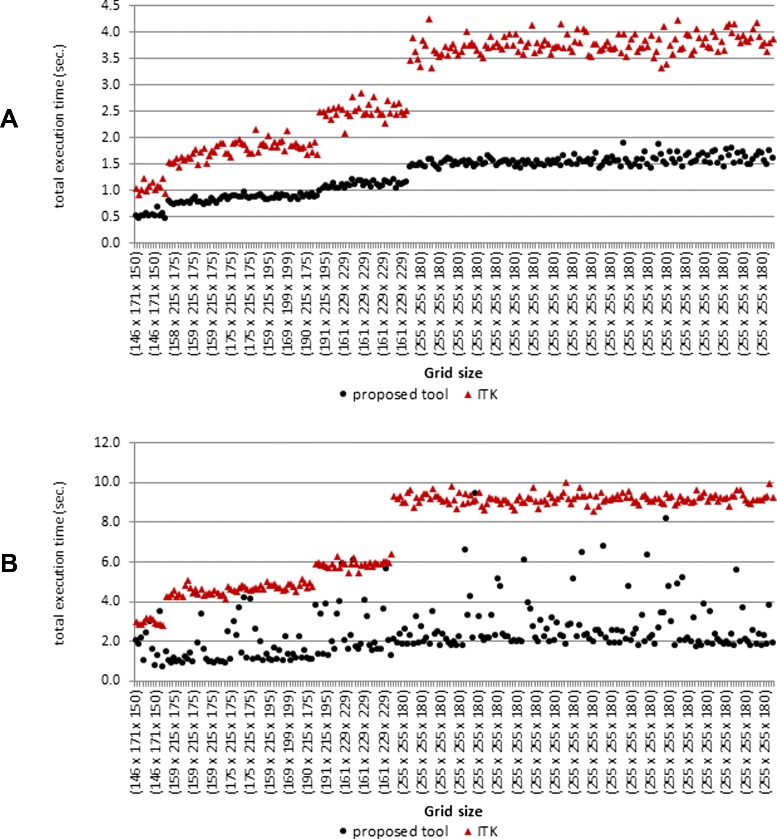
Result: First we present an overview of 20 evaluation metrics selected based on a comprehensive literature review. For fuzzy segmentation, which shows the level of membership of each voxel to multiple classes, fuzzy definitions of all metrics are provided. We present a discussion about metric properties to provide a guide for selecting evaluation metrics. Finally, we propose an efficient evaluation tool implementing the 20 selected metrics. The tool is optimized to perform efficiently in terms of speed and required memory, also if the image size is extremely large as in the case of whole body MRI or CT volume segmentation. An implementation of this tool is available as an open source project.

Conclusion: We propose an efficient evaluation tool for 3D medical image segmentation using 20 evaluation metrics and provide guidelines for selecting a subset of these metrics that is suitable for the data and the segmentation task.


Figures

Fig. 1
Fig. 1
Illustration of the optimizations used in calculating the average distance(AVD). In 1 and 2, the images A and B, defined on the same grid, are to be compared using the AVD. In 3, the intersection of the images is identified. In 4, the pairwise distance between point in the intersection is zero, therefore these distances are excluded from the calculation. In 5, to find the minimum distance from a point in A to the the image B, only the boundary voxels of B are considered. In 6, likewise to find the minimum distance from a point in B to the A, only the boundary voxels of A considered. In 7 and 8, the boundary voxels of a real segmentation of the edema of a brain tumor. In 9, to reduce the search space when searching the nearest neighbor, a search sphere with radius r is found by moving from the query q toward the mean m and considering the first point crossed on the boundary
Fig. 2
Fig. 2
Testing the proposed tool against the ITK implementation using brain tumor segmentation. Comparison between the performance of the proposed evaluation tool and the ITK Library implementation in validating 240 brain tumor segmentations against the corresponding ground truth using the HD in (a) and the AVD in (b). The grid size (w i d t h×h e i g h t×d e p t h) is on the horizontal axis and the run time in seconds is on the vertical axis. The data points are sorted according to the total number of voxels, i.e. w h d
Fig. 3
Fig. 3
The correlation between the rankings produced by 16 different metrics. The pair-wise Pearson’s correlation coefficients between the rankings of 4833 medical volume segmentations produced by 16 metrics. The color intensity of each cell represents the strength of the correlation, where blue denotes direct correlation and red denotes inverse correlation
Fig. 4
Fig. 4
The effect of decreasing the true negatives (background) on the ranking. Each of the segmentations in A and B is compared with the same ground truth. All metrics assess that the segmentation in A is more similar to the ground truth than in B. In Á, the segmentation and ground truth are the same as in A, but after reducing the true negatives by selecting a smaller bounding cube. The metrics RI, GCE, and TNR change their rankings as a result of reducing the true negatives. Note that some of the metrics are similarities and others are distances
Fig. 5
Fig. 5
The effect of overlap on the correlation between rankings produced by different metrics. The positions and heights of the bars show how metrics correlate with DICE and how this correlation depends on the overlap between the compared segmentations. Four different overlap ranges are considered
Fig. 6
Fig. 6
Metrics that fail to discover boundary errors. In a, the star is compared with a circle and in b the same star is compared with another star of the same dimensions, rotated so that the resulting overlap errors (FP and FN) are equal in magnitude in both cases. All metrics that are based on FP and FN (overlap-based metrics) are not able to discover that the two shapes in (b) are more similar to each other than those in (a). On the contrary, all spatial distance based metrics discover the similarity and give (b) a higher score than (a). However, the metric most invariant to boundary error is the volumetric similarity, since it gives a perfect match in both cases
Fig. 7
Fig. 7
Boundary errors: rewarding/penalizing recall. Illustration in 2D of boundary errors that decrease/increase recall. The ground truth image GT is compared with the image A that is smaller than GT and with another image B that is larger than GT. Although the boundary error in both cases is equal (δ), the magnitude of the resulting false negative (FN) with A is smaller than the resulting false positive (FP) with B. This causes that metrics, considering the absolute magnitudes of FN and FP, penalize high racall
Fig. 8
Fig. 8
The effect of segment density. Two segmentations b and c are compared with the corresponding ground truth (a). b has a solid structure while c has a lower density due to large number of tiny holes uniformly distributed inside it. Although c has a a higher accuracy of the boundary than b, all metrics, excepts MHD and HD, give b a higher score than (c)

References

    1. Zou KH, Warfield SK, Baharatha A, Tempany C, Kaus MR, Haker SJ, et al. Statistical validation of image segmentation quality based on a spatial overlap index. Academic Radiology. 2004;11:178–89. doi: 10.1016/S1076-6332(03)00671-8. - DOI - PMC - PubMed
    1. Zou KH, Wells WM, Kikinis R, Warfield SK. Three validation metrics for automated probabilistic image segmentation of brain tumours. Stat Med. 2004;23:1259–82. doi: 10.1002/sim.1723. - DOI - PMC - PubMed
    1. Kennedy DN, Makris N, Verne SC, Worth AJ. Neuroanatomical segmentation in MRI: Technological objectives. IJPRAI. 1997;11(8):1161–87.
    1. Warfield SK, Westin CF, Guttmann CRG, Albert MS, Jolesz FA, Kikinis R. Fractional segmentation of white matter. In: Proceedings of Second International Conference on Medical Imaging Computing and Computer Assisted Interventions: 1999. p. 62–71. doi:10.1007/10704282_7. - DOI
    1. Shi R, Ngan KN, Li S. The objective evaluation of image object segmentation quality. ACIVS. 2013;8192:470–9. - PubMed

Publication types

MeSH terms