

T1 mapping and T2 mapping at 3T for quantifying the area-at-risk in reperfused STEMI patients
- PMID: 26264813
- PMCID: PMC4534126
- DOI: 10.1186/s12968-015-0173-6
T1 mapping and T2 mapping at 3T for quantifying the area-at-risk in reperfused STEMI patients
Abstract
Background: Whether T1-mapping cardiovascular magnetic resonance (CMR) can accurately quantify the area-at-risk (AAR) as delineated by T2 mapping and assess myocardial salvage at 3T in reperfused ST-segment elevation myocardial infarction (STEMI) patients is not known and was investigated in this study.
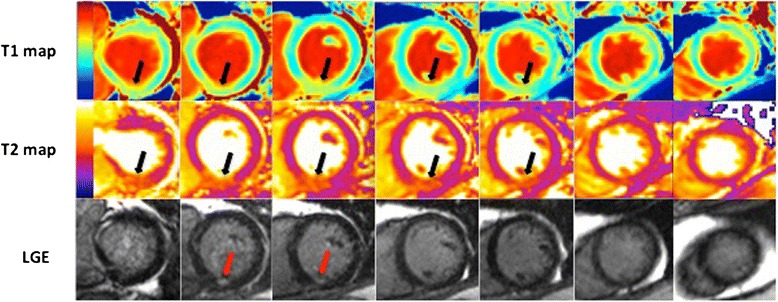
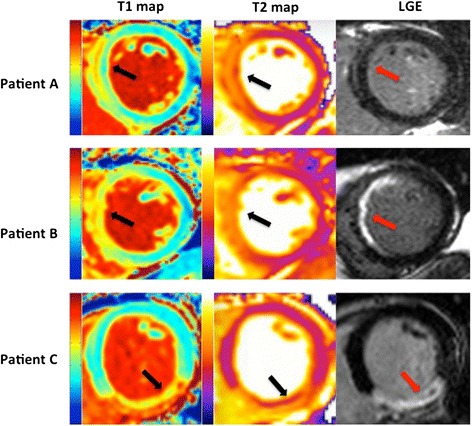
Methods: 18 STEMI patients underwent CMR at 3T (Siemens Bio-graph mMR) at a median of 5 (4-6) days post primary percutaneous coronary intervention using native T1 (MOLLI) and T2 mapping (WIP #699; Siemens Healthcare, UK). Matching short-axis T1 and T2 maps covering the entire left ventricle (LV) were assessed by two independent observers using manual, Otsu and 2 standard deviation thresholds. Inter- and intra-observer variability, correlation and agreement between the T1 and T2 mapping techniques on a per-slice and per patient basis were assessed.
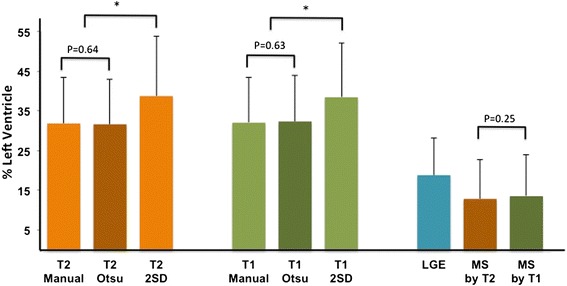
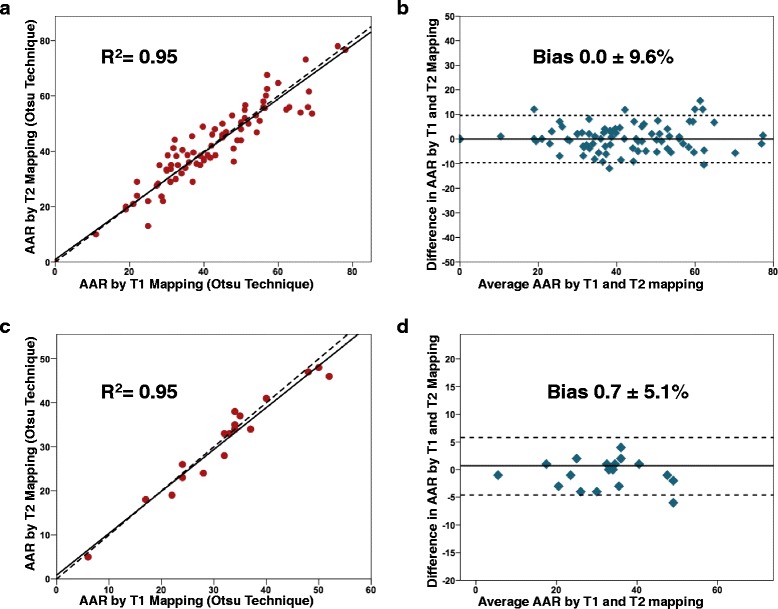
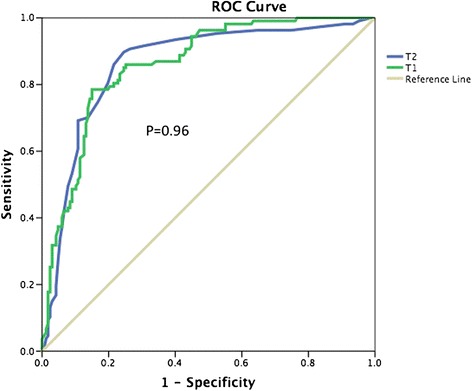
Results: A total of 125 matching T1 and T2 mapping short-axis slices were available for analysis from 18 patients. The acquisition times were identical for the T1 maps and T2 maps. 18 slices were excluded due to suboptimal image quality. Both mapping sequences were equally prone to susceptibility artifacts in the lateral wall and were equally likely to be affected by microvascular obstruction requiring manual correction. The Otsu thresholding technique performed best in terms of inter- and intra-observer variability for both T1 and T2 mapping CMR. The mean myocardial infarct size was 18.8 ± 9.4 % of the LV. There was no difference in either the mean AAR (32.3 ± 11.5 % of the LV versus 31.6 ± 11.2 % of the LV, P = 0.25) or myocardial salvage index (0.40 ± 0.26 versus 0.39 ± 0.27, P = 0.20) between the T1 and T2 mapping techniques. On a per-slice analysis, there was an excellent correlation between T1 mapping and T2 mapping in the quantification of the AAR with an R(2) of 0.95 (P < 0.001), with no bias (mean ± 2SD: bias 0.0 ± 9.6 %). On a per-patient analysis, the correlation and agreement remained excellent with no bias (R(2) 0.95, P < 0.0001, bias 0.7 ± 5.1 %).
Conclusions: T1 mapping CMR at 3T performed as well as T2 mapping in quantifying the AAR and assessing myocardial salvage in reperfused STEMI patients, thereby providing an alternative CMR measure of the the AAR.
Figures
References
-
- Spencer FA, Meyer TE, Gore JM, Goldberg RJ. Heterogeneity in the management and outcomes of patients with acute myocardial infarction complicated by heart failure: the National Registry of Myocardial Infarction. Circulation. 2002;105(22):2605–10. doi: 10.1161/01.CIR.0000017861.00991.2F. - DOI - PubMed
-
- Fokkema ML, James SK, Albertsson P, Akerblom A, Calais F, Eriksson P, et al. Population trends in percutaneous coronary intervention: 20-year results from the SCAAR (Swedish Coronary Angiography and Angioplasty Registry) J Am Coll Cardiol. 2013;61(12):1222–30. doi: 10.1016/j.jacc.2013.01.007. - DOI - PubMed
-
- Terkelsen CJ, Jensen LO, Tilsted HH, Trautner S, Johnsen SP, Vach W, et al. Health care system delay and heart failure in patients with ST-segment elevation myocardial infarction treated with primary percutaneous coronary intervention: follow-up of population-based medical registry data. Ann Intern Med. 2011;155(6):361–7. doi: 10.7326/0003-4819-155-6-201109200-00004. - DOI - PubMed
-
- Botker HE, Kaltoft AK, Pedersen SF, Kim WY. Measuring myocardial salvage. (1755–3245 (Electronic)). - PubMed
Publication types
MeSH terms
Grants and funding
LinkOut - more resources
Full Text Sources
Other Literature Sources
Medical
