Integrative genomics positions MKRN1 as a novel ribonucleoprotein within the embryonic stem cell gene regulatory network
- PMID: 26265008
- PMCID: PMC4670460
- DOI: 10.15252/embr.201540974
Integrative genomics positions MKRN1 as a novel ribonucleoprotein within the embryonic stem cell gene regulatory network
Abstract
In embryonic stem cells (ESCs), gene regulatory networks (GRNs) coordinate gene expression to maintain ESC identity; however, the complete repertoire of factors regulating the ESC state is not fully understood. Our previous temporal microarray analysis of ESC commitment identified the E3 ubiquitin ligase protein Makorin-1 (MKRN1) as a potential novel component of the ESC GRN. Here, using multilayered systems-level analyses, we compiled a MKRN1-centered interactome in undifferentiated ESCs at the proteomic and ribonomic level. Proteomic analyses in undifferentiated ESCs revealed that MKRN1 associates with RNA-binding proteins, and ensuing RIP-chip analysis determined that MKRN1 associates with mRNAs encoding functionally related proteins including proteins that function during cellular stress. Subsequent biological validation identified MKRN1 as a novel stress granule-resident protein, although MKRN1 is not required for stress granule formation, or survival of unstressed ESCs. Thus, our unbiased systems-level analyses support a role for the E3 ligase MKRN1 as a ribonucleoprotein within the ESC GRN.
Keywords: RNA metabolism; embryonic stem cells; makorin‐1; stress granules.
© 2015 The Authors. Published under the terms of the CC BY NC ND 4.0 license.
Figures
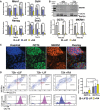
qPCR analysis of fold change in Mkrn1, Oct4, Nanog, and Sox2 mRNA expression in R1 ESCs upon differentiation induced by LIF withdrawal (−LIF) or RA treatment (+RA) relative to undifferentiated R1 ESCs collected at 0 h. Data are means ± standard error of the mean (SEM) from three biological replicate experiments (*P < 0.05, **P < 0.01, ***P < 0.0001 vs. +LIF; two‐way ANOVA).
Quantitative immunoblot analysis of MKRN1 and OCT4 expression in R1 ESCs cultured for 48 or 72 h in self‐renewal (+LIF) or differentiation conditions (+RA). The OCT4 immunoblot was first probed with anti‐OCT4 antibodies and subsequently probed with anti‐GAPDH antibodies. MKRN1 and OCT4 protein abundance was normalized to GAPDH and reported relative to undifferentiated R1 ESCs collected at 0 h. MKRN1 = ˜53‐kDa and ˜42‐kDa bands, OCT4 = ˜45‐kDa band, and GAPDH = ˜37‐kDa band. Data are means ± SEM of two biological replicate experiments (*P < 0.05 vs. +LIF; two‐way ANOVA).
Co‐immunofluorescent staining of endogenous MKRN1 and OCT4 in R1 ESCs cultured in LIF + serum. MKRN1 is predominantly localized to the cytoplasm. Scale bars: 10 μm.
Intracellular flow cytometry analysis for MKRN1 and OCT4 expression from single R1 ESCs cultured in +LIF, −LIF, or +RA for 72 h. Quantile contour plots of OCT4‐ and MKRN1‐positive/negative cells in each culture condition. Mean fluorescent intensity of MKRN1 was quantified from the OCT4+ and OCT4− subpopulations in each culture condition. MKRN1 is significantly more abundant in the OCT4+ subpopulation than in the OCT4− subpopulation irrespective of culture conditions. Data are means ± SEM from three biological replicates (P = 0.0083, two‐way ANOVA).

- A, B
Twenty micrograms of total protein from whole‐cell lysates derived from undifferentiated
MKRN 1 overexpression (FLAG :MKRN 1) (A) andMKRN 1 knockdown (shMKRN 1) clones (B) and their respective controls (including R1 parentalESC s) was resolved withSDS –PAGE . Blots were probed with commercial antibodies directed againstMKRN 1 (top) to test the specificity of the antibody, andOCT 4 (bottom) to verify that lysates were obtained from undifferentiatedESC populations. TheMKRN 1 antibody (ab72054) detects twoMKRN 1‐specific bands at ˜53 and ˜42kD a, and two non‐specific bands of size 80 and 25kD a. Both the 53‐kD a and 42‐kD a bands were depleted in stableMKRN 1 knockdownESC lysates, but not the non‐specific 80‐kD a and 25‐kD a bands (B). The 53‐kD a band corresponds to the full‐length endogenousMKRN 1 protein and the second ˜42‐kD a band may represent a degraded by‐product of the full‐length 53‐kD aMKRN 1, or potentially the putativeMKRN 1 splice variant, Mkrn1‐004, which encodes a putative protein of 47.3kD a. TheMKRN 1 antibody also detects an additional ˜63‐kD a band exclusively inFLAG :MKRN 1ESC s that corresponds to recombinantFLAG :MKRN 1 (A). TotalMKRN 1 andOCT 4 protein expression was quantified and reported relative toGAPDH .OCT 4 protein abundance was comparable betweenMKRN 1 transgenic and control clones (A, B). TotalMKRN 1 expression was highest inFLAG :MKRN 1 clones B7 and C7 (***P < 0.001), followed by C4 (**P < 0.01) and C2 (*P < 0.05), whereasMKRN 1 was depleted to the greatest extent in shMKRN 1 clones C4 (**P < 0.01) followed by C12, F5, and C9 (*P < 0.01). Data are means ±SEM from three biological replicate experiments (one‐wayANOVA ). - C
Alkaline phosphatase‐positive
ESC colonies formed from stable shGFP control and stableMKRN 1 knockdownESC clones cultured inLIF + serum in feeder‐free conditions. Scale bars: 60 μm. - D
R1
ESC s cultured inLIF + serum immunostained with anti‐MKRN 1 antibodies and counterstained with Hoechst. Scale bars: 10 μm. - E
FLAG :MKRN 1ESC s cultured for 72 h in self‐renewal (top) orRA ‐induced differentiation conditions (bottom) were immunostained with anti‐FLAG antibodies and counterstained with Hoechst. Scale bars: 10 μm. - F
Distribution of
MKRN 1+ andMKRN 1− cells in theOCT 4+ andOCT 4− fraction ofESC cultures as determined by high‐content imaging analysis. Association betweenOCT 4 andMKRN 1 expression in individual cells was significant in both self‐renewal (72 h +LIF ) and differentiation (72 h −LIF ) conditions (P < 0.001; chi‐square test).
- A
Anti‐
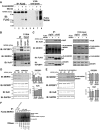
FLAG immunoblot of representative anti‐FLAG IP immunoprecipitates (lanes 1–4) and total protein lysates (lanes 5–8) derived fromMG 132‐treated or untreatedESC s expressing recombinantFLAG :MKRN 1 protein or an emptyFLAG vector. Anti‐FLAG immunoprecipitates purified in this experiment were subjected toLC ‐MS /MS analysis. - B, C
Reciprocal anti‐
IGF 2BP 1 (B) and anti‐HuR (C)IP s from undifferentiatedESC lysates verify the presence ofMKRN 1 in the respectivemRNP complexes. - D, E
Steady‐state abundance of
MKRN 1‐associated proteins,IGF 2BP 1 and HuR, inMKRN 1 knockdown (D) andMKRN 1 overexpression (E)ESC populations. Quantified protein abundance is reported relative toGAPDH . NeitherIGF 2BP 1 nor HuR protein abundance was affected by the manipulation ofMKRN 1 expression. Data are means ±SEM from two biological replicate experiments. - F
Autoradiogram of 32P‐labeled
RNA obtained byCLIP with either anti‐FLAG antibodies or IgG isotype control antibodies fromFLAG :MKRN 1 orFLAG :CtrlESC lysates, as indicated. Prior to lysis,ESC s were eitherUV cross‐linked, or left uncross‐linked (no X‐link). Data represent findings from two biological replicate experiments.
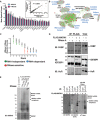
List of the top 20 enriched proteins co‐purified with FLAG:MKRN1 from MG132‐treated and untreated ESC lysates ranked according to mean spectral count values. Data are means ± SEM of three biological replicate experiments. The XY scatter plot (top right insert) indicates a strong positive correlation (r 2 = 0.9905) in mean spectral count values for all 48 FLAG:MKRN1‐associated proteins purified from MG132‐treated and untreated lysates.
Enrichment map representation of enriched cellular processes within the FLAG:MKRN1 AP‐MS data set (P < 0.001; FDR < 0.1). Nodes and edges are represented as described in Materials and Methods. Proteins within labeled gene sets are listed in Table EV2.
Proteins identified with enriched total spectral counts by LC‐MS/MS from RNase A‐treated and untreated FLAG:MKRN1 IPs from two biological replicate experiments. Proteins are ranked along the x‐axis according to whether they are predicted to interact with MKRN1 in a RNA‐independent or RNA‐dependent manner.
Predicted RNA‐independent (PABP), RNA‐dependent (HuR), and RNase‐sensitive (IGF2BP1) associations tested by FLAG:MKRN1 co‐IP Western blots. Data are representative of two independent experiments. Note that due to limited amount of IP material, the IGF2BP1 immunoblot was re‐probed with anti‐HuR without stripping the blot. The ˜37‐kDa band corresponding to HuR was visible in FLAG:MKRN1 IPs but not control IPs.
Protein–RNA complexes are observed from FLAG:MKRN1 IPs, but not control IPs. Note the radioactive smear from FLAG:MKRN1 IPs treated with a low concentration of RNase (1:100,000) that is resolved to a focused band at the expected size of MKRN1–RNA complexes with moderate RNase A treatment (1:25,000) and strongly reduced with a high dose (1:1,000) of RNase A (n = 2). CLIP data from additional RNase dilutions are provided in Fig EV2F.
Anti‐MKRN1 immunoblot (left and center) and corresponding RNA autoradiogram (right) identify MKRN1–RNA complexes uniquely purified from FLAG:MKRN1 IPs. At the optimized RNase concentration of 1:25,000, 32P‐labeled RNA–protein complexes purified from FLAG:MKRN1 ESC lysates resolved to a mass that corresponded to supershifted MKRN1 proteins that may reflect the RNA‐bound fraction of MKRN1. Data are from CLIP samples obtained from the same experiment and are representative of two biological replicate experiments.
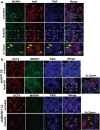
Recruitment of endogenous MKRN1 in SGs in R1 ESCs stressed for 1 h with 1 mM (+NaAsO2). SG formation was monitored with HuR and TIAR immunostaining. Yellow arrows indicate MKRN1/HuR/TIAR‐positive SGs; white arrows indicate SGs devoid of MKRN1. Enlargements of boxed regions are indicated as 5× zoom.
MKRN1 is not absolutely required for SG assembly in undifferentiated ESCs. MKRN1 knockdown and shGFP control ESC clones were stressed as in (A). Yellow arrows indicate TIAR‐positive SGs in OCT4+ ESCs; white arrows indicate TIAR‐positive SGs in OCT4− ESCs. Scale bars: 10 μm. Enlargements of boxed regions are indicated as 5× zoom.
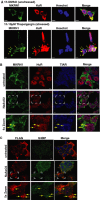
Endogenous
MKRN 1 is targeted toSG s inESC s following 1‐h treatment with 10 μM thapsigargin. Yellow arrows indicateMKRN 1/HuR‐positiveSG s. Scale bars: 10 μm.Overexpression of
MKRN 1 does not spontaneously induceSG assembly in unstressedESC s and does not impairSG formation in NaAsO2‐stressedESC s. Yellow arrows indicateMKRN 1/HuR/TIAR ‐positiveSG s. Scale bars: 10 μm. Enlargements of boxed regions are indicated as 5× zoom.Ectopic
FLAG :MKRN 1 is localized toSG s upon NaAsO2‐induced environmental stress. Yellow arrows indicate G3BP ‐positiveSG s in NaAsO2‐treatedFLAG :MKRN 1ESC populations. Scale bars: 10 μm. Enlargements of boxed regions are indicated as 5× zoom.

Histograms comparing the distribution of mRNA abundance for transcripts in the MKRN1–mRNA network with > 20,000 transcripts representing the ESC transcriptome. Further details are provided in Materials and Methods.
Venn diagram shows the overlap of transcripts in the MKRN1–mRNA network with the 411 differentially expressed transcripts identified from the transient MKRN1 knockdown microarray data set.
Network diagram of the 45 transcripts identified in (B). Node color corresponds to the extent each transcript was differentially expressed in the transient MKRN1 knockdown microarray data set.
qPCR data from stable MKRN1 knockdown ESCs validate the microarray data set. Colored bars represent the fold change in abundance of eight FLAG:MKRN1‐associated mRNAs from (C) in the stable shMKRN1 ESC clone C4 relative to a stable shGFP control clone (gray bars). Bar color scheme is the same as (C) and corresponds to the extent the mRNA was differentially expressed in the transient MKRN1 knockdown microarray data set. Data are means ± SEM from three biological replicate experiments (P‐values are indicated, two‐tailed t‐test).
RIP‐qPCR experiments were performed in triplicate to corroborate the findings from the RIP‐chip analysis. RIP‐qPCR experiments confirmed that the predicted FLAG:MKRN1 RIP targets (blue bars) were enriched in FLAG:MKRN1 RIPs versus a subset of transcripts not detected as enriched from the RIP‐chip analysis (gray bars) (P < 0.001; Mann Whitney U‐test). Asterisks denote the four of the five predicted FLAG:MKRN1 RIP targets with mean fold enrichment values above the specified threshold (red line) calculated as two standard deviations (SD) from the mean fold enrichment of the negative control group (gray bars). Data are means ± SD from three biological replicate experiments.

qPCR analysis verifies that Mkrn1 expression was repressed in shMKRN 1‐transfectedESC populations relative to shGFP ‐transfectedESC populations prior to performing microarray analysis. Data are means ±SEM from four biological replicate experiments (*P < 0.0001, two‐tailed t‐test).Alkaline phosphatase‐stained, sh
RNA ‐transfectedESC populations following four days of puromycin selection. Only positively transfected cells remained following puromycin selection as indicated by the absence of cells in the mock‐transfected population. Transient knockdown of Mkrn1 did not induce spontaneous differentiation ofESC s cultured inLIF + serum. Scale bars: 100 μm.Immunoblot analysis of the
ER ‐enriched and the soluble (cytoplasmic) fractions derived from stableMKRN 1 knockdown and shGFP controlESC populations. Calnexin, anER luminal protein marker, was identified exclusively in theER ‐enriched fraction of both shGFP andMKRN 1 knockdown lysates irrespective ofEDTA treatment, whereas trimethylated H3K27 (a nuclear marker) was not detected inER ‐enriched or soluble fractions.EDTA treatment evoked a marked release ofmRNP s from membrane‐bound ribosomes as evident by the decrease ofPABP and theRNA helicase,MOV 10, in theER ‐enriched fraction.MKRN 1 is present inER ‐enriched fractions, yet comparatively it is more abundant in the cytosolic fraction of undifferentiatedESC lysates. Similar toPABP andMOV 10,MKRN 1 is sensitive toEDTA treatment, suggesting thatMKRN 1 localization toER membranes is dependent on its association withmSMERP s. These data confirm that our subcellular fractionation technique accurately partitioned each subcellular compartment and, furthermore, could distinguish between ribosome‐dependent and ribosome‐independentmRNP translocation events.Subcellular
ER ‐to‐cytosol distribution of seven representativeMKRN 1 targetmSMERP s in shMKRN 1 and shGFP ESC lysates.mRNA from theER ‐enriched and soluble fraction was quantified withqPCR . The seven representativeMKRN 1 targetmSMERP s are labeled in black. E‐cadherin, Epcam, and Lamp1 are non‐MKRN 1 targetmRNA s encoding signal‐peptide‐containing proteins (positive controls; blue labels). Oct4mRNA is a non‐MKRN 1 targetmRNA encoding a soluble nuclear protein (negative control; red label). Data are means ±SEM from three biological replicate experiments. Asterisks indicate the transcripts whose association in theER ‐enriched fraction was sensitive toEDTA treatment (two‐wayANOVA ).qPCR data comparing the relative distribution of the indicatedmRNA s (labels are consistent with D) inMKRN 1 knockdown and shGFP controlESC lysates. Data are means of twoMKRN 1 knockdown clones (C4 and F5) and two shGFP control clones (D5 and D8) in each group ±SEM from three biological replicate experiments. Differences in relative distributions betweenMKRN 1 knockdown and shGFP control clones are not significant.


- A, B
Control and MKRN1 overexpression (A) or knockdown (B) ESC clones were either untreated (−NaAsO2) or stressed for 30 min with 1 mM and allowed to recover for 4 h (+NaAsO2) prior to lysis. Total p53 served as an indicator of genotoxic stress. MKRN1, OCT4, cleaved caspase‐3, and cleaved PARP are quantified relative to GAPDH and are presented to the right of the respective immunoblots. Data are means of four independent clones in each group from two biological replicate experiments ± SEM. Statistically significant differences in mean protein abundance between populations are indicated by *P < 0.05, **P < 0.01, or ***P < 0.001 (two‐way ANOVA).

- A, B
Wild‐type R1
ESC s treated for 4 h with 0.5 μMADR (+ADR ) or left untreated (−ADR ). Cells were immunostained with either anti‐MKRN 1 (A) or anti‐HuR (B) antibodies and counterstained with Hoechst.MKRN 1 does not mobilize to stress granules uponADR ‐induced genotoxic stress inESC s (A), nor does the knownSG ‐resident protein, HuR (B). Scale bars: 10 μm. Enlargements of boxed regions are indicated as zoom.

- A, B
Control and MKRN1 knockdown (A) or overexpression (B) ESC clones were either untreated (−ADR) or stressed with 0.5 μM ADR for 6 h (+ADR) prior to lysis. MKRN1, p53, cleaved caspase‐3, and cleaved PARP are quantified relative to GAPDH and are presented to the right of the respective immunoblots. Data are means of four independent clones in each group from two biological replicate experiments ±
SEM . Statistically significant differences in mean protein abundance between populations are indicated by *P < 0.05, **P < 0.01, or ***P < 0.001 (two‐way ANOVA).

References
-
- Schwartz SD, Hubschman JP, Heilwell G, Franco‐Cardenas V, Pan CK, Ostrick RM, Mickunas E, Gay R, Klimanskaya I, Lanza R et al (2012) Embryonic stem cell trials for macular degeneration: a preliminary report. Lancet 379: 713–720 - PubMed
-
- Evans MJ, Kaufman MH (1981) Establishment in culture of pluripotential cells from mouse embryos. Nature 292: 154–156 - PubMed
-
- Thomson JA, Itskovitz‐Eldor J, Shapiro SS, Waknitz MA, Swiergiel JJ, Marshall VS, Jones JM (1998) Embryonic stem cell lines derived from human blastocysts. Science 282: 1145–1147 - PubMed
Publication types
MeSH terms
Substances
Associated data
- Actions
Grants and funding
LinkOut - more resources
Full Text Sources
Other Literature Sources
Molecular Biology Databases
Miscellaneous

