

Identification and functional analysis of olfactory receptor family reveal unusual characteristics of the olfactory system in the migratory locust
- PMID: 26265180
- PMCID: PMC4611004
- DOI: 10.1007/s00018-015-2009-9
Identification and functional analysis of olfactory receptor family reveal unusual characteristics of the olfactory system in the migratory locust
Abstract
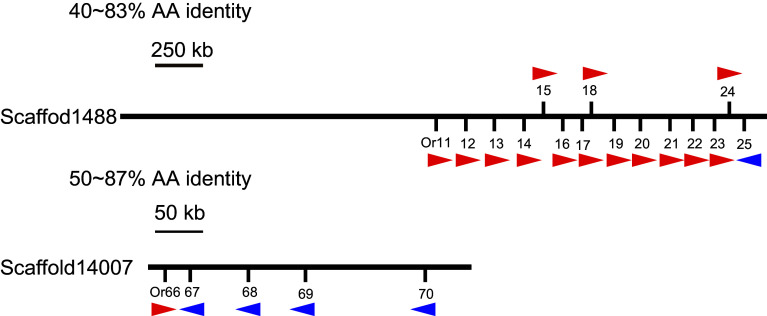
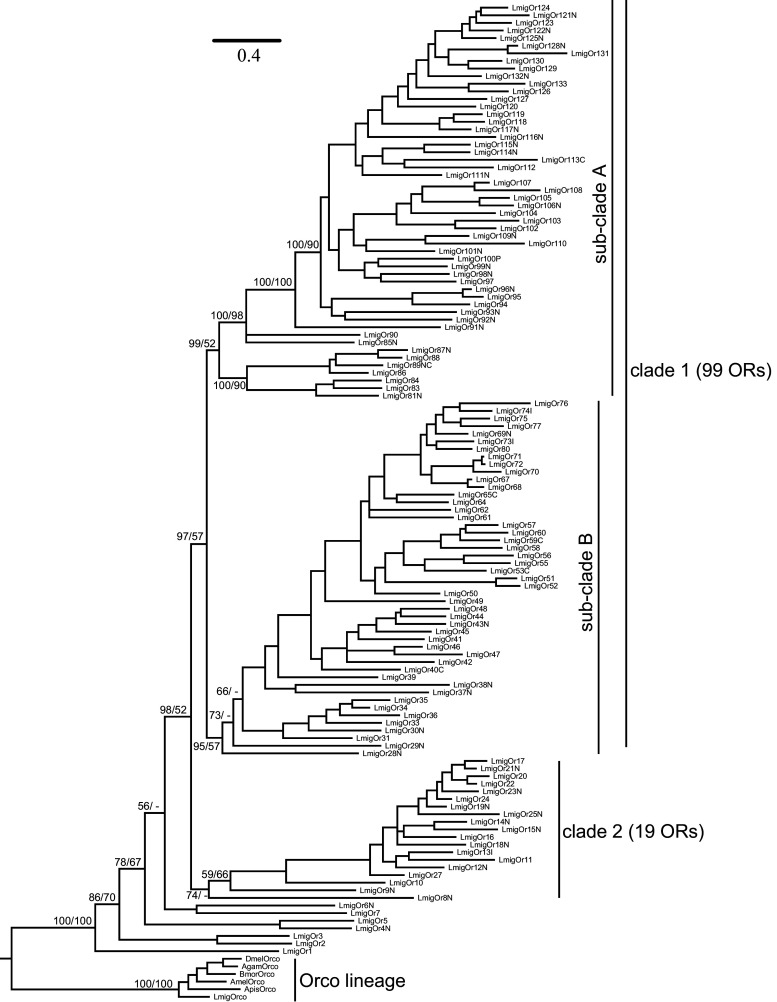
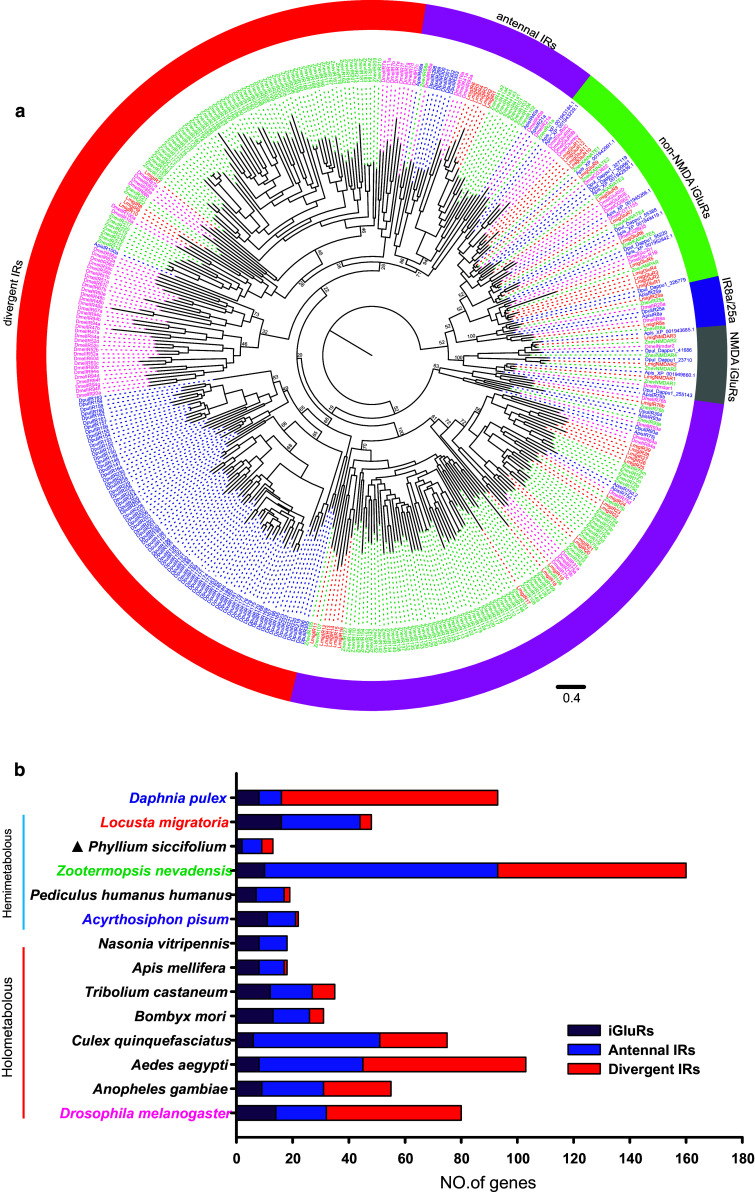
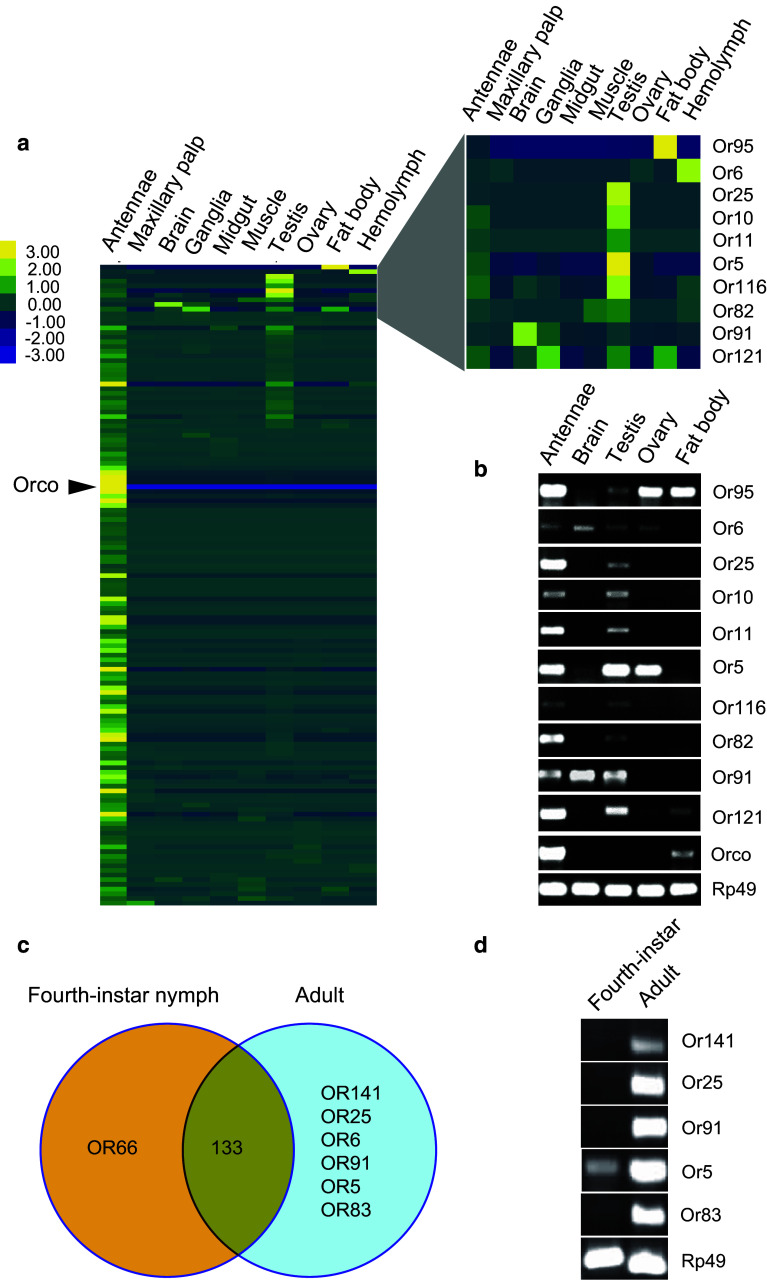
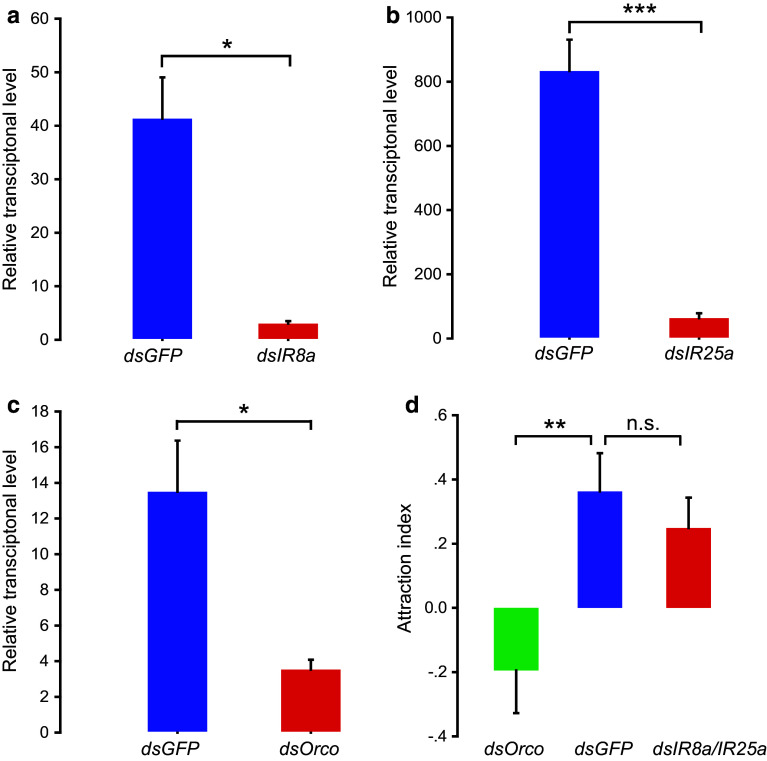
Locusts represent the excellent model of insect olfaction because the animals are equipped with an unusual olfactory system and display remarkable density-dependent olfactory plasticity. However, information regarding receptor molecules involved in the olfactory perception of locusts is very limited. On the basis of genome sequence and antennal transcriptome of the migratory locust, we conduct the identification and functional analysis of two olfactory receptor families: odorant receptors (ORs) and ionotropic receptors (IRs). In the migratory locust, there is an expansion of OR family (142 ORs) while distinctly lower number of IR genes (32 IRs) compared to the repertoires of other insects. The number of the locust OR genes is much less than that of glomeruli in antennal lobe, challenging the general principle of the "one glomerulus-one receptor" observed in other insects. Most OR genes are found in tandem arrays, forming two large lineage-specific subfamilies in the phylogenetic tree. The "divergent IR" subfamily displays a significant contraction, and most of the IRs belong to the "antennal IR" subfamily in the locust. Most ORs/IRs have olfactory-specific expression while some broadly- or internal-expressed members are also found. Differing from holometabolous insects, the migratory locust contains very similar expression profiles of ORs/IRs between nymph and adult stages. RNA interference and behavioral assays indicate that an OR-based signaling pathway, not IR-based, mediates the attraction of locusts to aggregation pheromones. These discoveries provide insights into the unusual olfactory system of locusts and enhance our understanding of the evolution of insect olfaction.
Keywords: Aggregative behavior; Chemoreceptor; Hemimetabolous; Orthoptera; Peripheral olfactory system; Phase polyphenism.
Figures
References
Publication types
MeSH terms
Substances
Associated data
- Actions
- Actions
- Actions
- Actions
- Actions
- Actions
- Actions
- Actions
- Actions
- Actions
- Actions
- Actions
- Actions
- Actions
- Actions
- Actions
- Actions
- Actions
- Actions
- Actions
- Actions
- Actions
- Actions
- Actions
- Actions
- Actions
- Actions
- Actions
- Actions
- Actions
- Actions
- Actions
- Actions
- Actions
- Actions
- Actions
- Actions
- Actions
- Actions
- Actions
- Actions
- Actions
- Actions
- Actions
- Actions
- Actions
- Actions
- Actions
- Actions
- Actions
- Actions
- Actions
- Actions
- Actions
- Actions
- Actions
- Actions
- Actions
- Actions
- Actions
- Actions
- Actions
- Actions
- Actions
- Actions
- Actions
- Actions
- Actions
- Actions
- Actions
- Actions
- Actions
- Actions
- Actions
- Actions
- Actions
- Actions
- Actions
- Actions
- Actions
- Actions
- Actions
- Actions
- Actions
- Actions
- Actions
- Actions
- Actions
- Actions
- Actions
- Actions
- Actions
- Actions
- Actions
- Actions
- Actions
- Actions
- Actions
- Actions
- Actions
- Actions
- Actions
- Actions
- Actions
- Actions
- Actions
- Actions
- Actions
- Actions
- Actions
- Actions
- Actions
- Actions
- Actions
- Actions
- Actions
- Actions
- Actions
- Actions
- Actions
- Actions
- Actions
- Actions
- Actions
- Actions
- Actions
- Actions
- Actions
- Actions
- Actions
- Actions
- Actions
- Actions
- Actions
- Actions
- Actions
- Actions
- Actions
- Actions
- Actions
- Actions
- Actions
- Actions
- Actions
- Actions
- Actions
- Actions
- Actions
- Actions
- Actions
- Actions
- Actions
- Actions
- Actions
- Actions
- Actions
- Actions
- Actions
- Actions
- Actions
- Actions
- Actions
- Actions
- Actions
- Actions
- Actions
- Actions
- Actions
- Actions
- Actions
- Actions
- Actions
- Actions
- Actions
- Actions
- Actions
- Actions
- Actions
- Actions
- Actions
- Actions
- Actions
- Actions
- Actions
- Actions
- Actions
- Actions
- Actions
- Actions
LinkOut - more resources
Full Text Sources
Other Literature Sources
