

Hospital Blood Transfusion Patterns During Major Noncardiac Surgery and Surgical Mortality
- PMID: 26266384
- PMCID: PMC4616699
- DOI: 10.1097/MD.0000000000001342
Hospital Blood Transfusion Patterns During Major Noncardiac Surgery and Surgical Mortality
Abstract
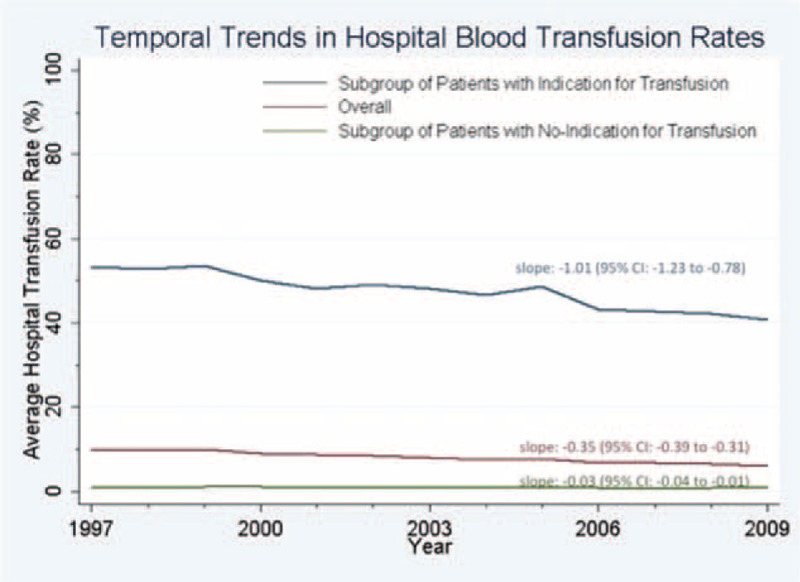
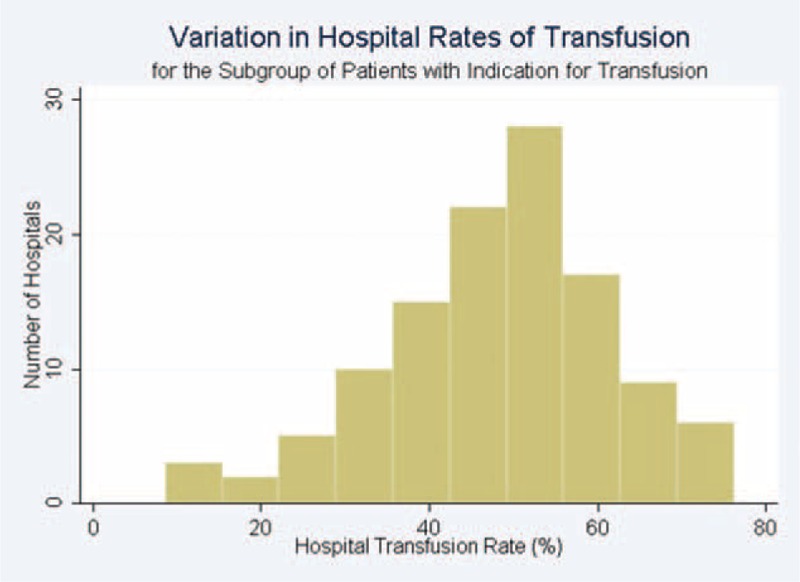
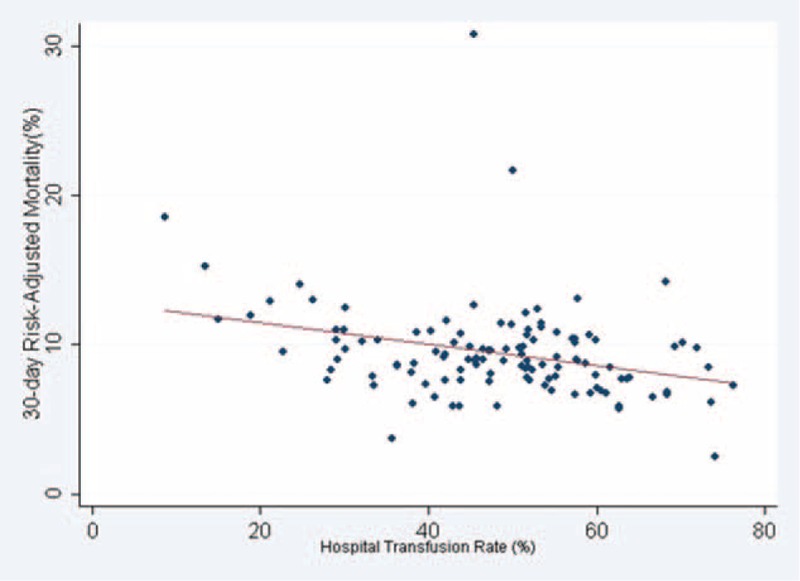
We retrospectively examined intraoperative blood transfusion patterns at US veteran's hospitals through description of national patterns of intraoperative blood transfusion by indication for transfusion in the elderly; assessment of temporal trends in the use of intraoperative blood transfusion; and relationship of institutional use of intraoperative blood transfusion to hospital 30-day risk-adjusted postoperative mortality rates.Limited data exist on the pattern of intraoperative blood transfusion by indication for transfusion at the hospital level, and the relationship between intraoperative transfusion rates and institutional surgical outcomes.Using the Department of Veterans Affairs Surgical Quality Improvement Program database, we assigned 424,015 major noncardiac operations among elderly patients (≥65 years) in 117 veteran's hospitals, from 1997 to 2009, into groups based on indication for intraoperative blood transfusion according to literature and clinical guidelines. We then examined institutional variations and temporal trends in surgical blood use based on these indications, and the relationship between these institutional patterns of transfusion and 30-day postoperative mortality.Intraoperative transfusion occurred in 38,056/424,015 operations (9.0%). Among the 64,390 operations with an indication for transfusion, there was wide variation (median: 49.9%, range: 8.7%-76.2%) in hospital transfusion rates, a yearly decline in transfusion rates (average 1.0%/y), and an inverse relationship between hospital intraoperative transfusion rates and hospital 30-day risk-adjusted mortality (adjusted mortality of 9.8 ± 2.8% vs 8.3 ± 2.1% for lowest and highest tertiles of hospital transfusion rates, respectively, P = 0.02). In contrast, for the 225,782 operations with no indication for transfusion, there was little variation in hospital transfusion rates (median 0.7%, range: 0%-3.4%), no meaningful temporal change in transfusion (average 0.0%/y), and similar risk-adjusted 30-day mortality across all tertiles of hospital transfusion rates.Among patients ≥65 years with an indication for intraoperative transfusion, intraoperative transfusion patterns varied widely across hospitals and declined through the 1997 to 2009 study period. Hospitals with higher transfusion rates in these patients have lower risk-adjusted 30-day postoperative mortality rates.
Conflict of interest statement
The authors have no conflicts of interest to disclose.
Figures
References
-
- Cook SS, Epps J. Transfusion practice in central Virginia. Transfusion 1991; 31:355–360. - PubMed
-
- Mathoulin-Pelissier S, Salmi LR, Verret C, et al. Blood transfusion in a random sample of hospitals in France. Transfusion 2000; 40:1140–1146. - PubMed
-
- Hannon T. Spiess BD, Spence RK, Shander A. The contemporary economics of transfusions. Chapter 2Perioperative Transfusion Medicine Lippincott Williams & Wilkins, 2nd edPhiladelphia, PA:2005.
-
- Sullivan MT, Wallace EL. Blood collection and transfusion in the United States in 1999. Transfusion 2005; 45:141–148. - PubMed
Publication types
MeSH terms
Grants and funding
LinkOut - more resources
Full Text Sources
Medical
