. 2015 Aug 12;13(8):e1002222.
doi: 10.1371/journal.pbio.1002222. eCollection 2015 Aug.

Spatiotemporal Spike Coding of Behavioral Adaptation in the Dorsal Anterior Cingulate Cortex

Affiliations

Spatiotemporal Spike Coding of Behavioral Adaptation in the Dorsal Anterior Cingulate Cortex

Laureline Logiaco et al. PLoS Biol. .

Abstract

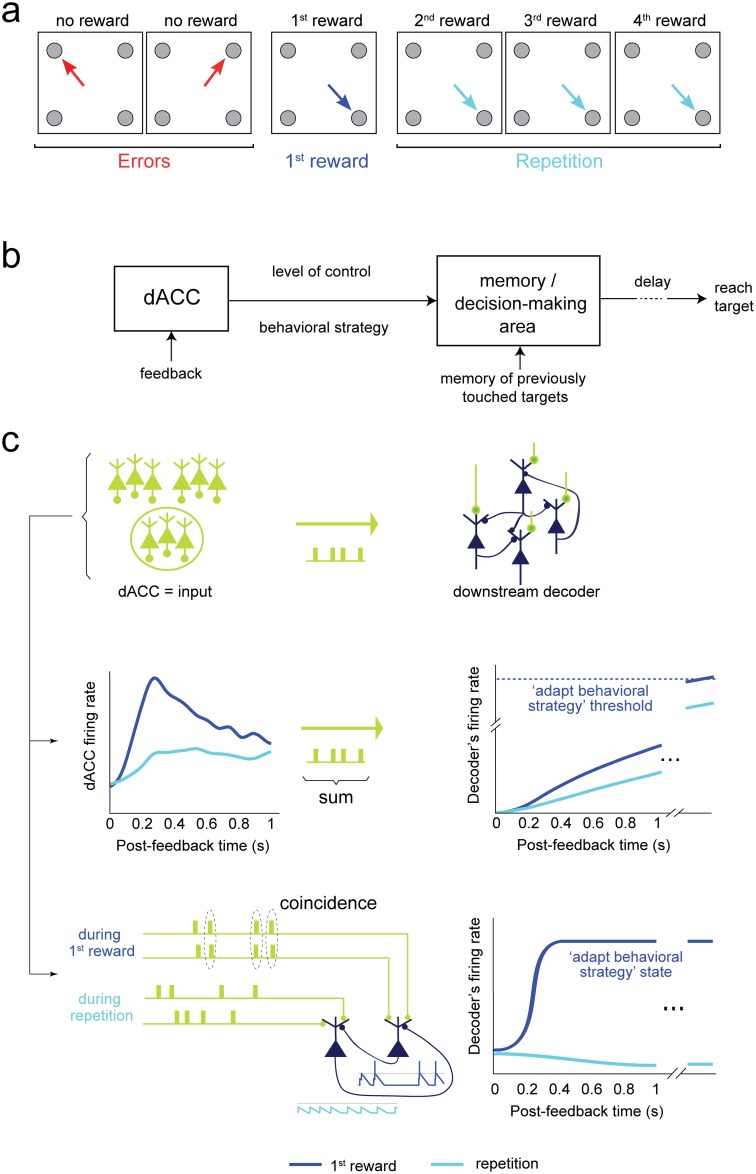
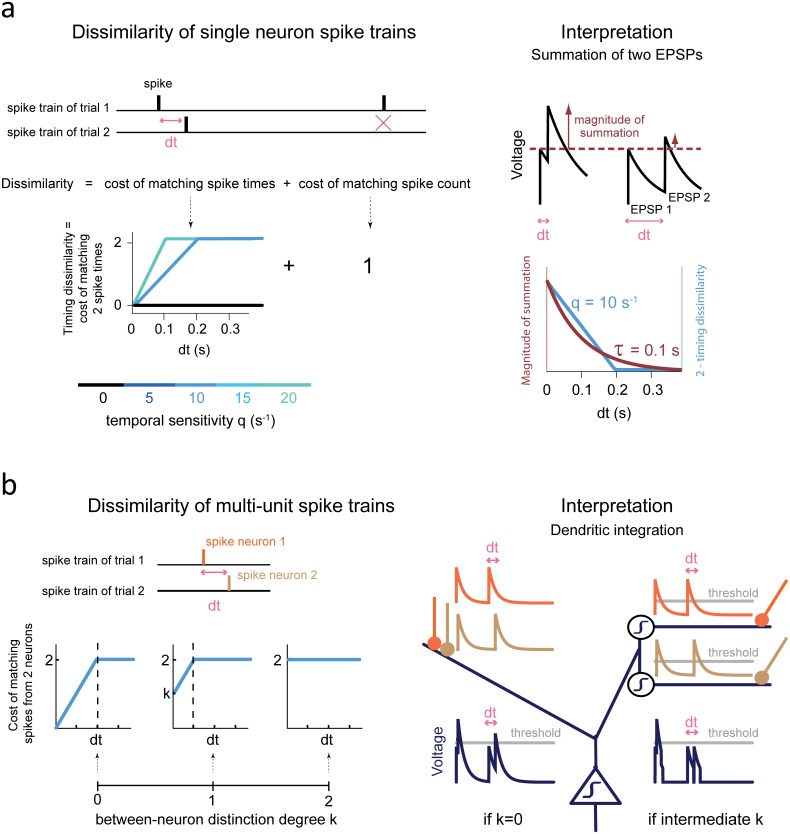
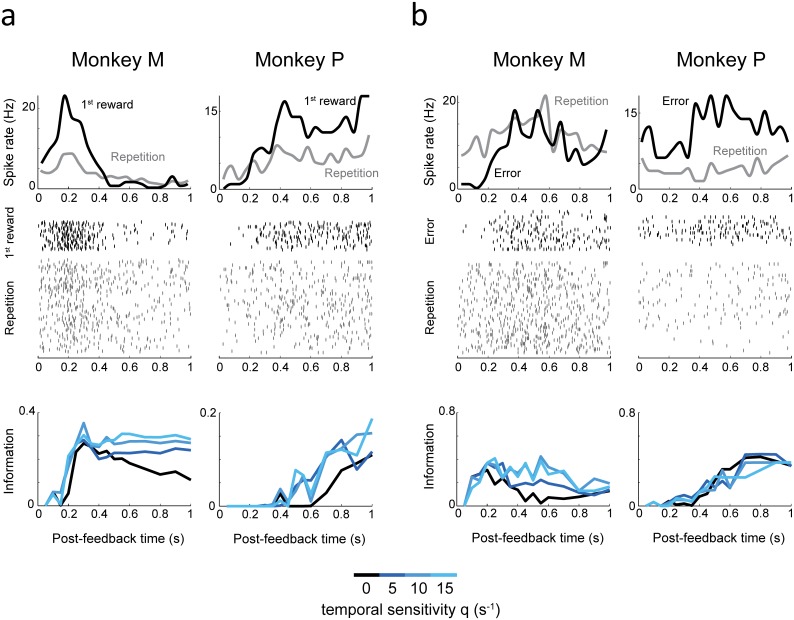
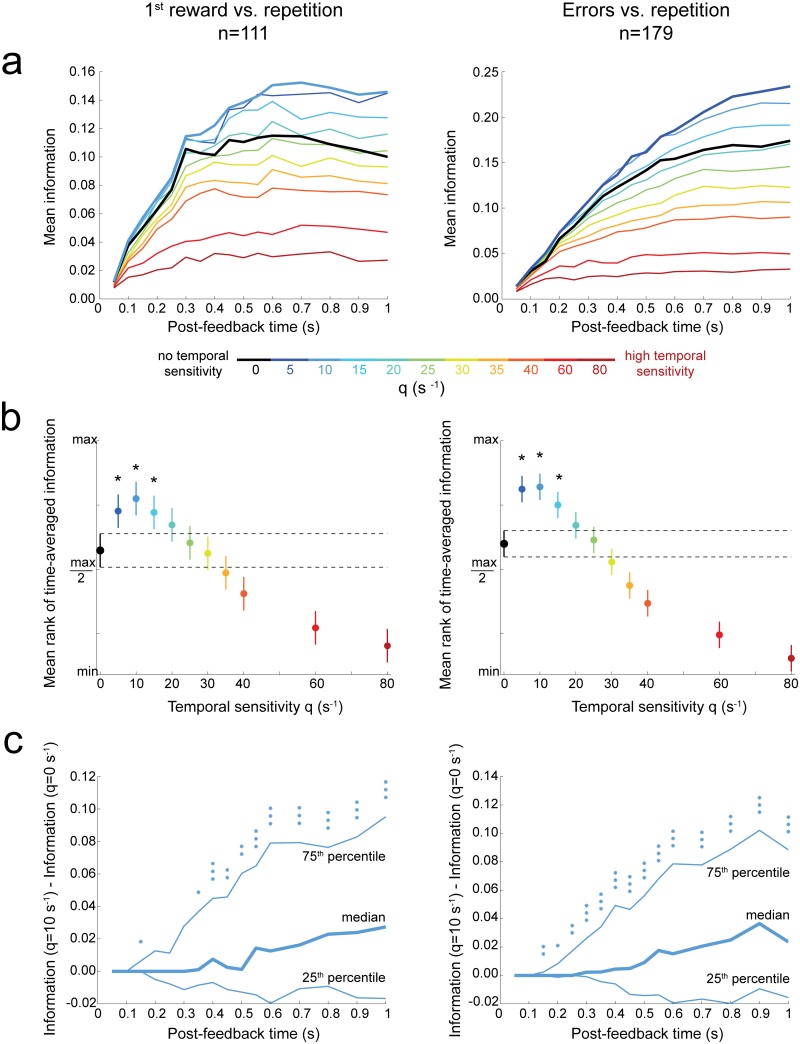
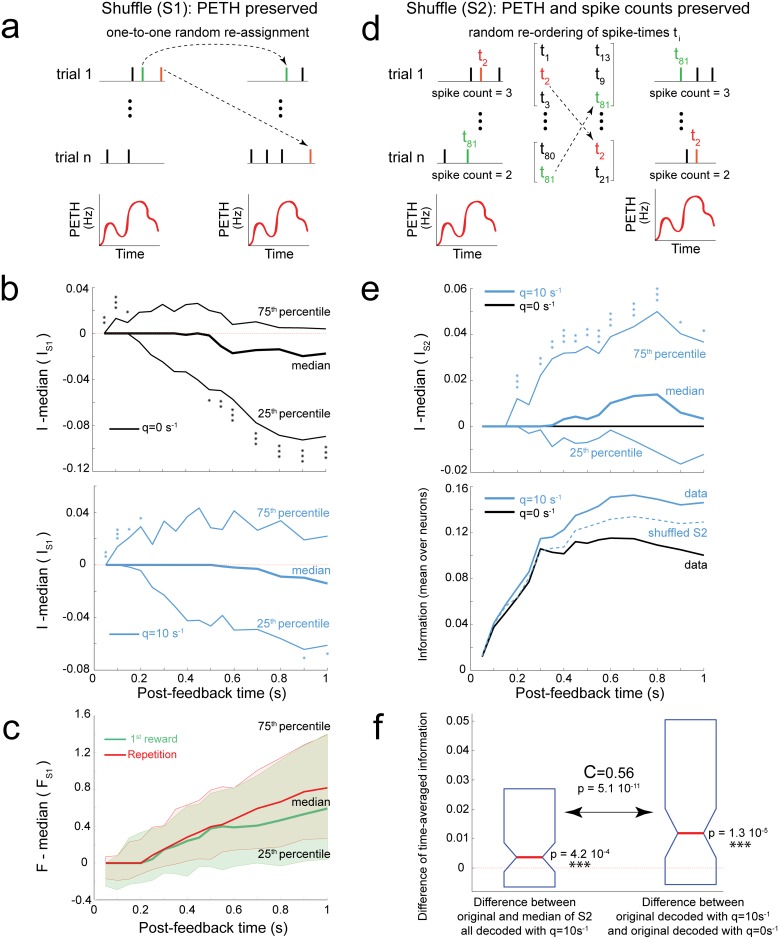
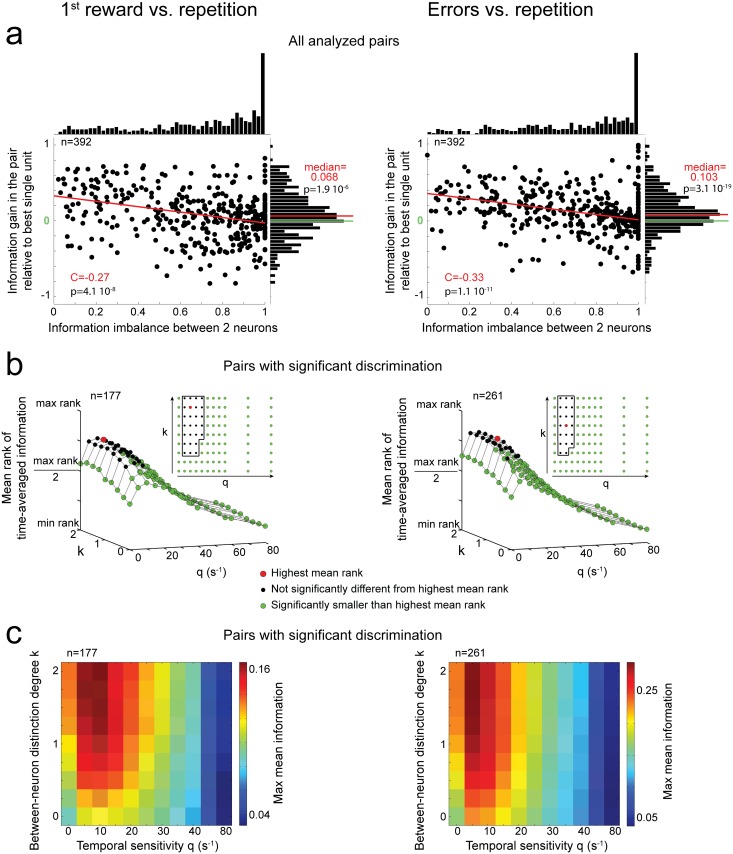
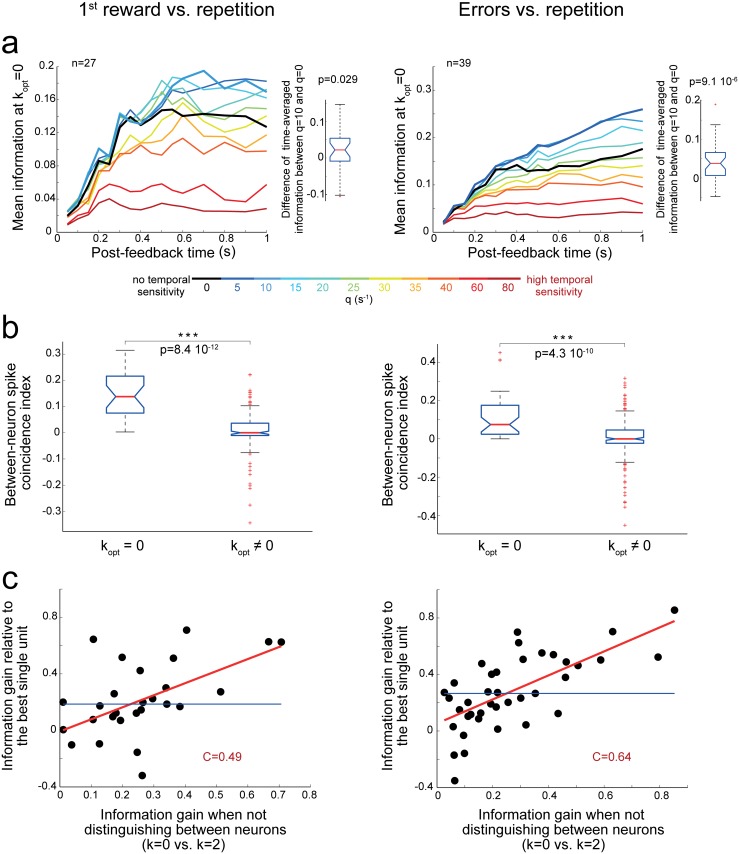
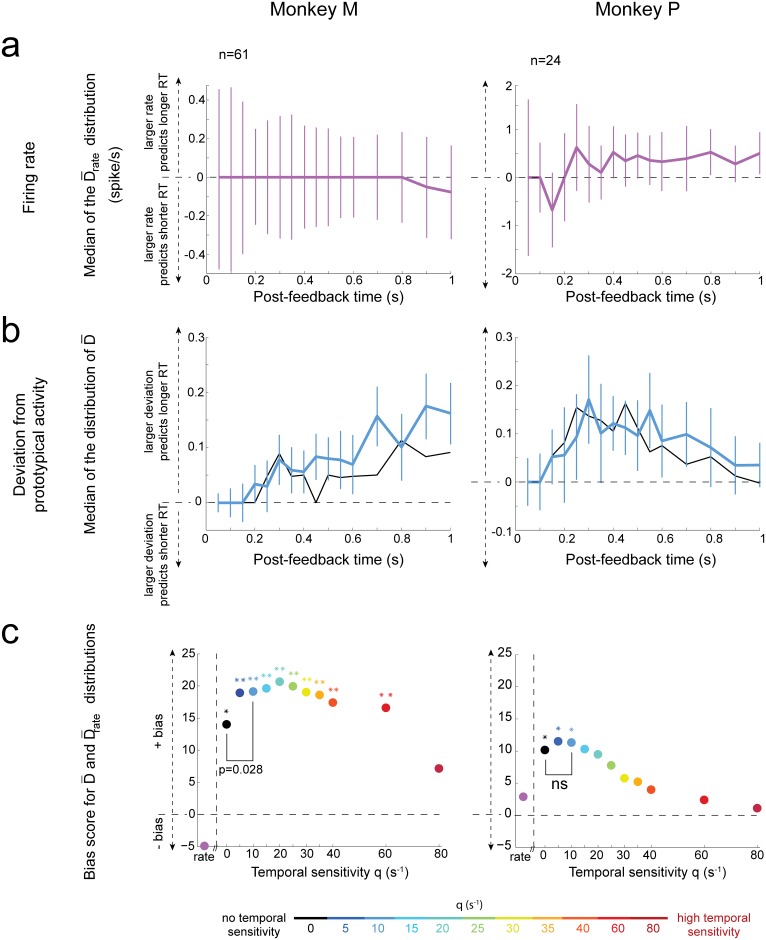
The frontal cortex controls behavioral adaptation in environments governed by complex rules. Many studies have established the relevance of firing rate modulation after informative events signaling whether and how to update the behavioral policy. However, whether the spatiotemporal features of these neuronal activities contribute to encoding imminent behavioral updates remains unclear. We investigated this issue in the dorsal anterior cingulate cortex (dACC) of monkeys while they adapted their behavior based on their memory of feedback from past choices. We analyzed spike trains of both single units and pairs of simultaneously recorded neurons using an algorithm that emulates different biologically plausible decoding circuits. This method permits the assessment of the performance of both spike-count and spike-timing sensitive decoders. In response to the feedback, single neurons emitted stereotypical spike trains whose temporal structure identified informative events with higher accuracy than mere spike count. The optimal decoding time scale was in the range of 70-200 ms, which is significantly shorter than the memory time scale required by the behavioral task. Importantly, the temporal spiking patterns of single units were predictive of the monkeys' behavioral response time. Furthermore, some features of these spiking patterns often varied between jointly recorded neurons. All together, our results suggest that dACC drives behavioral adaptation through complex spatiotemporal spike coding. They also indicate that downstream networks, which decode dACC feedback signals, are unlikely to act as mere neural integrators.


Conflict of interest statement

The authors have declared that no competing interests exist.

Figures

Fig 1
Fig 1. Task and proposed neural mechanisms.
(a) During exploration, monkeys had to find, by trial-and-error, which of four targets resulted in a reward. After receiving the first reward, monkeys entered a repetition period and received additional rewards by touching the same target. (b) Plausible dACC role in the task [,–31]: it processes feedback information (error or reward) to signal a behavioral strategy (either exploration, switch toward repetition, or repetitive behavior). It would also signal the adaptive value of updating the behavioral strategy (“level of control”). A downstream area would combine dACC signals with a memory of previous choices to decide which target to choose next. (c) Spike count versus timing sensitive decoding of dACC signals. Middle: a neural integrator decoder [7,9,10] responding with a firing rate proportional to the sum of input dACC spikes. The decoder maintains a memory of past inputs and can store a continuum of level of control values. dACC neurons firing preferentially during either errors, first rewards, or both [29] could project to different neural integrators. Bottom: an example of spatiotemporal decoder that is sensitive to the temporal structure of dACC spike trains and implements a memory. The connections between neurons create two stable states, with high and low firing. The high-activity state sustained through recurrent connections signals the need to adapt behavior. This decoder would be sensitive to its input temporal structure, with some patterns favoring the transition to, and/or stability of, the high-activity state [32]. This scheme illustrates how temporal coincidences in the input could favor the discharge of downstream neurons.
Fig 2
Fig 2. Decoding method.
(a) Dissimilarity of single neuron spike trains. Left: the dissimilarity is the sum of the costs of matching spike times and cancelling the spike count difference [35]. The cost of matching spike times depends on the parameter q (temporal sensitivity). When q = 0 s-1 (black curve), the dissimilarity only reflects the difference in spike count. For q > 0 s-1, the dissimilarity increases as q times the interspike interval dt before saturating at 2. Right: Each value of q > 0 can be related to a given time scale of Excitatory Post Synaptic Potentials (EPSPs, here taken as simple exponential traces: up). Indeed, decoding with this q value and decoding by summation of these EPSPs both lead to a similar sensitivity to spike timing. For instance, q = 10 s-1 corresponds to a 0–200 ms range of dt for which the dissimilarities are smaller than 2 (the maximum). This can be matched to the range of dt with efficient summation of 2 EPSPs decaying with 100 ms time scale (S1 Text, section 4). The 0–200 ms range of dt therefore gives rise to “temporal coincidences.” (b) Dissimilarity of multi-unit spike trains. Left: computation of the dissimilarity between two spike trains, each of which contains spikes from 2 neurons [13]. The dissimilarity depends on the parameter k, which determines the degree of distinction between the 2 neurons. The cost of matching 2 spikes is increased of a term k if the 2 spikes were emitted by 2 different neurons. As k increases, the matching of spikes emitted by the same neuron is favored. For higher values of k, there is a smaller range of between-neuron interspike intervals leading to dissimilarities smaller than 2 (i.e., leading to a temporal coincidence). Right: higher values of k can, for instance, be related to larger non-linearities in dendrites (here taken as thresholds and symbolized by a step within a circle). In the left dendrite, there are no non-linearities: synapses are close and depolarizations due to synaptic inputs can be directly summed and trigger firing (by crossing the threshold of the soma twice). This mirrors a maximal between-neuron summation, i.e., k = 0. Conversely, in the right dendrite the two synapses are on different sub-branches which both possess a threshold non-linearity. These thresholds (below which the synaptic currents are not transmitted to the soma) can prevent effective summation for large interspike intervals (second spike pair). This mirrors decoding with intermediate k values, causing only smaller interspike intervals to be associated with small dissimilarities between neurons (i.e. temporal coincidences).
Fig 3
Fig 3. Examples of single-unit dACC activities decoded with different temporal sensitivities.
(a) Spike densities (top) and raster plots (middle) during first reward (black curve) and repetition (grey curve) task epochs. The classification performance between first reward and repetition spike trains (i.e., information) is shown in the bottom graphs, the time in the abscissa being the time at which the analysis window (and thus, the decoding process) ends. Two neurons, from the two monkeys, are shown. These samples show that temporal sensitivity can improve classification performance. (b) Same as (a) but for errors and repetition in two other neurons from the two monkeys.
Fig 4
Fig 4. Optimal temporal sensitivity improves decoding of single unit behavioral adaptation signals.
(a) Time course of the mean information (averaged among significant cells) as a function of the decoding temporal sensitivity (q). Information values were computed over increasing post-feedback time windows (ending at the time indicated by the x-axis). Left: Discrimination between first reward and repetition task epochs. Right: Discrimination between error and repetition task epochs. (b) Time-averaged information <I>t (Table 1) for different temporal sensitivities (q). The ordinate axis is the normalized mean rank of <I>t. After a Friedman test, post-hoc comparisons with Tukey’s honestly significant difference correction were used for the 95% confidence intervals. Temporal sensitivities q > 0 that were performing significantly better compared to q = 0 are indicated by a star. (c) Distribution of the difference of information between optimal temporal decoding (qopt ≈ 10 s-1) and spike-count decoding (q = 0 s-1). Asterisks indicate the significance of signed-rank tests (the null hypothesis is the symmetric distribution around zero): *, p ≤ 0.05; **, p ≤ 0.01; ***, p ≤ 0.001. See also S1–S7 Figs and S1 Table.
Fig 5
Fig 5. Temporal decoding does not only rely on differences in time-varying firing rate.
This analysis was restricted to neurons significantly discriminating between first reward and repetition task epochs. (a) Shuffling of spikes between trials while preserving PETHs (i.e., time-dependent firing rates). This procedure was repeated 1,000 times within each task epoch and independently for each neuron. If information transmission in the data relies on PETHs, spike shuffling should not impact decoding. (b) Distribution of the difference between information I in original data and the median information in shuffled data (as in a). Asterisks indicate the significance of a signed-rank test: 1 to 3 asterisks, p ≤ 0.05, p ≤ 0.1, p ≤ 0.001, respectively. Top: spike-count decoding (q = 0s-1). Bottom: optimal temporal decoding at qopt ≈ 10 s-1 (this q value maximized information averaged over neurons). (c) Difference of Fano factor estimate (F, Table 1) between original data and the median of 1,000 shuffled datasets for first reward (green) and repetition (red). (d) Shuffling of spikes between trials while preserving both PETHs and spike count variability. The shuffling is done 1,000 times, independently for all analysis windows, task-epochs, and neurons. All spikes emitted during different trials of a task epoch are grouped and their order shuffled. Each pseudo-trial (right) is created by taking from the shuffled spike pool (middle) the same number of spikes as in the corresponding original trial (left). If information transmission in the data were shaped by PETHs whose amplitude could change across trials, spike shuffling would not impact decoding. (e) Top: Distribution of the difference between information in original data and the median information in shuffled data (as in d). Note that for q = 0 s-1 the curves of median, 25th and 75th percentiles are overlapped. Bottom: mean information in the original data decoded with qopt ≈ 10 s-1 and with q = 0 s-1, and in spike trains shuffled (as in d) decoded using qopt ≈ 10 s-1. (f) Left boxplot: difference between time-averaged information <I>t in original data and the median of <I>t in shuffled data (as in d) at qopt ≈ 10 s-1, with signed-rank p-value. Right boxplot: for comparison, the difference in time-averaged information between qopt and q = 0 s-1 in original data. Box plots show 25th, 50th, and 75th percentiles. The two quantities (left and right boxplots) were correlated (with coefficient C). See also S8 Fig.
Fig 6
Fig 6. Efficient paired decoding often requires distinguishing between the activities of the two neurons.
Left: Decoding first reward versus repetition task epochs. Right: Decoding error versus repetition task epochs. (a) Distribution of information gain when decoding a pair of units relative to decoding the isolated unit of the pair with the highest information, as a function of the information imbalance between the two units of the pair (Table 1). The red line indicates a linear regression fit. The distributions of information gains were significantly biased toward positive values, as indicated by a signed-rank test (all ps < 10−5). (b) Mean rank comparison (with Friedman ANOVA) of the time-averaged information <I>t as a function of (q,k). Data were pooled from both monkeys and were restricted to pairs with significant information. (c) Maximum mean (over neurons with significant information) information as a function of (q,k). Information was maximized over analysis windows ending in [0.05, 0.6] s, steps of 50 ms, and in [0.7, 1] s, steps of 100 ms. See also S9 and S10 Figs.
Fig 7
Fig 7. Coding properties of neuron pairs for which kopt = 0.
Left: Discrimination between the first reward and repetition task epochs. Right: Discrimination between error and repetition task epochs. (a) Left: Mean information among pairs with kopt = 0 (significant encoding) as a function of the duration of the analysis window and of the temporal sensitivity (q). Right: Distribution of differences in time-averaged information <I>t between qopt = 10 and q = 0 s-1 (for kopt = 0). The distribution has a significantly positive median (signed rank test). (b) The index of spike coincidence between neurons was higher for pairs with kopt = 0 compared to other significant pairs (ranked-sum test, p < 10−9). Note that the median indexes were larger than 0 for pairs with kopt = 0. This means that when comparing spike trains within one task epoch, coincidences between neurons occurred more often than when comparing spike trains between task epochs (Table 1). (c) The information gain relative to the most informative single unit was positively correlated with the information gain induced by the absence of neuron distinction. C: Spearman correlation coefficient, red line: linear fit, blue line: median of the distribution of information gains.
Fig 8
Fig 8. The temporal structure of single unit spike trains predicts behavioral response times.
Left: Monkey M (all significantly informative neurons for first reward versus repetitions). Right: Monkey P (significant neurons with information ≥ median; neurons with very little information did not permit robust behavioral prediction in this monkey, see main text and S12 Fig). Analysis windows end at the time indicated by the x-axis. (a) Test for the neural integrator decoder receiving excitatory inputs from dACC feedback-related neurons. Time course of the median D¯rate (difference in mean firing rate between trials with slow and fast response times). The value of D¯rate is positive if trials with high rates tend to be followed by long response times. Bars represent the median confidence interval (+/-interquartile range1.075n, where n is the number of neurons). (b) Test for the spatiotemporal decoder. Time course of the median D¯. The value of D¯ is positive when spike trains emitted in first reward trials followed by slower response times deviate more from prototypical spike trains than those emitted in trials followed by fast response times. The two curves correspond to q = 0 (black) and q = 10 s-1 (blue). (c) Bias scores (across different analysis windows) for D¯ and D¯rate. A large positive bias score indicates that the data is very positively skewed (relative to a distribution that is symmetrically distributed around 0). Asterisks indicate significance values for these biases (2-sided permutation test: *, p ≤ 0.05; **, p ≤ 0.01). For Monkey M, the lowest p-value was for q = 20 s-1 (p = 0.003); for Monkey P, the lowest p-value was for q = 5 s-1 (p = 0.029). Finally, the result of the comparison of D¯, averaged over different analysis windows, between qopt ≈ 10 s-1 and q = 0 s-1 is shown (signed-rank test). See also S2 and S11–S13 Figs.

References

    1. Shenhav A, Botvinick MM, Cohen JD. The expected value of control: an integrative theory of anterior cingulate cortex function. Neuron. 2013. July 24;79(2):217–40. 10.1016/j.neuron.2013.07.007 - DOI - PMC - PubMed
    1. London M, Roth A, Beeren L, Hausser M, Latham PE. Sensitivity to perturbations in vivo implies high noise and suggests rate coding in cortex. Nature. 2010. July 1;466(7302):123–7. 10.1038/nature09086 - DOI - PMC - PubMed
    1. Brunel N, Wang XJ. Effects of neuromodulation in a cortical network model of object working memory dominated by recurrent inhibition. Journal of computational neuroscience. 2001. Jul-Aug;11(1):63–85. - PubMed
    1. Mongillo G, Barak O, Tsodyks M. Synaptic theory of working memory. Science (New York, NY. 2008. March 14;319(5869):1543–6. - PubMed
    1. Rolls ET, Grabenhorst F, Deco G. Decision-making, errors, and confidence in the brain. Journal of neurophysiology. 2010. November;104(5):2359–74. 10.1152/jn.00571.2010 - DOI - PubMed

Publication types