. 2015 Aug 20;524(7565):309-314.
doi: 10.1038/nature14893. Epub 2015 Aug 12.

The ubiquitin kinase PINK1 recruits autophagy receptors to induce mitophagy

Affiliations

The ubiquitin kinase PINK1 recruits autophagy receptors to induce mitophagy

Michael Lazarou et al. Nature. .

Abstract

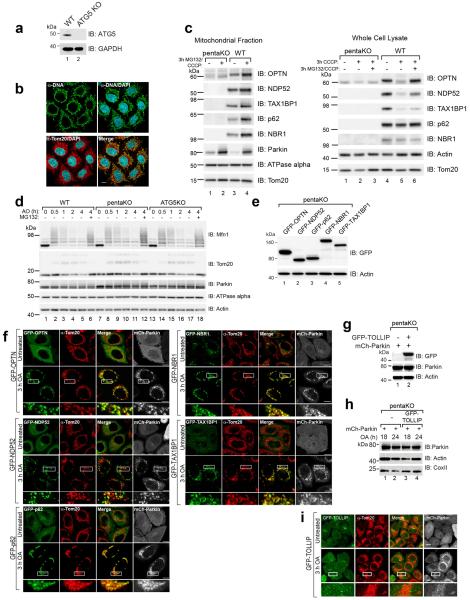
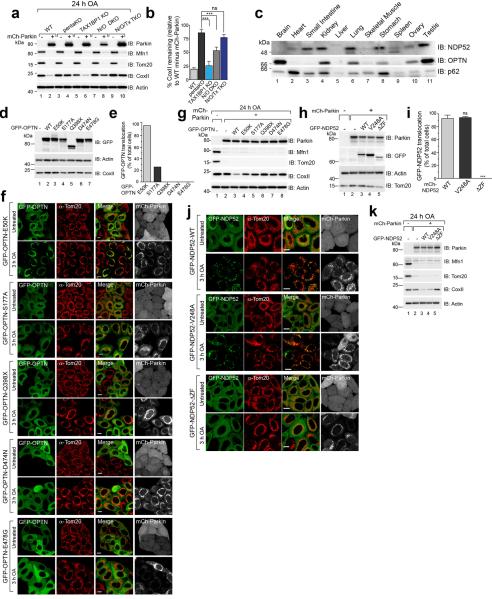
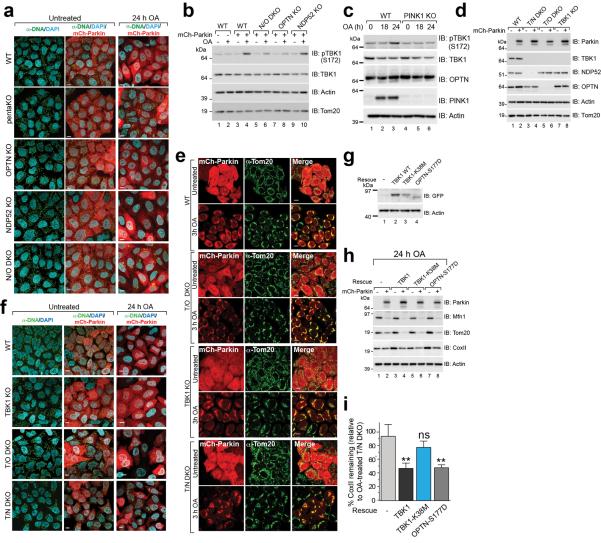
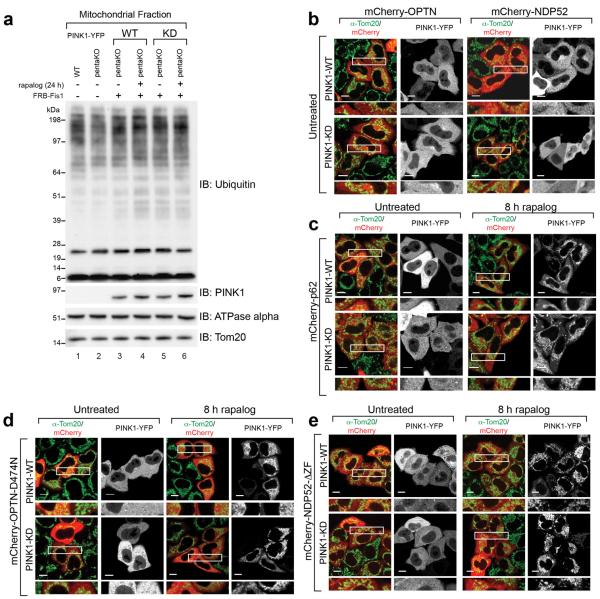
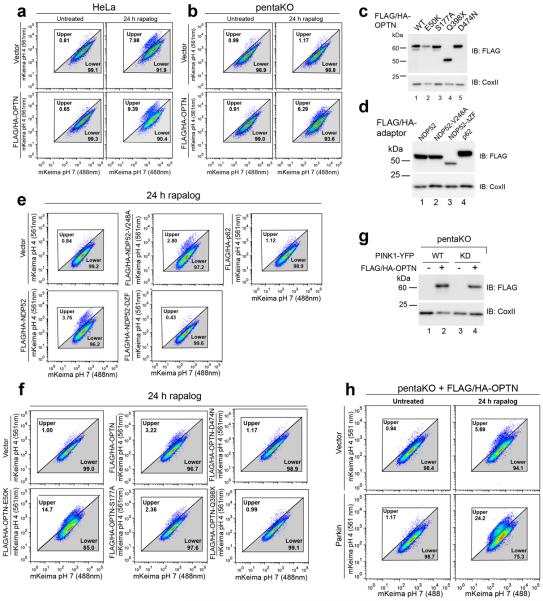
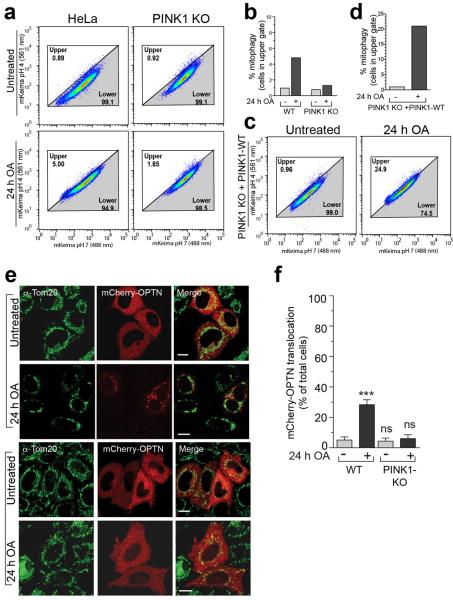
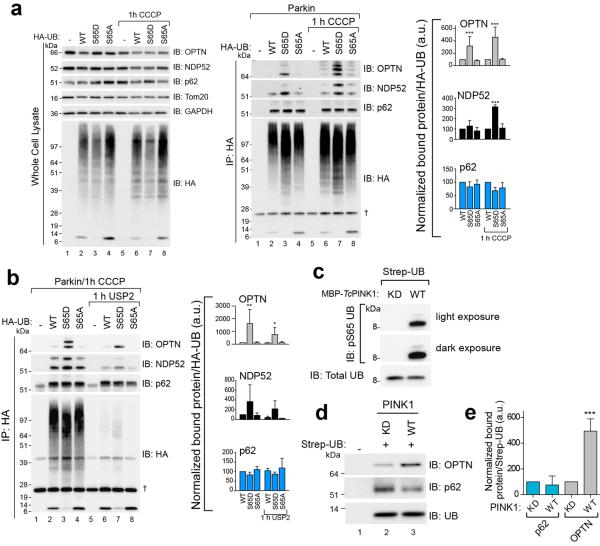
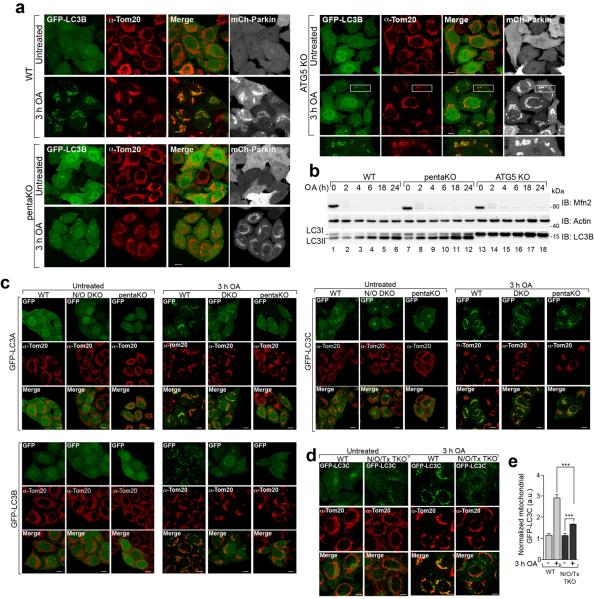
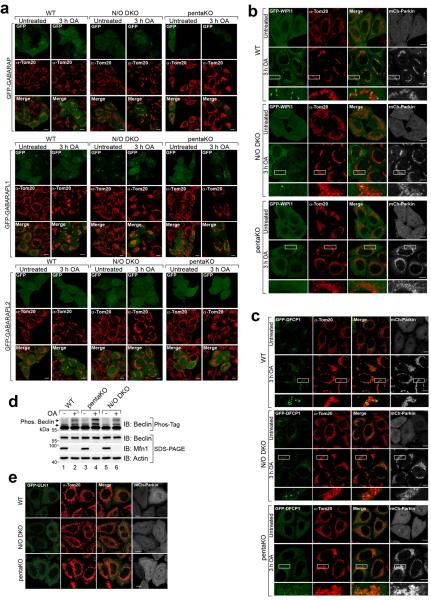
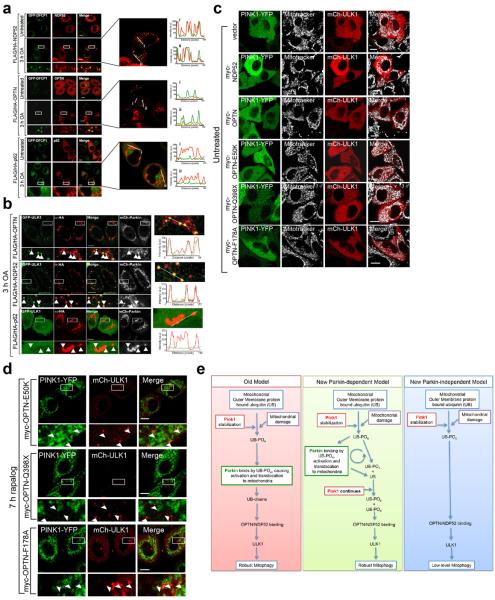
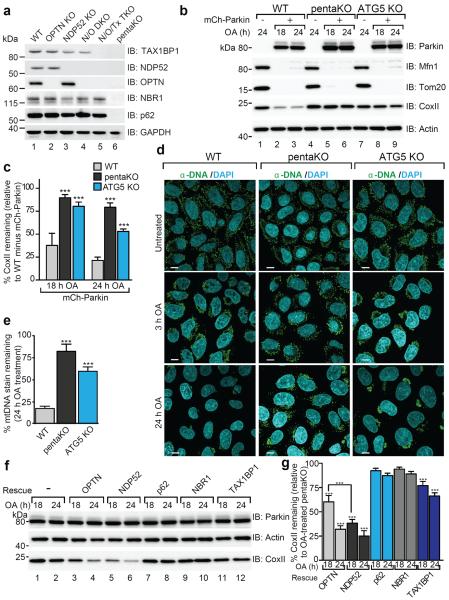
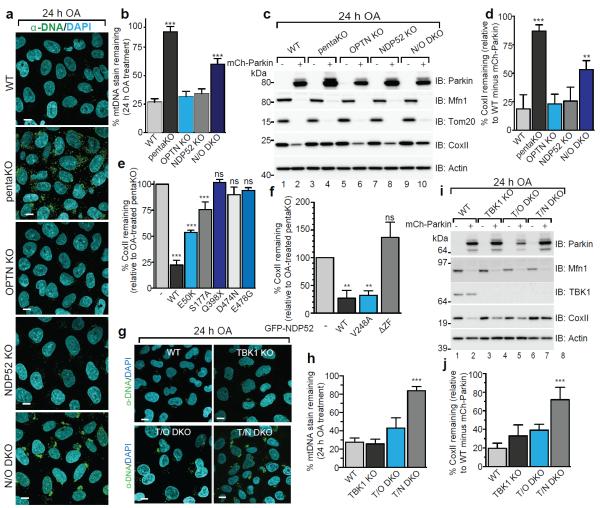
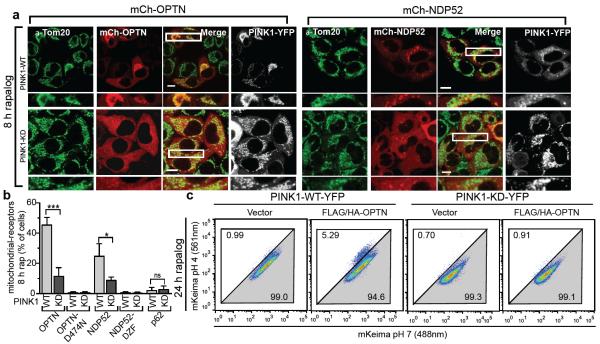
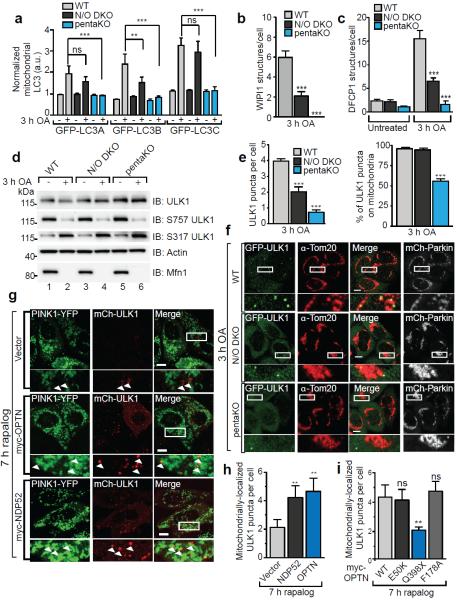
Protein aggregates and damaged organelles are tagged with ubiquitin chains to trigger selective autophagy. To initiate mitophagy, the ubiquitin kinase PINK1 phosphorylates ubiquitin to activate the ubiquitin ligase parkin, which builds ubiquitin chains on mitochondrial outer membrane proteins, where they act to recruit autophagy receptors. Using genome editing to knockout five autophagy receptors in HeLa cells, here we show that two receptors previously linked to xenophagy, NDP52 and optineurin, are the primary receptors for PINK1- and parkin-mediated mitophagy. PINK1 recruits NDP52 and optineurin, but not p62, to mitochondria to activate mitophagy directly, independently of parkin. Once recruited to mitochondria, NDP52 and optineurin recruit the autophagy factors ULK1, DFCP1 and WIPI1 to focal spots proximal to mitochondria, revealing a function for these autophagy receptors upstream of LC3. This supports a new model in which PINK1-generated phospho-ubiquitin serves as the autophagy signal on mitochondria, and parkin then acts to amplify this signal. This work also suggests direct and broader roles for ubiquitin phosphorylation in other autophagy pathways.


Figures

Extended Data Figure 1
Extended Data Figure 1. Analysis of knockout cell lines and characterization of autophagy receptor translocation to damaged mitochondria
a, ATG5 KO cell line confirmed by immunoblotting. b, Representative images of mitochondrial DNA nucleoids in HeLa cells immunostained with an α-DNA antibody (green) confirming colocalization with the mitochondrial marker Tom20 (red) (n=3). c, Mitochondrial fractions from mCherry-Parkin (mCh-Parkin) expressing pentaKO and WT cells were assessed by immunoblotting. d, mCh-Parkin expressing WT, pentaKO and ATG5 KOs were treated with OA or OA and MG132. Cell lysates were assessed by immunoblotting. e, Expression levels of GFP-tagged OPTN, NDP52, p62, NBR1 and TAX1BP1 re-expressed in pentaKOs by immunoblotting. f, Representative images of mCh-Parkin expressing pentaKOs from e immunostained for Tom20 (n=3). g, Expression of GFP-Tollip in mCh-Parkin pentaKOs. h, pentaKOs mCh-Parkin and with or without GFP-Tollip expression were immunoblotted. i, Representative images of mCh-Parkin pentaKOs expressing GFP-Tollip immunostained for Tom20 (n=3). Scale bars, 10 μm.
Extended Data Figure 2
Extended Data Figure 2. OPTN, NDP52 and TAX1BP1 triple knockout analysis and disease-associated mutations
a, KO cell lines with or without mCherry-Parkin (mCh-Parkin) expression were immunoblotted and b, CoxII levels were quantified. c, A panel of human tissue lysates was immunoblotted. d, Expression of WT or mutant GFP-OPTN in mCh-Parkin pentaKOs. e, Quantification of cells in f. >100 cells per condition. f, Representative images of mCh-Parkin pentaKOs expressing GFP-OPTN mutants immunostained for Tom20 (n=3). g, pentaKOs expressing mCh-Parkin were rescued with WT or mutant GFP-OPTN, analyzed by immunoblotting. See Fig. 2e for quantification of CoxII. h, Expression of WT or mutant GFP-NDP52 in mCh-Parkin pentaKOs. i, Quantification of cells in j. >100 cells per condition. j, Representative images of mCh-Parkin pentaKOs expressing WT or mutant GFP-NDP52 were immunostained for Tom20 (n=3). k, pentaKOs expressing mCh-Parkin rescued with WT or mutant GFP-NDP52 were analyzed by immunoblotting. See Fig. 2f for quantification of CoxII. Quantification in b and i are displayed as mean ± s.d. from 3 independent experiments using one-way ANOVA tests (***P<0.001, ns, not significant) and in e as mean from 2 independent experiments. Scale bars, 10 μm.
Extended Data Figure 3
Extended Data Figure 3. TBK1 in activates OPTN in PINK1/Parkin mitophagy
a, Representative images of untreated mCherry-Parkin (mCh-Parkin) cells and merged images of treated cells as indicated immunostained for DNA. See Fig. 2a for anti-DNA/DAPI images of treated samples (n=3). b, Cell lysates from WT, N/O (NDP52/OPTN) DKO, OPTN KO and NDP52 KO cells with or without mCh-Parkin expression were immunoblotted for TBK1 activation. c, Cell lysates from WT and PINK1 KO cells without Parkin expression were immunoblotted for TBK1 activation (S172 phosphorylation). d, Confirmation of T/N (TBK1/NDP52) DKO, T/O (TBK1/OPTN) DKO and TBK1 KO by immunoblotting. e, KO cell lines from d were immunostained for Tom20 (n=3). f, Representative images of untreated mCh-Parkin WT and KO cells, and merged images of treated cells as indicated were immunostained for DNA. See Figure 2g for anti-DNA/DAPI images treated samples (n=3). g, T/N DKO cells rescued with GFP-TBK1 WT or K38M, or GFP-OPTN S177D and were assessed by immunoblotting. h, Cells in g were assessed by immunoblotting. i, Quantification of CoxII levels in h displayed as mean ± s.d. from 3 independent experiments and use one-way ANOVA tests (**P<0.005, ns, not significant). OA, Oligomycin and Antimycin A. Scale bars, 10 μm.
Extended Data Figure 4
Extended Data Figure 4. Parkin-independent recruitment of receptors to mitochondria through PINK1 activity
a, Isolated mitochondria from WT and pentaKOs with or without FRB-Fis1 and with WT or kinase-dead (KD) PINK1Δ110-YFP-2xFKBP were immunoblotted. b–e, Representative images of pentaKOs expressing FRB-Fis1, WT (PINK1-WT) or kinase-dead (PINK1-KD) PINK1Δ110-YFP-2xFKBP and either (b) mCherry-OPTN or mCherry-NDP52, (c) mCherry-p62, (d) mCherry-OPTN-D474N or (e) mCherry-NDP52-ΔZF. Cells were (b) untreated or (c–e) treated with rapalog then immunostained for Tom20. All images are representative of three independent experiments. See Figure 3b for quantification. Scale bars, 10 μm.
Extended Data Figure 5
Extended Data Figure 5. PINK1 directly stimulates mitophagy in the absence of mitochondrial damage
a, b, Cells were treated with rapalog and analyzed by FACS for lysosomal positive mt-mKeima. Representative data for WT HeLa (a) and pentaKO (b) without or with FLAG/HA-OPTN. c, d, Cell lysates from pentaKOs expressing FRB-Fis1, PINK1Δ110-YFP-2xFKBP, mt-mKeima and (c) WT FLAG/HA-OPTN or mutants, (d) FLAG/HA-p62, WT FLAG/HA-NDP52 or NDP52 mutants as indicated were assessed for receptor expression by immunoblotting. e, f, Cells from c and d were rapalog treated analyzed by FACS for lysosomal positive mt-mKeima. Representative data of two experiments is presented. g, Cell lysates from pentaKOs expressing FRB-Fis1, with or without FLAG/HA-OPTN and WT or kinase-dead (KD) PINK1Δ110-YFP-2xFKBP were assessed for OPTN by immunoblotting. h, FLAG/HA-OPTN pentaKOs expressing FRB-Fis1, PINK1Δ110-YFP-2xFKBP, mt-mKeima transfected and either vector or untagged Parkin were analyzed by FACS. Representative data of two experiments is presented.
Extended Data Figure 6
Extended Data Figure 6. PINK1 directly stimulates mitophagy upon mitochondrial damage
Representative data of mt-mKeima-expressing a, WT, PINK1 KO or c, PINK1 KO rescued with PINK1-WT cells treated with OA then analyzed by FACS. b, d, Average percent mitophagy for two replicates of a and c, respectively. e, Representative images of WT HeLa cells expressing mCherry-OPTN and treated with OA as indicated were immunostained for Tom20 (n=3). f, Quantification of mCherry-OPTN translocation from cells in e. Data displayed as mean ± s.d. from 3 independent experiments and using one-way ANOVA tests (***P<0.001, ns, not significant).
Extended Data Figure 7
Extended Data Figure 7. OPTN and NDP52 preferentially bind phospho-mimetic ubiquitin
a, HeLa cells expressing mCherry-Parkin (Parkin) and HA-ubiquitin (HA-UB) WT, S65D or S65A were treated with CCCP. HA-UB was co-immunoprecipitated and the bound fraction was analyzed by immunoblotting. Quantification of the total bound fraction of OPTN, NDP52 and p62 are shown. b, HA-ubiquitin transfected into HeLa cells with mCherry-Parkin were treated with CCCP. HA-ubiquitin was immunoprecipitated. The bound fraction was treated with the deubiquitinase USP2 and washed to remove all unbound protein following deubiquitination. Quantification of the total bound fraction of OPTN, NDP52 and p62 are shown in the right panel. c,d, Strep-tagged ubiquitin (Strep-UB) was incubated with either WT or kinase-dead (KD) PINK1 in an in vitro phosphorylation reaction, immunoblotted with an anti-phosphoS65 ubiquitin antibody (c) and was then incubated with cytosol harvested from untreated, WT HeLa cells. The ubiquitin was then pulled down using Strep-Tactin beads and (d) analyzed by immunoblotting. e, Quantification of bound OPTN and p62 normalized to total ubiquitin. Data displayed in a, b and e as mean ± s.d. from 3 independent experiments and use one-way ANOVA tests. (***P<0.001, **P<0.005, *P<0.05). †, non-specific band. a.u., arbitrary units.
Extended Data Figure 8
Extended Data Figure 8. Analysis of LC3 family members and their translocation to damaged mitochondria in autophagy receptor KO cell lines
a, Representative images of WT, pentaKO and ATG5 KO HeLa cells expressing mCherry-Parkin (mCh-Parkin) and GFP-LC3B were immunostained for Tom20 (n=3). b, Cell lysates from mCh-Parkin expressing WT, pentaKO and ATG5 KO cells were immunoblotted. c, Representative images of WT, N/O (NDP52/OPTN) DKO and pentaKOs expressing mCh-Parkin and either GFP-tagged LC3A, LC3B or LC3C were immunostained for Tom20 (n=3, see Figure 4a for quantification). d, Representative images of WT and N/O/Tx (NDP52/OPTN/TAX1BP1) TKO cells expressing mCh-Parkin and GFP-LC3C were immunostained for Tom20 (n=3) and e, quantified for GFP-LC3C translocation to mitochondria. Quantification in e is displayed as mean ± s.d. from 3 independent experiments and use one-way ANOVA tests (***P<0.001). OA, Oligomycin and Antimycin A. Scale bars, 10 μm.
Extended Data Figure 9
Extended Data Figure 9. GABARAPs do not translocate to damaged mitochondria and early stages of autophagosome biogenesis mediated by WIPI1 and DFCP1 are inhibited in autophagy receptor deficient cell lines
Representative images of WT, N/O (NDP52/OPTN) DKO and pentaKOs expressing mCherry-Parkin (mCh-Parkin) and either (a) GFP-tagged GABARAP, GABARAPL1 or GABARAPL2, (b) GFP-WIPI1 or (c) GFP-DFCP1 immunostained for Tom20 (n=3 for each condition, see Figure 4b, c for quantification of b and c). d, mCh-Parkin cell lines as indicated were subjected to either Phos-Tag SDS-PAGE or standard SDS-PAGE followed by immunoblotting. Arrows indicate the position of phosphorylated Beclin species. e, Representative images of untreated WT, N/O (NDP52/OPTN) DKO and pentaKO cell lines expressing mCh-Parkin and GFP-ULK1 were immunostained for Tom20 and GFP (n=3). OA, Oligomycin and Antimycin A. Scale bars, 10 μm.
Extended Data Figure 10
Extended Data Figure 10. OPTN and NDP52 rescue DFCP1 and ULK1 recruitment deficit in pentaKOs
a, Representative images of pentaKOs expressing mCherry-Parkin (mCh-Parkin), GFP-DFCP1 and the indicated FLAG/HA-tagged autophagy receptors immunostained for HA (n=2). Right-hand panels display co-localization of FLAG/HA-tagged constructs and GFP-DFCP1 by fluorescence intensity line measurement. b, Representative images of pentaKOs expressing mCherry-Parkin and GFP-ULK1 were rescued with FLAG/HA-OPTN, FLAG/HA-NDP52, and FLAG/HA-p62, and immunostained for HA and GFP. Arrows indicate HA-tagged receptor puncta (n=2). Right panels display colocalization of HA and GFP by fluorescence intensity line measurement. c, d, Representative images of pentaKOs stably expressing FRB-Fis1 and transiently expressing PINK1Δ110-YFP-2xFKBP and vector or myc-tagged receptors, were (c) untreated or (d) treated with rapalog and imaged live (n=3, see Figure 4h, i for quantification of c, d). OA, Oligomycin and Antimycin A. Scale bars, 10 μm. e, Old and new models of PINK1/Parkin mitophagy. The old model is dominated by Parkin ubiquitination of mitochondrial proteins. Here PINK1 plays a small initiator role whose main function is to bring Parkin to the mitochondria. The new model depicts Parkin-dependent and independent pathways leading to robust and low-level mitophagy, respectively. Based on our data, PINK1 is central to mitophagy both before and after Parkin recruitment by phosphorylating UB to recruit both Parkin and autophagy receptors mitochondria, to induce clearance. In the absence of Parkin (right panel), this occurs at a low level due to the relatively low basal UB on mitochondria. When Parkin is present it serves to amplify the PINK1 generated UB-PO4 signal, allowing for robust and rapid mitophagy induction.
Figure 1
Figure 1. Identifying autophagy receptors required for PINK1/Parkin mitophagy
a, WT, OPTN KO, NDP52 KO, N/O (NDP52/OPTN) DKO, N/O/Tx (NDP52/OPTN/TAX1BP1) TKO, and pentaKO (NDP52/OPTN/TAX1BP1/NBR1/p62) HeLa cells were confirmed by immunoblotting. b, Cells as indicated with or without mCherry-Parkin (mCh-Parkin) were analyzed by immunoblotting and c, CoxII levels quantified. d, Representative images of mCh-Parkin expressing WT, pentaKO and ATG5 KO cells immunostained to label mitochondrial DNA (green) and e, quantified for mitophagy (24 h OA). >75 cells were counted per sample. f, Lysates from pentaKOs expressing mCh-Parkin and GFP-tagged autophagy receptors were immunoblotted and g, CoxII levels were quantified. Quantification in c, e and g are mean ± s.d. from 3 independent experiments and use one-way ANOVA (***P<0.001). OA, Oligomycin and Antimycin A. Scale bars, 10 μm.
Figure 2
Figure 2. OPTN and NDP52 are redundant in PINK1/Parkin mitophagy
a, Representative images of WT, pentaKO, OPTN KO, NDP52 KO and N/O (NDP52/OPTN) DKO cells expressing mCherry-Parkin immunostained with anti-DNA and b, quantified for mitophagy. c, Cell lines from a, were analyzed by immunoblotting and d, CoxII levels quantified. e, CoxII levels quantified from pentaKOs expressing mCherry-Parkin (mCh-Parkin) and rescued with WT or mutant GFP-OPTN (See Extended Data Fig. 2g for blots). f, CoxII levels quantified from pentaKOs expressing mCh-Parkin rescued with WT or mutant GFP-NDP52 (See Extended Data Fig. 2k for blots). g, Representative images of WT, TBK1 KO, T/O (TBK1/OPTN) DKO and T/N (TBK1/NDP52) DKO HeLa cells expressing mCherry-Parkin and immunostained with anti-DNA and h, mitophagy was quantified. i, Cells from g were immunoblotted and j, CoxII levels quantified. Quantification in b, d, e, f, h and i are mean ± s.d. from 3 independent experiments and use one-way ANOVA (***P<0.001, **P<0.005, ns, not significant). >75 cells were measured per confocal sample. OA, Oligomycin and Antimycin A. Scale bars, 10 μm. For untreated and mCherry-Parkin images of a and g, see Extended Data Fig. 3a and f, respectively.
Figure 3
Figure 3. PINK1 recruits Optineurin and NDP52 independent of Parkin to promote mitophagy
a, Representative images of HeLa cells expressing FRB-Fis1, WT (PINK1-WT) or kinase-dead (PINK1-KD) PINK1Δ110-YFP-2xFKBP and mCherry-OPTN (mCh-OPTN) or mCherry-NDP52 (mCh-NDP52) treated with rapalog. b, Quantification of receptor translocation in cells from a and Extended Data Fig. 4c–e. >100 cells were counted per sample. c, Cells were treated with rapalog and analyzed by FACS for lysosomal positive mt-mKeima. Representative data for WT or KD PINK1Δ110-YFP-2xFKBP in pentaKOs without or with FLAG/HA-OPTN expression. Quantification in b is displayed as mean ± s.d. from 3 independent experiments and uses one-way ANOVA tests (***P<0.001, *P<0.05, ns, not significant). For images of untreated cells from a, see Extended Data Fig. 4b. Scale bars, 10 μm.
Figure 4
Figure 4. Characterization of autophagy receptor function during mitophagy
mCherry-Parkin (mCh-Parkin) expressing WT, N/O (NDP52/OPTN) DKO and pentaKOs were quantified for a, GFP-LC3A, LC3B and LC3C translocation to mitochondria, b, GFP-WIPI1 or c, GFP-DFCP1 structures per cell (>100 cells counted for each sample) or d, were immunoblotted using phospho-specific anti-S757 and S317 ULK1 antibodies. e, mCherry-Parkin WT, N/O DKO and pentaKOs stably expressing GFP-ULK1 were quantified for GFP-ULK1 puncta per cell (left graph) and the percentage of those puncta on mitochondria (right graph). f, Representative data of e, cells were immunostained for Tom20 and GFP. g, pentaKOs expressing FRB-Fis1, PINK1Δ110-YFP-2xFKBP, mCherry-ULK1 (mCh-ULK1) and myc-tagged receptors, were treated with rapalog then imaged live. h, Quantification of mitochondrial ULK1 puncta in g. i, Quantification of mitochondrial ULK1 puncta in pentaKOs expressing FRB-Fis1, PINK1Δ110-YFP-2xFKBP, mCh-ULK1 and myc-OPTN mutants, treated with rapalog then imaged live. Quantification in a, b, c, e, h and i are mean ± s.d. from 3 independent experiments and use one-way ANOVA. (***P<0.001, **P<0.005, *P<0.05, ns, not significant). For live cell quantification >75 cells counted in a blinded manner. Quantification in h and i were performed after removal of outliers, see Online Methods for details. OA, Oligomycin and Antimycin A. Scale bars, 10 μm. a.u., arbitrary units. See Extended Data Figs. 8c, 9b, c and 10d for representative images of a, b, c, and i respectively. See Extended Data Fig. 9e untreated samples of f and Extended Data Fig. 10c for untreated images of h and i.

Comment in

Similar articles

Cited by

References

    1. Svenning S, Johansen T. Selective autophagy. Essays in Biochem. 2013;55:79–92. - PubMed
    1. Stolz A, Ernst A, Dikic I. Cargo recognition and trafficking in selective autophagy. Nat. Cell. Biol. 2014;16:495–501. - PubMed
    1. Narendra DP, et al. PINK1 Is Selectively Stabilized on Impaired Mitochondria to Activate Parkin. PLoS Biol. 2010;8:e1000298. - PMC - PubMed
    1. Narendra D, Tanaka A, Suen DF, Youle RJ. Parkin is recruited selectively to impaired mitochondria and promotes their autophagy. J. Cell Biol. 2008;183:795–803. - PMC - PubMed
    1. Kane LA, et al. PINK1 phosphorylates ubiquitin to activate Parkin E3 ubiquitin ligase activity. J. Cell Biol. 2014;205:143–153. - PMC - PubMed

Publication types

MeSH terms

Substances