. 2015 Aug 12:4:e07956.
doi: 10.7554/eLife.07956.

Enhancer additivity and non-additivity are determined by enhancer strength in the Drosophila embryo

Affiliations

Enhancer additivity and non-additivity are determined by enhancer strength in the Drosophila embryo

Jacques P Bothma et al. Elife. .

Abstract

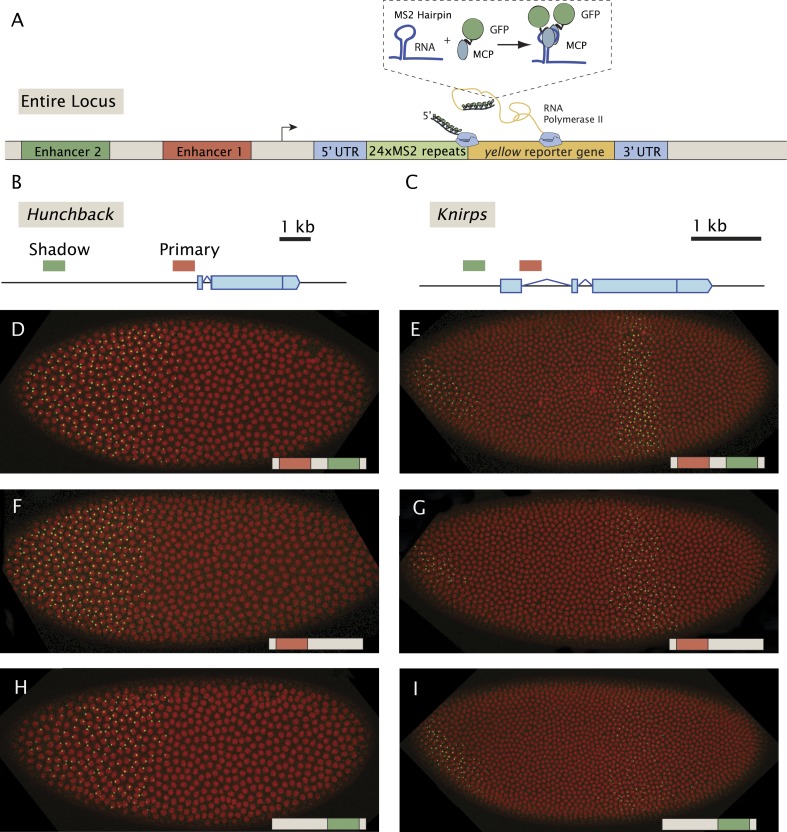
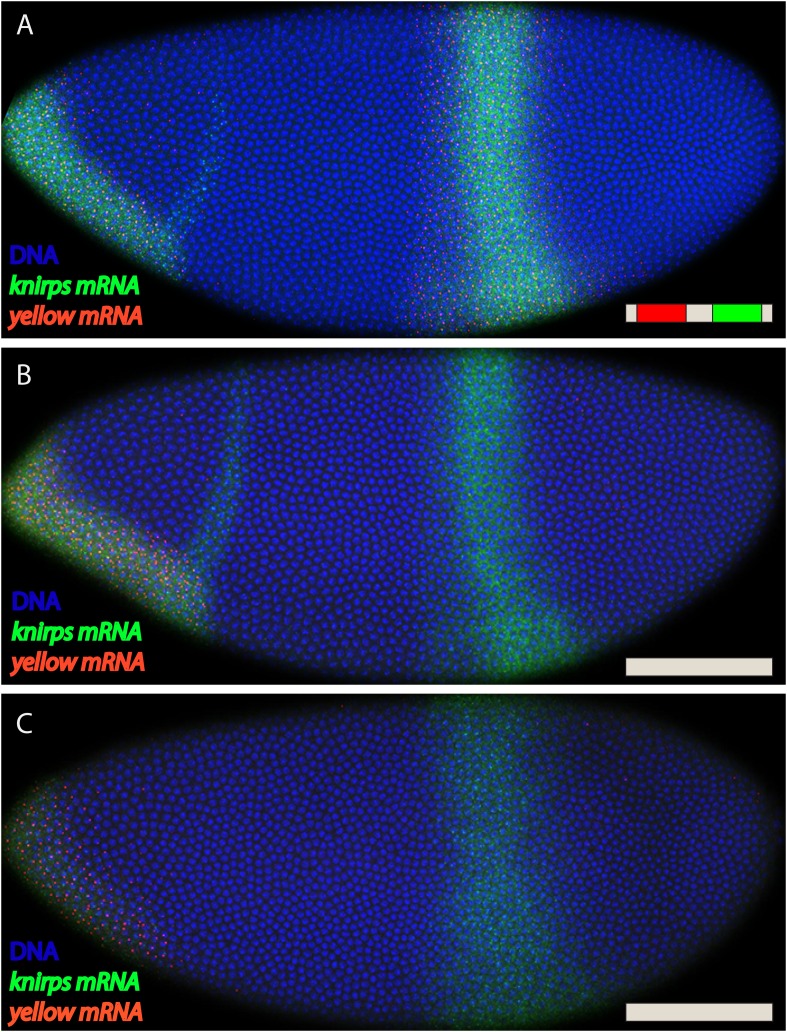
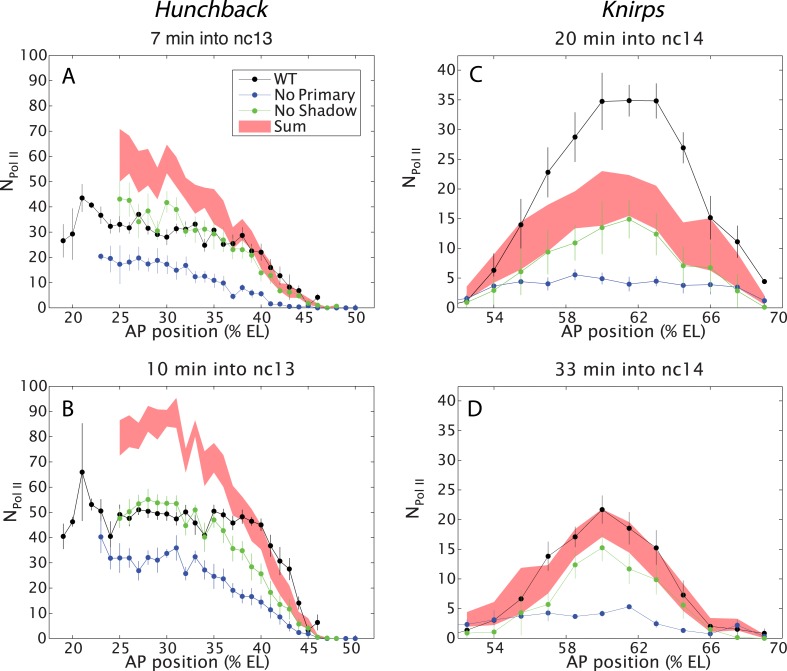
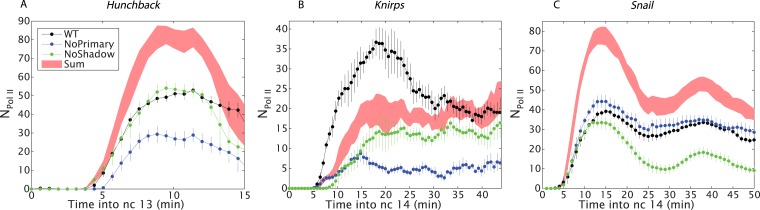
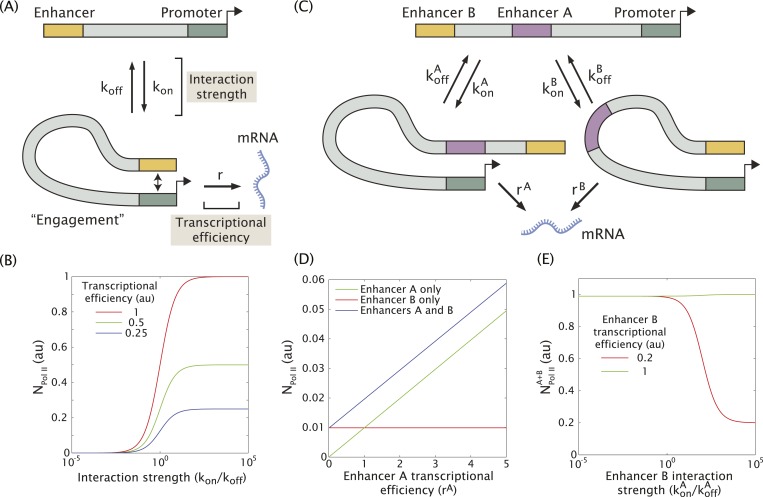
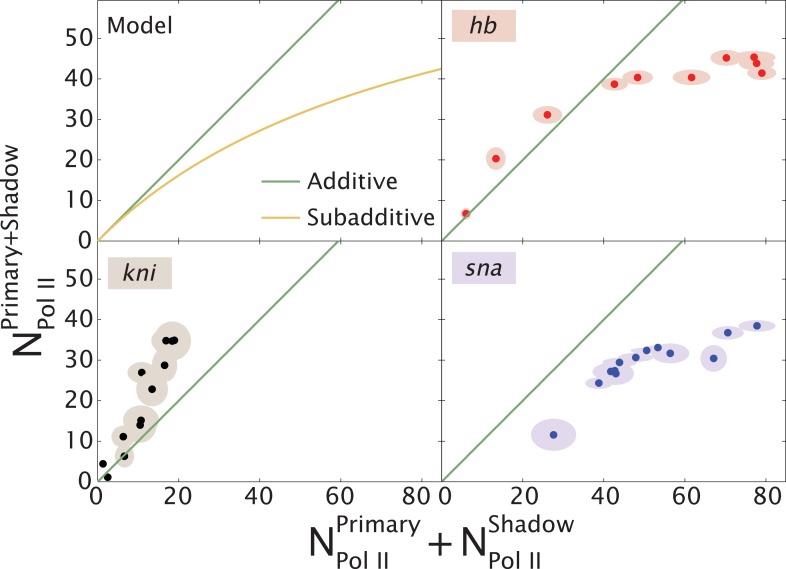
Metazoan genes are embedded in a rich milieu of regulatory information that often includes multiple enhancers possessing overlapping activities. In this study, we employ quantitative live imaging methods to assess the function of pairs of primary and shadow enhancers in the regulation of key patterning genes-knirps, hunchback, and snail-in developing Drosophila embryos. The knirps enhancers exhibit additive, sometimes even super-additive activities, consistent with classical gene fusion studies. In contrast, the hunchback enhancers function sub-additively in anterior regions containing saturating levels of the Bicoid activator, but function additively in regions where there are diminishing levels of the Bicoid gradient. Strikingly sub-additive behavior is also observed for snail, whereby removal of the proximal enhancer causes a significant increase in gene expression. Quantitative modeling of enhancer-promoter interactions suggests that weakly active enhancers function additively while strong enhancers behave sub-additively due to competition with the target promoter.

Keywords: D. melanogaster; biophysics; developmental biology; quantitative imaging; stem cells; structural biology; transcription.


Conflict of interest statement

The authors declare that no competing interests exist.

Figures

Figure 1.
Figure 1.. Live-imaging of transcriptional activity of hb and kni loci lacking different enhancers.
(A) General structure of the reporter constructs. A reporter construct with 24 repeats of the MS2 stem loops and the yellow gene was recombined into BACs spanning the hb and kni loci. The 5′ UTR and 3′ UTR of the endogenous genes were left intact. The MCP::GFP protein that binds to the MS2 stem loops is present in the unfertilized egg and in the early embryo. Gene models of (B) the hb and (C) kni loci showing the location of the primary and shadow enhancers (Perry et al., 2011). (D, F, H) Snapshots of Drosophila embryos expressing different versions of the hb BAC>MS2 reporter containing different combinations of the two enhancers 10 min into nuclear cleavage cycle 13 (nc13). The colored bar on the bottom right indicates which enhancer was removed. (E, G, I) Snapshots of Drosophila embryos expressing different versions of the kni BAC>MS2 reporter containing different combinations of the two enhancers in nc14. DOI: http://dx.doi.org/10.7554/eLife.07956.003
Figure 1—figure supplement 1.
Figure 1—figure supplement 1.. kni BAC expression lacking both shadow and primary enhancers.
Fluorescent in situ hybridization of endogenous kni and kni BAC>yellow transgenes. (A) Shows an embryo with the fully intact kni BAC>yellow transgene in late nc 14. (B, C) Show embryos with the kni BAC>yellow transgene lacking both primary and shadow enhancers, removing both enhancers abolishes all activity in the stripe domain. In (A) an embryo is in late nc14 and (B) shows and embryo in early nc 14. DOI: http://dx.doi.org/10.7554/eLife.07956.004
Figure 2.
Figure 2.. Combined effect of multiple enhancers as a function of AP position.
(A, B) Mean number of Pol II molecules transcribing per nucleus (NPol II) in the hb BAC reporters containing different combinations of enhancers as a function of AP position for two time points in nc13. NPol II is calculated by averaging data from at least three embryos at each AP position. The predicted sum of the individual enhancers is also shown. Note the additivity at the boundary vs the sub-additivity at the core, anterior domain of the pattern. (C, D) Mean number of Pol II molecules transcribing per nucleus (NPol II) in the kni BAC reporters in nc14 as a function of AP position. For kni, we see super-additive behavior in the beginning of nc14 which then becomes additive later in nc14. The absolute number of transcribing Pol II molecules was estimated following a previous calibration (Garcia et al., 2013). Error bars are the standard error of the mean over multiple embryos. DOI: http://dx.doi.org/10.7554/eLife.07956.008
Figure 3.
Figure 3.. Combined effect of multiple enhancers as a function of time.
(A) Time course of the mean number of Pol II molecules transcribing per nucleus (NPol II) for the different hb BAC transgenes and sum of individual enhancers at 27% EL for the duration of nc13. (B) kni BAC transgenes activities and the sum of individual enhancer activity at 60% EL for the first 50 min of nc14. (C) sna BAC transgenes and the sum of individual enhancer activities averaged over the central mesoderm for the initial 50 min of nc14. Error bars are the standard error of the mean over multiple embryos. DOI: http://dx.doi.org/10.7554/eLife.07956.009
Figure 4.
Figure 4.. Model of enhancer–promoter interactions and its predictions for mRNA production.
(A) Minimal model of one enhancer engaging a promoter. kon and koff are the rates of promoter engagement and disengagement, respectively, and determine the interaction strength. r is the rate of mRNA production when the promoter is engaged and is a measure of the transcriptional efficiency. The mean number of Pol II molecules transcribing per nucleus (NPol II) is proportional to the rate of mRNA production. (B) As the interaction strength of a single enhancer is increased, the amount of mRNA produced increases up to a maximum value dictated by the transcriptional efficiency. (C) The model in (A) can be generalized to allow for multiple enhancers interacting with the same promoter. (D) In the regime where the interaction strength of both promoters is weak (kon/koff = 0.01), the amount of mRNA produced by having both A and B is simply the sum of the individual contributions of A and B, (r = 1). (E) In the regime where the interaction strength is large, the combined activity of both enhancers can be significantly less than the sum the individual enhancers. A less efficient enhancer A (rA = 0.2 au) can interfere with the more efficient enhancer B (rB = 1 au) such that their combined activity is significantly less than the sum of the activities of individual enhancers. DOI: http://dx.doi.org/10.7554/eLife.07956.010
Figure 5.
Figure 5.. Theoretical expectation and experimental results showing different regimes of combined enhancer action.
(Upper left) Theoretical predictions (yellow) illustrating how the rate of mRNA production from both enhancers, NPol IIPrimary+Shadow, varies with the sum of the activity of the individual enhancers, NPol IIPrimary+NPol IIShadow (yellow). Mean number of Pol II molecules transcribing per nucleus (NPol II) is proportional to the rate of mRNA production. The green line shows perfect additivity for comparison. The model predicts additive behavior (NPol IIPrimary+ShadowNPol IIPrimary+NPol IIShadow) when the rate of production is low and sub-additive behavior (NPol IIPrimary+Shadow<NPol IIPrimary+NPol IIShadow) as the production rate increases. As the interaction strength of individual enhancers increases so does the rate of mRNA production, but the combined activity of both enhancers becomes sub-additive. (Upper right, lower left, lower right) Transcriptional activity of intact loci vs the sum of activities of individual enhancers for hb, kni, and sna at different times. A green line has been drawn in to indicate where NPol IIPrimary+Shadow is equal to NPol IIPrimary+NPol IIShadow. For hb and kni, the plots show data taken at different AP positions at 10 min into nc 13 and 20 min into nc 14, respectively, while for sna the datapoints were at different times. Ellipses indicate standard error of the mean. DOI: http://dx.doi.org/10.7554/eLife.07956.011

References

    1. Arnold CD, Gerlach D, Stelzer C, Boryń ŁM, Rath M, Stark A. Genome-wide quantitative enhancer activity maps identified by STARR-seq. Science. 2013;339:1074–1077. doi: 10.1126/science.1232542. - DOI - PubMed
    1. Bothma JP, Garcia HG, Esposito E, Schlissel G, Gregor T, Levine M. Dynamic regulation of eve stripe 2 expression reveals transcriptional bursts in living Drosophila embryos. Proceedings of the National Academy of Sciences of USA. 2014;7:1–6. doi: 10.1073/pnas.1410022111. - DOI - PMC - PubMed
    1. Buecker C, Wysocka J. Enhancers as information integration hubs in development: lessons from genomics. Trends in Genetics. 2012:1–9. doi: 10.1016/j.tig.2012.02.008. - DOI - PMC - PubMed
    1. Di Talia S, Wieschaus EF. Short-term integration of Cdc25 dynamics controls mitotic entry during Drosophila gastrulation. Developmental Cell. 2012;22:763–774. doi: 10.1016/j.devcel.2012.01.019. - DOI - PMC - PubMed
    1. Dunipace L, Ozdemir A, Stathopoulos A. Complex interactions between cis-regulatory modules in native conformation are critical for Drosophila snail expression. Development. 2011;4084:4075–4084. doi: 10.1242/dev.069146. - DOI - PMC - PubMed

Publication types

MeSH terms