. 2015 Aug 12;11(8):e1005110.
doi: 10.1371/journal.ppat.1005110. eCollection 2015 Aug.

Incomplete Neutralization and Deviation from Sigmoidal Neutralization Curves for HIV Broadly Neutralizing Monoclonal Antibodies

Affiliations

Incomplete Neutralization and Deviation from Sigmoidal Neutralization Curves for HIV Broadly Neutralizing Monoclonal Antibodies

Laura E McCoy et al. PLoS Pathog. .

Abstract

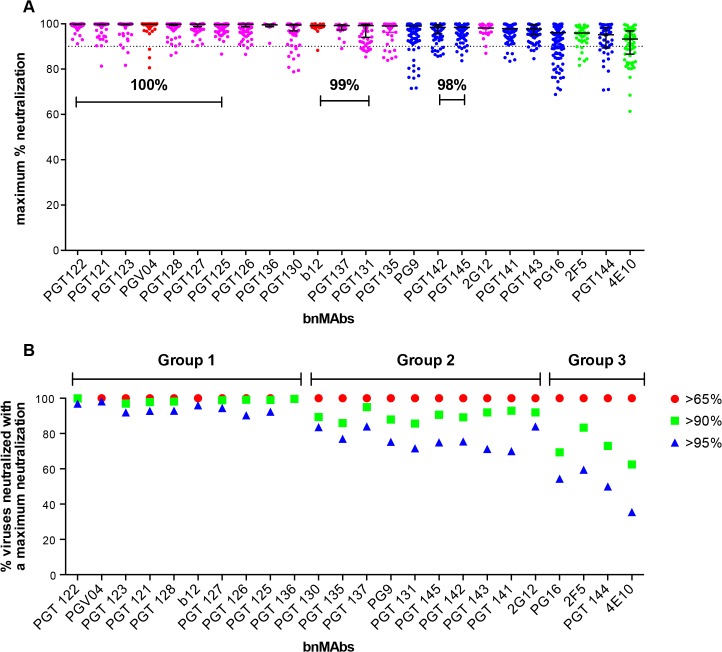
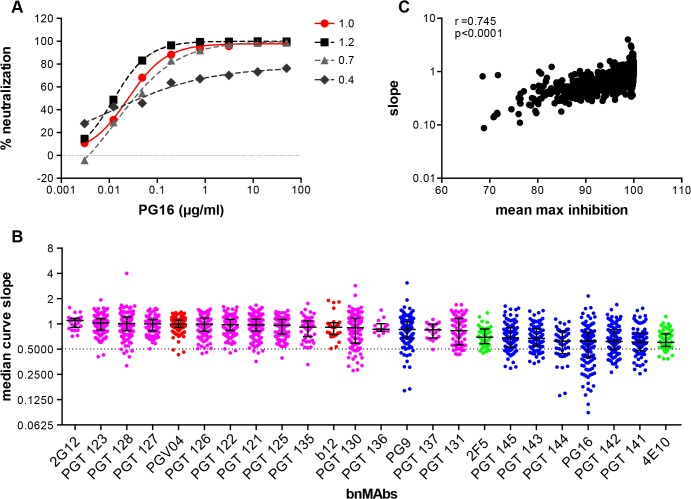
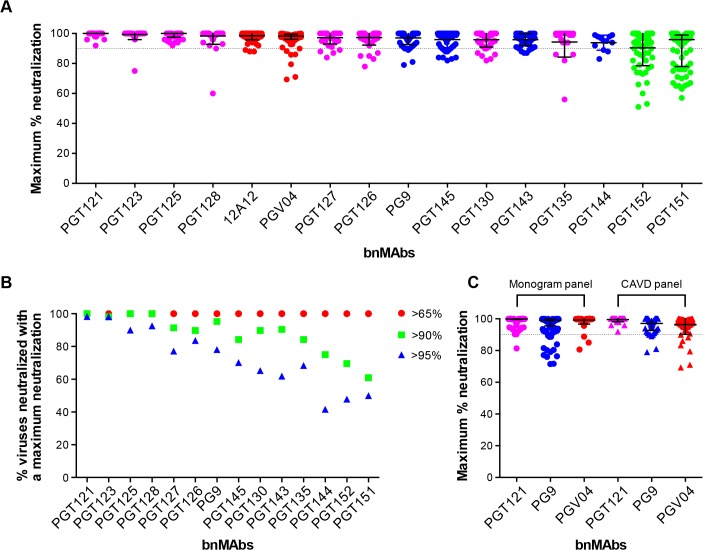
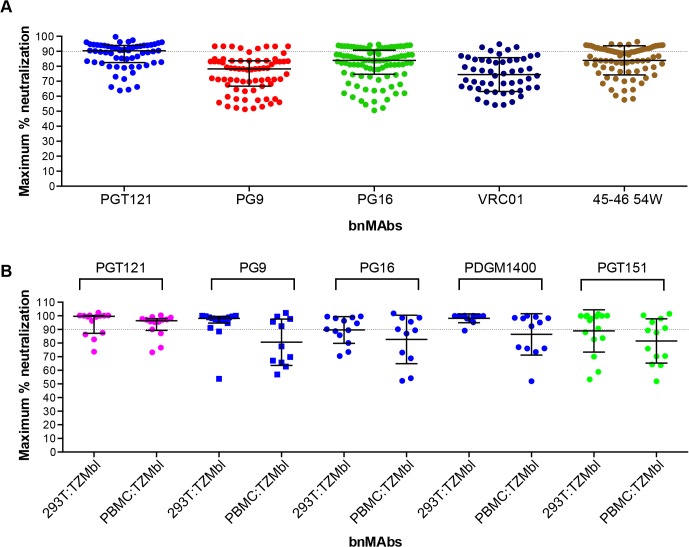
The broadly neutralizing HIV monoclonal antibodies (bnMAbs) PG9, PG16, PGT151, and PGT152 have been shown earlier to occasionally display an unusual virus neutralization profile with a non-sigmoidal slope and a plateau at <100% neutralization. In the current study, we were interested in determining the extent of non-sigmoidal slopes and plateaus at <100% for HIV bnMAbs more generally. Using both a 278 panel of pseudoviruses in a CD4 T-cell (U87.CCR5.CXCR4) assay and a panel of 117 viruses in the TZM-bl assay, we found that bnMAbs targeting many neutralizing epitopes of the spike had neutralization profiles for at least one virus that plateaued at <90%. Across both panels the bnMAbs targeting the V2 apex of Env and gp41 were most likely to show neutralization curves that plateaued <100%. Conversely, bnMAbs targeting the high-mannose patch epitopes were less likely to show such behavior. Two CD4 binding site (CD4bs) Abs also showed this behavior relatively infrequently. The phenomenon of incomplete neutralization was also observed in a large peripheral blood mononuclear cells (PBMC)-grown molecular virus clone panel derived from patient viral swarms. In addition, five bnMAbs were compared against an 18-virus panel of molecular clones produced in 293T cells and PBMCs and assayed in TZM-bl cells. Examples of plateaus <90% were seen with both types of virus production with no consistent patterns observed. In conclusion, incomplete neutralization and non-sigmoidal neutralization curves are possible for all HIV bnMAbs against a wide range of viruses produced and assayed in both cell lines and primary cells with implications for the use of antibodies in therapy and as tools for vaccine design.


Conflict of interest statement

I have read the journal's policy and the authors of the manuscript have the following competing interests: EF, HS and TW are employed by the commercial companies, Abcam Burlingame, Crucell Holland B.V. and Monogram Biosciences Inc. respectively. This does not alter our adherence to all PLOS Pathogens policies on sharing data and materials.

Figures

Fig 1
Fig 1. Maximum neutralization activity of bnMAbs in a U87 target cell assay.
(A) The bnMAbs are ordered from left to right according to decreasing medians of percent maximum neutralization. Each point on the graph represents the percent at which the neutralization curve plateaued for a single virus. The percentages above the bars group bnMAb medians that have the same values. The dotted line designates 90%. The bars represent the medians and the whiskered bars represent the interquartile range. The data points are colored according to which site the bnMAb targets: high-mannose patch (magenta), CD4bs (red), V2 apex (blue), and MPER (green). (B) Percent viruses neutralized with a maximum neutralization of >95% (blue), >90% (green), and >65% (red). BnMAb groups are indicated above the figure in black and described in the text.
Fig 2
Fig 2. Deviation from standard dose-response curve by bnMAbs in a U87 target cell assay.
(A) Representative experiment of PG16 neutralization of HIV pseudoviruses: MGRM-Chronic-B-017.c13, slope = 1.0 (red circle); MGRM-G-022.c02, slope = 1.2 (black square); MGRM-Chronic-B-006.c06, slope = 0.7 (light gray triangle); and MGRM-AG-011.c15, slope = 0.4 (dark gray diamond). (B) The neutralization curve slopes were determined for data from Fig 1A. BnMAbs are ordered according to decreasing medians. The bars represent the medians and the whiskered bars represent the interquartile range. The data points are colored according to which site the bnMAb targets: high-mannose patch (magenta), CD4bs (red), V2 apex (blue), and MPER (green). The dotted line denotes a slope of 0.5. (C) The neutralization curve slope value of each bnMAb for each virus on the y-axis is plotted against the corresponding MPN for each virus-bnMAb pair on the x-axis. Spearman correlation was used for statistical analysis. The Spearman’s rank correlation coefficient was calculated at 0.745 and the P value <0.0001.
Fig 3
Fig 3. Maximum neutralization activity of bnMAbs in a TZM-bl target cell assay.
(A) The bnMAbs are ordered from left to right according to decreasing medians of MPN. Each point on the graph represents the percent at which the neutralization curve plateaued for a single virus. The dotted line designates 90%. The bars represent the medians and the whiskered bars represent the interquartile range. The data points are colored according to which site the bnMAb targets: high-mannose patch (magenta), CD4bs (red), V2 apex (blue), and gp41 (green). (B) Percent viruses neutralized with a MPN of >65% (red), >90% (green), and >95% (blue). (C) Each point on the graph represents the percent at which the neutralization curve plateaued for a single virus against either PGT121 (magenta), PG9 (blue) or PGV04 (red). The assay system used to measure neutralization is indicated above the data points, which are filled circles for the monogram U87 assay and unfilled squares for the CAVD TZM-bl assay.
Fig 4
Fig 4. Maximum neutralization activity of bnMAbs in PBMC assays.
(A) Each point on the graph represents the percent at which the neutralization curve plateaued for a single PBMC-grown clade B virus assayed in PBMC cells. The dotted line designates 90%. (B) Each point on the graph represents the percent at which the neutralization curve plateaued for a single molecular clone virus against the bnMAbs listed above the data points. Virus clones were produced in both 293T cells and PBMCs as indicated on the x-axis. The data points are colored according to which site the bnMAb targets: high-mannose patch (magenta), CD4bs (red), V2 apex (blue), gp41-gp120 interface (green). The bars represent the medians and the whiskered bars represent the interquartile range.

References

    1. Leonard CK, Spellman MW, Riddle L, Harris RJ, Thomas JN, et al. (1990) Assignment of intrachain disulfide bonds and characterization of potential glycosylation sites of the type 1 recombinant human immunodeficiency virus envelope glycoprotein (gp120) expressed in Chinese hamster ovary cells. J Biol Chem 265: 10373–10382. - PubMed
    1. Lee WR, Yu XF, Syu WJ, Essex M, Lee TH (1992) Mutational analysis of conserved N-linked glycosylation sites of human immunodeficiency virus type 1 gp41. J Virol 66: 1799–1803. - PMC - PubMed
    1. Burton DR, Poignard P, Stanfield RL, Wilson IA (2012) Broadly neutralizing antibodies present new prospects to counter highly antigenically diverse viruses. Science 337: 183–186. 10.1126/science.1225416 - DOI - PMC - PubMed
    1. West AP Jr., Scharf L, Scheid JF, Klein F, Bjorkman PJ, et al. (2014) Structural insights on the role of antibodies in HIV-1 vaccine and therapy. Cell 156: 633–648. 10.1016/j.cell.2014.01.052 - DOI - PMC - PubMed
    1. Mascola JR, Haynes BF (2013) HIV-1 neutralizing antibodies: understanding nature's pathways. Immunol Rev 254: 225–244. 10.1111/imr.12075 - DOI - PMC - PubMed

Publication types