. 2015 Aug 12;11(8):e1005421.
doi: 10.1371/journal.pgen.1005421. eCollection 2015 Aug.

New Routes to Phylogeography: A Bayesian Structured Coalescent Approximation

Affiliations

New Routes to Phylogeography: A Bayesian Structured Coalescent Approximation

Nicola De Maio et al. PLoS Genet. .

Abstract

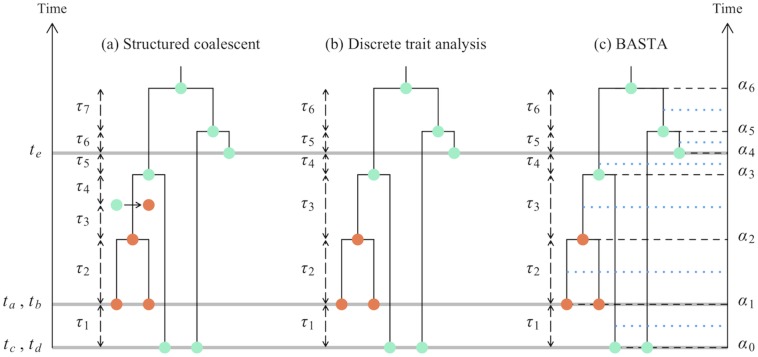
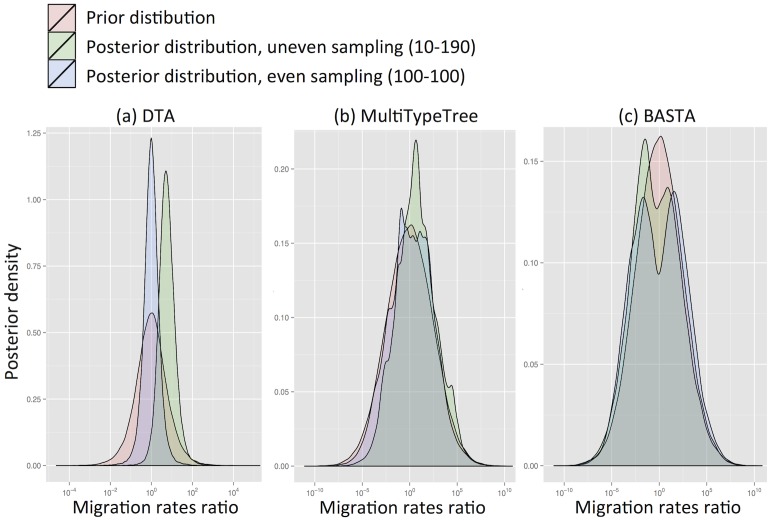
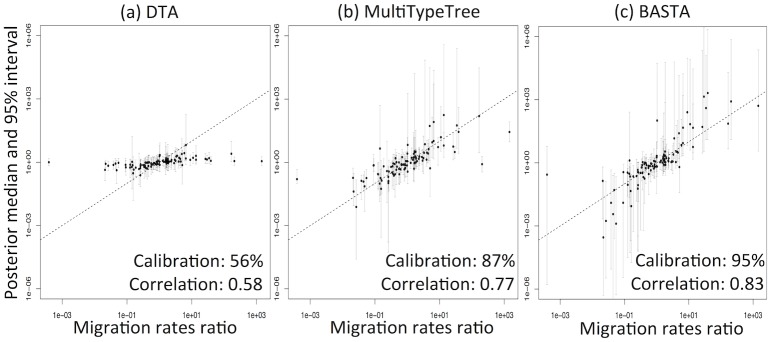
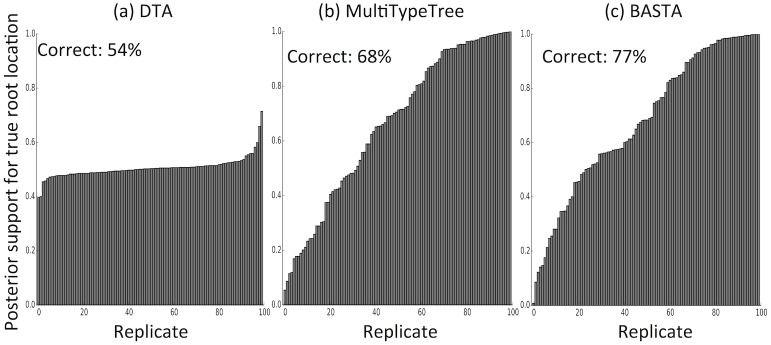
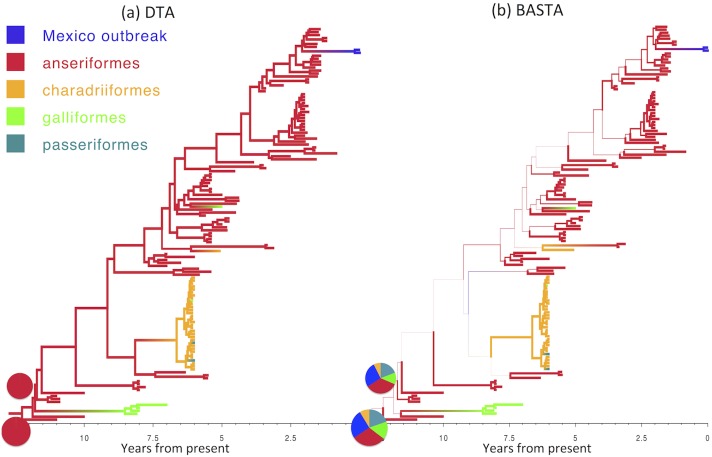
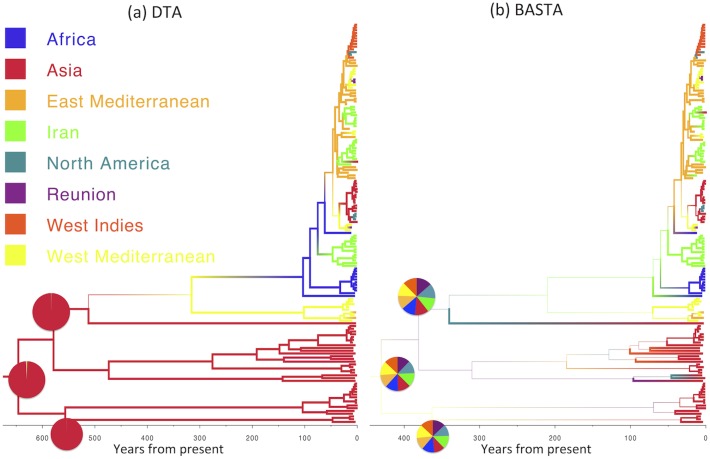
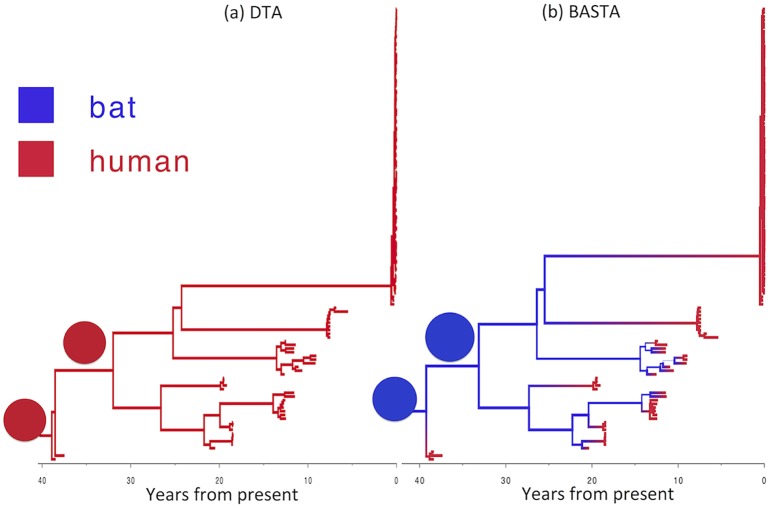
Phylogeographic methods aim to infer migration trends and the history of sampled lineages from genetic data. Applications of phylogeography are broad, and in the context of pathogens include the reconstruction of transmission histories and the origin and emergence of outbreaks. Phylogeographic inference based on bottom-up population genetics models is computationally expensive, and as a result faster alternatives based on the evolution of discrete traits have become popular. In this paper, we show that inference of migration rates and root locations based on discrete trait models is extremely unreliable and sensitive to biased sampling. To address this problem, we introduce BASTA (BAyesian STructured coalescent Approximation), a new approach implemented in BEAST2 that combines the accuracy of methods based on the structured coalescent with the computational efficiency required to handle more than just few populations. We illustrate the potentially severe implications of poor model choice for phylogeographic analyses by investigating the zoonotic transmission of Ebola virus. Whereas the structured coalescent analysis correctly infers that successive human Ebola outbreaks have been seeded by a large unsampled non-human reservoir population, the discrete trait analysis implausibly concludes that undetected human-to-human transmission has allowed the virus to persist over the past four decades. As genomics takes on an increasingly prominent role informing the control and prevention of infectious diseases, it will be vital that phylogeographic inference provides robust insights into transmission history.


Conflict of interest statement

The authors have declared that no competing interests exist.

Figures

Fig 1
Fig 1. Graphical representation of phylogeographic models.
In this study we consider three phylogeographic methods: the structured coalescent, DTA, and BASTA. This figure shows some of the differences in these models, in particular in the modelled events and time intervals. Coloured dots show different subpopulations (one orange subpopulation and one turquoise for both sampled and internal nodes in the genealogy. a) In the structured coalescent eight events are considered, delimiting seven time intervals of lengths τ 1τ 7. Three of these events are sampling events (denoted by the grey horizontal lines), one is a migration event (represented by an arrow between two coloured dots), and four are coalescence events. b) In DTA, migration events are not explicitly parameterized, so we have a total of seven sampling or coalescence events, delimiting six time intervals of lengths τ 1τ 6. While locations for internal nodes are depicted in the figure, the method effectively integrates over all possible ancestral locations at each MCMC step. c) As in DTA, BASTA does not consider migration events, and therefore has seven events and six time intervals. Yet, each of these intervals is split exactly in half (blue horizontal dotted lines), and the two halves are considered separately. Again, as in DTA, at each MCMC step BASTA integrates over all possible internal nodes locations.
Fig 2
Fig 2. DTA is inherently biased by the sampling process.
To test for inherent sampling bias, we analysed a dataset containing just sampling locations, but no genetic information using (a) DTA, (b) MTT and (c) BASTA. For a method robust to sampling, the posteriors (green and blue distributions) should be unchanged from the prior (pink distribution). However, DTA treats the sampling process as informative about migration parameters, unlike the structured coalescent-based methods, introducing a sampling strategy-dependent bias. The blue and green posterior distributions correspond respectively to even sampling (100 samples per subpopulation) and uneven sampling (10 and 190 samples per location). The mean migration rate was f=5.0. Each plot is obtained from ten merged posteriors of independent MCMC runs each of 5 × 10⁶ iterations.
Fig 3
Fig 3. DTA under-represents uncertainty and lacks statistical efficiency.
To test the accuracy of the 95% credible intervals produced by (a) DTA, (b) MTT and (c) BASTA, we simulated and analysed 100 datasets under the two-population “Continental” model with even sampling of 100 individuals per subpopulation. We provided the true genealogy to BEAST2, as if it were estimated without error; in this scenario methods are expected to give the best accuracy. The migration rates between the subpopulations were simulated for each dataset from a prior distribution, and we compared the “true” ratio f 1,2/f 2,1 (horizontal axis) to the point estimate (posterior median; vertical axis, points) and 95% credible interval (2.5 and 97.5 percentiles; error bars). The results show a weak correlation between the truth and the point estimates for DTA, compared to MTT and BASTA, indicating poor statistical efficiency. The percentage of datasets in which the 95% credible intervals contained the truth revealed that DTA was poorly calibrated compared to MTT, BASTA and the theoretical target of 95%. The mean migration rate was high (f=5.0). The dashed line indicates the hypothetical optimal estimate. Number of MCMC steps for DTA, MTT and BASTA are respectively 106, 2 × 10⁵ and 105 so to achieve similar running times (respectively approximately 180, 200 and 150 seconds per replicate).
Fig 4
Fig 4. The structured coalescent improves reconstruction of ancestral subpopulations.
We measured the accuracy with which ancestral subpopulations were inferred for the root (most recent common ancestor) of the genealogy using (a) DTA, (b) MTT and (c) BASTA. Each bar represents the posterior probability of the true root subpopulation (which was recorded during simulation) for an individual replicate, so taller bars represent better inference. Each bar plot is labelled with the percentage of replicates for which the point estimate was correct. Simulations were performed with two subpopulations, fixed trees, high migration rates (mean f=5.0), and even sampling (100 samples per subpopulation). For each sampling strategy we simulated 100 replicates, which we ordered horizontally by posterior probability of the true root subpopulation. Number of MCMC steps for DTA, MTT and BASTA were respectively 106, 2 × 10⁵ and 105 so to achieve similar running times (respectively approximately 180, 200 and 150 seconds per replicate).
Fig 5
Fig 5. Inference of ancestral host species on the AIV dataset.
Maximum clade credibility trees inferred from the AIV dataset using (a) DTA and (b) BASTA. Branch colors, as from legend, mark the inferred location at the node at the bottom of the branch, while branch width represents the posterior confidence of the inference. Although DTA and BASTA give similar inferred ancestral hosts, their interpretations are different: DTA places total confidence for most ancestral nodes, while BASTA shows very large uncertainty. Pie charts show the posterior distribution of locations inferred at two internal nodes. The scale of the axis is in number of years from present.
Fig 6
Fig 6. Inference of ancestral locations on the TYLCV dataset.
Maximum clade credibility trees inferred from the AIV dataset using (a) DTA and (b) BASTA. Branch colors, as from legend, mark the inferred location at the node at the bottom of the branch, while branch width represents the posterior confidence of the inference. Here DTA and BASTA give again opposite interpretations: while DTA infer ancestral locations with extreme confidence, for BASTA at the same nodes all locations are equally likely. Pie charts show the posterior distribution of locations inferred at three internal nodes. The scale of the axis is in number of years from present.
Fig 7
Fig 7. Reconstructed history of zoonosis in Ebola virus is strongly affected by the method.
We reconstructed the transmission history of Ebola virus from an animal reservoir to humans using (a) DTA and (b) BASTA. Branches of the genealogy are coloured to indicate the reconstructed host species of ancestral lineages: humans (red) or bat reservoir (blue). Transitions from blue to red indicate zoonosis from an animal reservoir to humans. In the BASTA analysis, each human outbreak is precipitated by a zoonosis, whereas in the DTA analysis, no zoonosis is inferred, wrongly suggesting that the virus has persisted through undetected human-to-human transmission over the last 40 years. Branch width represents the posterior confidence on the inferred location at the node at the bottom of the branch. Pie charts (all with a single element in this stance) show the posterior distribution of locations inferred at two internal nodes.

Similar articles

Cited by

References

    1. Bloomquist EW, Lemey P, Suchard MA (2010) Three roads diverged? routes to phylogeographic inference. Trends Ecol Evol 25: 626–632. 10.1016/j.tree.2010.08.010 - DOI - PMC - PubMed
    1. Hudson RR, et al. (1990) Gene genealogies and the coalescent process. Oxford surveys in evolutionary biology 7: 44.
    1. Notohara M (1990) The coalescent and the genealogical process in geographically structured population. J Math Biol 29: 59–75. 10.1007/BF00173909 - DOI - PubMed
    1. Templeton AR, Boerwinkle E, Sing CF (1987) A cladistic analysis of phenotypic associations with haplotypes inferred from restriction endonuclease mapping. i. basic theory and an analysis of alcohol dehydrogenase activity in drosophila. Genetics 117: 343–351. - PMC - PubMed
    1. Templeton AR, Sing CF (1993) A cladistic analysis of phenotypic associations with haplotypes inferred from restriction endonuclease mapping. iv. nested analyses with cladogram uncertainty and recombination. Genetics 134: 659–669. - PMC - PubMed

Publication types

MeSH terms