. 2015 Aug 12;9(8):e0003822.
doi: 10.1371/journal.pntd.0003822. eCollection 2015.

Tsetse Control and Gambian Sleeping Sickness; Implications for Control Strategy

Affiliations

Tsetse Control and Gambian Sleeping Sickness; Implications for Control Strategy

Inaki Tirados et al. PLoS Negl Trop Dis. .

Abstract

Background: Gambian sleeping sickness (human African trypanosomiasis, HAT) outbreaks are brought under control by case detection and treatment although it is recognised that this typically only reaches about 75% of the population. Vector control is capable of completely interrupting HAT transmission but is not used because it is considered too expensive and difficult to organise in resource-poor settings. We conducted a full scale field trial of a refined vector control technology to determine its utility in control of Gambian HAT.

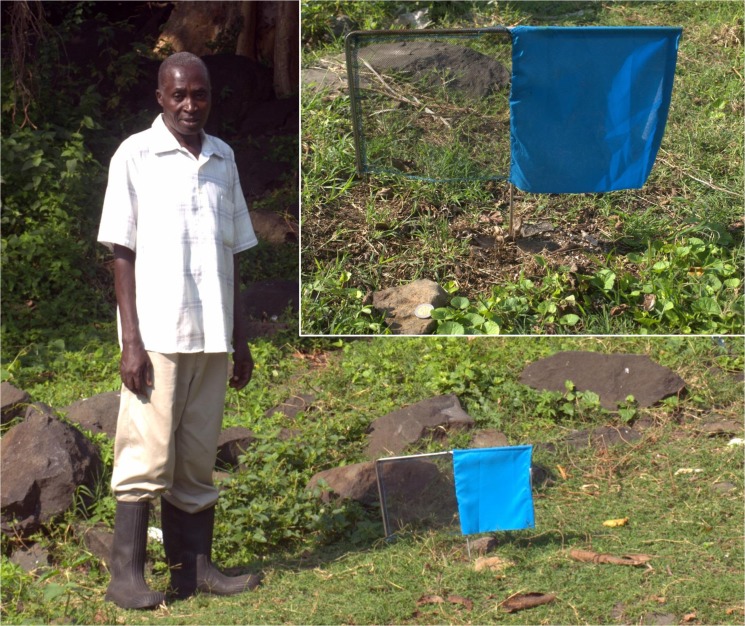
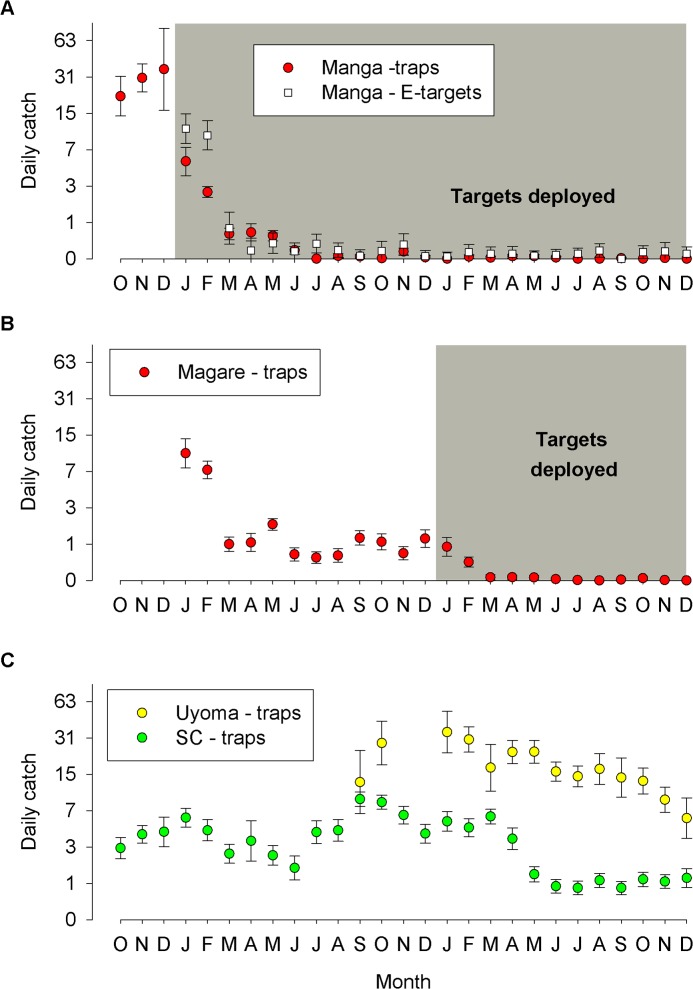
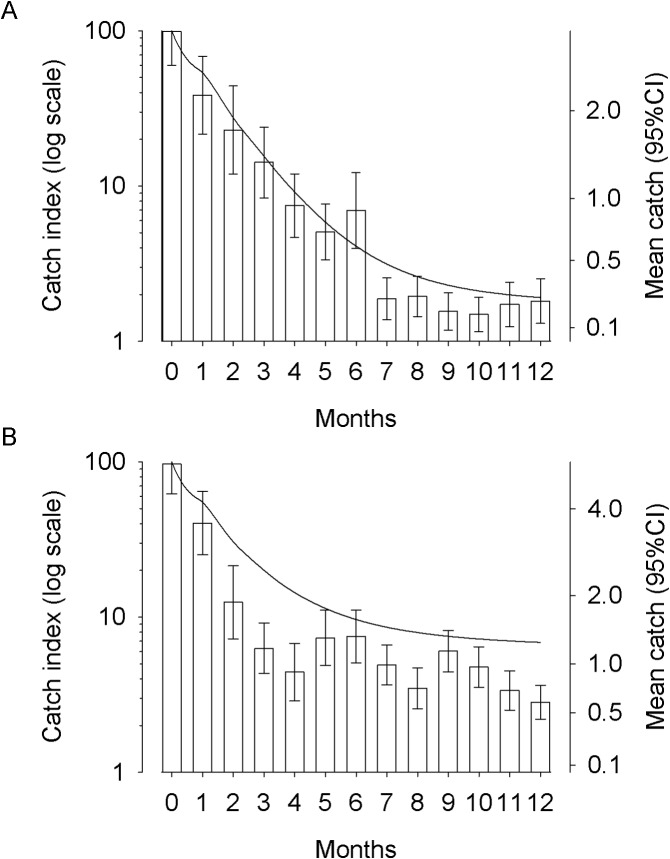
Methods and findings: The major vector of Gambian HAT is the tsetse fly Glossina fuscipes which lives in the humid zone immediately adjacent to water bodies. From a series of preliminary trials we determined the number of tiny targets required to reduce G. fuscipes populations by more than 90%. Using these data for model calibration we predicted we needed a target density of 20 per linear km of river in riverine savannah to achieve >90% tsetse control. We then carried out a full scale, 500 km2 field trial covering two HAT foci in Northern Uganda to determine the efficacy of tiny targets (overall target density 5.7/km2). In 12 months, tsetse populations declined by more than 90%. As a guide we used a published HAT transmission model and calculated that a 72% reduction in tsetse population is required to stop transmission in those settings.

Interpretation: The Ugandan census suggests population density in the HAT foci is approximately 500 per km2. The estimated cost for a single round of active case detection (excluding treatment), covering 80% of the population, is US$433,333 (WHO figures). One year of vector control organised within the country, which can completely stop HAT transmission, would cost US$42,700. The case for adding this method of vector control to case detection and treatment is strong. We outline how such a component could be organised.


Conflict of interest statement

The authors have declared that no competing interests exist.

Figures

Fig 1
Fig 1. A tiny target deployed near the lakeshore for control of G. f. fuscipes on Big Chamaunga island, Kenya.
Fig 2
Fig 2. Locations of traps and tiny targets in NW Uganda.
(A) Locations of monitoring traps for each intervention block (7 x 7 km squares) and rivers referred to in text (Enyau, Oluffe and Kochi). (B) Locations of targets (brown sections of rivers) within the five intervention blocks in 2013 (Ku = Kubala, Ay = Ayi, Ai = Aiivu, In = Inve, Ar = Arua). (C) Location of targets during the second phase of the trial; grey-coloured polygon denotes the extent of the operational area during Phase 2.
Fig 3
Fig 3. Mean daily catch (±95%CI) of tsetse from (A) traps, (B) E-targets and (C) flyrounds on islands with or without targets.
Grey area indicates months when target were present on Big Chamaunga (BC); no targets deployed on Small Chamaunga (SC). Traps were operated before (Jan-May 2011) and after (June 2011 onwards) targets were deployed. E-targets (June 2011 onwards) and flyrounds (September 2011 onwards) were operated only after targets were deployed.
Fig 4
Fig 4. Mean daily catches of tsetse (±95%CI) from (A, B) sites where targets were present or (C) absent.
Grey areas denote when targets were present on the islands of Manga and Magare. No targets were deployed on the island of Small Chamaunga (SC) or the mainland site of Uyoma (U). Sampling was carried out between October 2011 and November 2013.
Fig 5
Fig 5. A. Predicted decline in a tsetse population over 12 months assuming imposed mortalities of 1–8%/day and (B) observed decline over six months on islands where tiny targets were deployed.
A. For graph A, predicted declines were generated using the simulation model Tsetse Muse. For graph B, the Catch Index is the mean daily catch (+LSD) from traps for each month post-deployment of targets (Months 1–6) expressed as a percentage of the mean catch for the three months prior to deployment (Month 0). The pre-deployment mean catches were 3.1 (2.76–3.48, 95%CI) for Big Chamaunga, 28.2 (22.44–35.31) for Manga and 0.9 (0.79–1.12) for Magare. Lines show declines predicted over six months assuming imposed daily mortalities of 3–6%.
Fig 6
Fig 6. Daily mean catch (±95%CI) from traps operated in areas where tiny targets were present or absent (Koboko only) from November onwards.
Fig 7
Fig 7. Catch of tsetse from traps at Centre or Edge of Phase 1 blocks.
Mean daily catches from traps (±95%CI) at the Centre or Edge of an intervention block; data pooled for all intervention blocks.
Fig 8
Fig 8. Predicted (lines, left y-axis) and observed (bars, right y-axis) decline in catch for (A) centre and (B) edge traps following deployment of targets in the small blocks.
Fig 9
Fig 9. Predicted effect of targets on relative densities of tsetse.
(A) Predicted density of tsetse from Centre and Edge positions following expansion of operational area from 7km (Phase 1) to 21km (Phase 2). (B) Rebound of tsetse at Centre following removal of targets or reduction in mortality imposed. (C) Relative density of tsetse along simulated river at the completion of Phases 1(P1) and 2 (P2) and rebound in tsetse when target density is reduced (P3) or targets are removed.
Fig 10
Fig 10. Relationship between Ro (y-axis) and numbers of tsetse (x-axis) for settings where the average infectious period is 1–4 years.
To obtain an estimate of the level of tsetse control required to stop transmission we have re-arranged a published model [10]. The average infectious period is usually accepted as 3 years and so we can see that a reduction in tsetse numbers of approximately 72% is required to drive R0<1.

References

    1. Simarro PP, Diarra A, Postigo JAR, Franco JR, Jannin JG (2011) The Human African Trypanosomiasis Control and Surveillance Programme of the World Health Organization 2000–2009: The Way Forward. PLoS Negl Trop Dis 5. - PMC - PubMed
    1. Welburn SC, Maudlin I, Simarro PP (2009) Controlling sleeping sickness—a review. Parasitology 136: 1943–1949. 10.1017/S0031182009006416 - DOI - PubMed
    1. Brun R, Blum J, Chappuis F, Burri C (2010) Human African trypanosomiasis. Lancet 375: 148–159. 10.1016/S0140-6736(09)60829-1 - DOI - PubMed
    1. W.H.O. (1998) Control and surveillance of African trypanosomiasis. Report of a WHO Expert Committee. Technical Report Series 881. Geneva: World Health Organization. - PubMed
    1. W.H.O. (2013) Report of a WHO meeting on elimination of African trypanosomiasis (Trypanosoma brucei gambiense). WHO/HTM/NTD/IDM/2013.4:.

Publication types

MeSH terms