. 2015 Aug 13;524(7564):220-4.
doi: 10.1038/nature14668.

The octopus genome and the evolution of cephalopod neural and morphological novelties

Affiliations

The octopus genome and the evolution of cephalopod neural and morphological novelties

Caroline B Albertin et al. Nature. .

Abstract

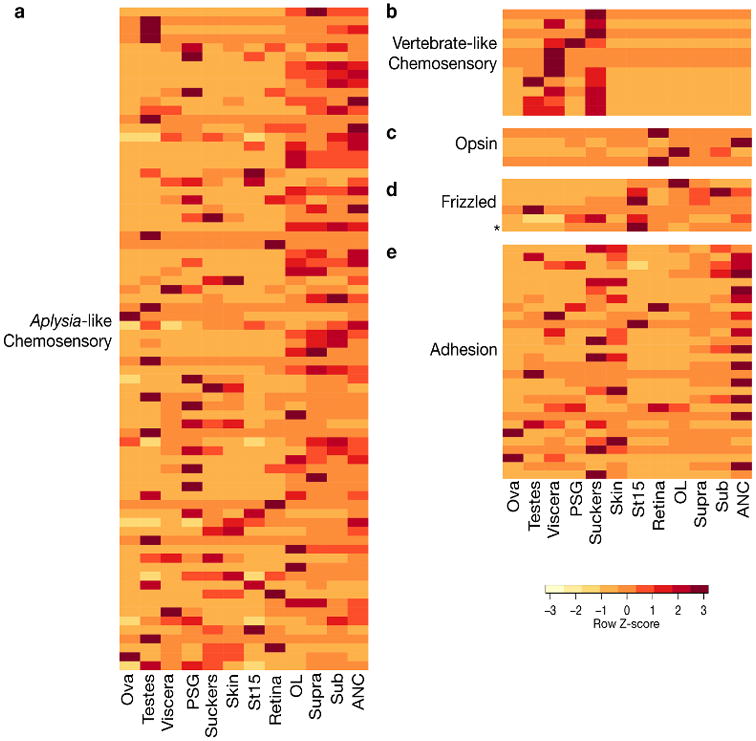
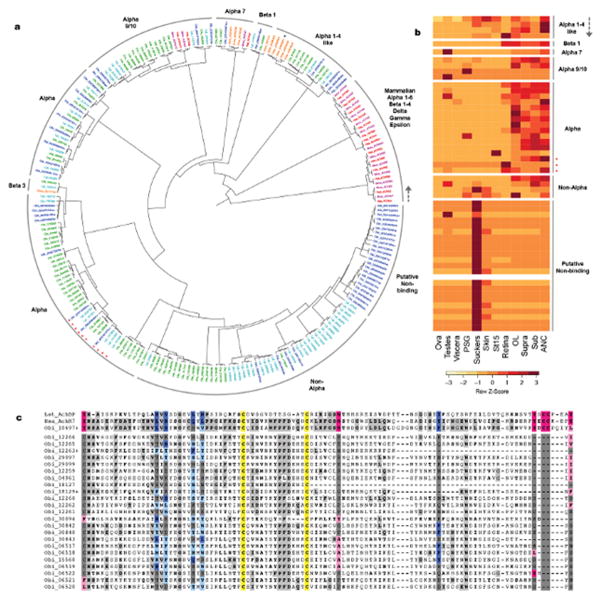
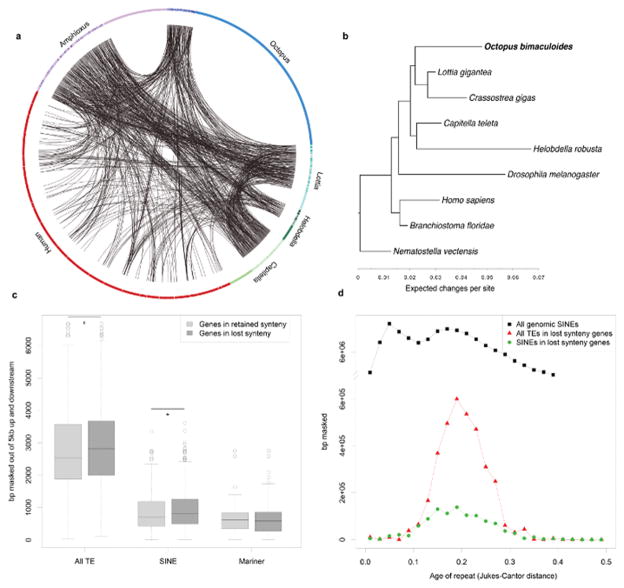
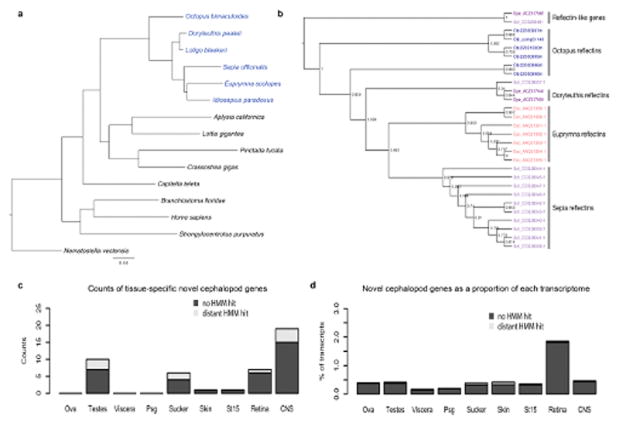
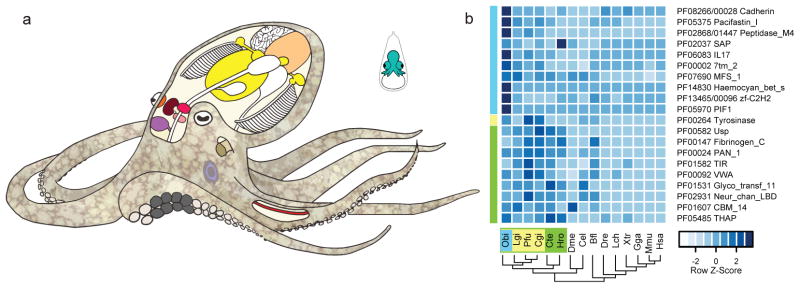
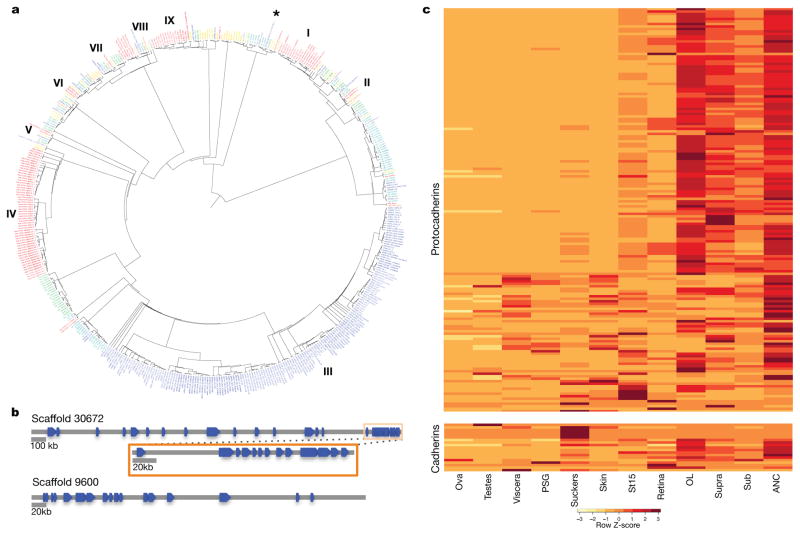
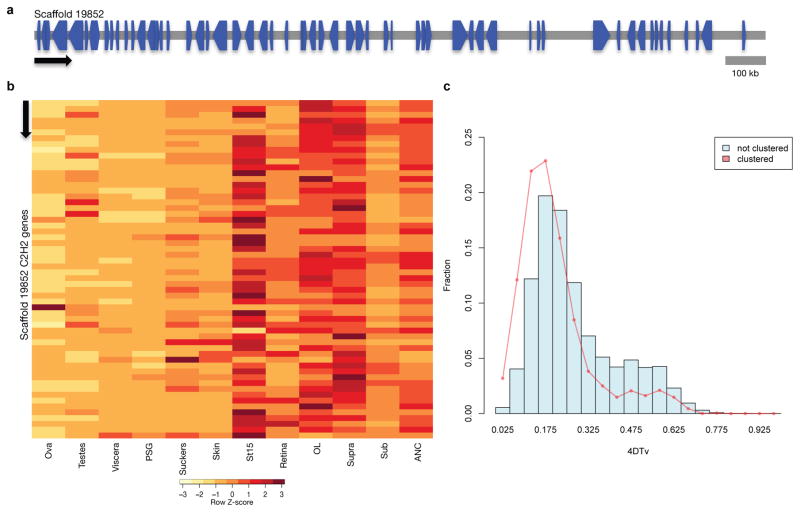
Coleoid cephalopods (octopus, squid and cuttlefish) are active, resourceful predators with a rich behavioural repertoire. They have the largest nervous systems among the invertebrates and present other striking morphological innovations including camera-like eyes, prehensile arms, a highly derived early embryogenesis and a remarkably sophisticated adaptive colouration system. To investigate the molecular bases of cephalopod brain and body innovations, we sequenced the genome and multiple transcriptomes of the California two-spot octopus, Octopus bimaculoides. We found no evidence for hypothesized whole-genome duplications in the octopus lineage. The core developmental and neuronal gene repertoire of the octopus is broadly similar to that found across invertebrate bilaterians, except for massive expansions in two gene families previously thought to be uniquely enlarged in vertebrates: the protocadherins, which regulate neuronal development, and the C2H2 superfamily of zinc-finger transcription factors. Extensive messenger RNA editing generates transcript and protein diversity in genes involved in neural excitability, as previously described, as well as in genes participating in a broad range of other cellular functions. We identified hundreds of cephalopod-specific genes, many of which showed elevated expression levels in such specialized structures as the skin, the suckers and the nervous system. Finally, we found evidence for large-scale genomic rearrangements that are closely associated with transposable element expansions. Our analysis suggests that substantial expansion of a handful of gene families, along with extensive remodelling of genome linkage and repetitive content, played a critical role in the evolution of cephalopod morphological innovations, including their large and complex nervous systems.


Conflict of interest statement

Competing financial interests

The authors declare no competing financial interests

Figures

Extended Data Figure 1
Extended Data Figure 1. RNA editing in octopus
a, Approximate maximum likelihood tree of adenosine deaminases acting on RNA (ADARs) in bilaterians. ADAR1, ADAR2, ADAR-like/ADAD, and ADAT (t-RNA specific adenosine deaminase) were identified in Hsa, Mmu, Cin, Dme, Cte, Lgi, D. opalescens (Dop), and Obi with Shimodaira-Hasegawa-like support indicated at the nodes. b, O. bimaculoides ADAR1, ADAR2 and ADAR-like proteins contain one or two double-stranded RNA binding domains (dsRBD) as well as an adenosine deaminase domain. ADAR1 also has a z-alpha domain. c, Expression profiles of the three ADAR genes found in 12 O. bimaculoides tissues by RNA-Seq profiling. d, DNA-RNA differences in O. bimaculoides show prominent A-to-G changes. Histogram illustrates the number of DNA-RNA differences detected between coding sequences in the genome and 12 O. bimaculoides transcriptomes after filtering out polymorphisms identified in genomic sequencing. Differences were binned by the type of change (see key) in the direction of transcription. A-to-G changes are the most prevalent, particularly in neural tissues and during development, paralleling the expression of octopus ADARs in c. Other types of changes were also detected at lower levels, possibly resulting from uncharacterized polymorphisms.
Extended Data Figure 2
Extended Data Figure 2. Local arrangement of Hox gene complement in O. bimaculoides and selected bilaterians
At the top, the four compact Hox clusters of H. sapiens and the single B. floridae cluster are depicted. The D. melanogaster Hox complex is split into two clusters. We included genes in the D. melanogaster locus that are homologues of Hox genes but have lost their homeotic function, such as fushi tarazu (ftz), bicoid, zen and zen2 (the latter three are represented as overlapping boxes). Hox genes in C. teleta are found on three scaffolds. L. gigantea has a single cluster with the full known lophotrochozoan gene complement. In O. bimaculoides many of the scaffolds are several hundred kb long, and no two Hox genes are on the same scaffold. The positions of O. bimaculoides genes approximate their locations on scaffolds. Dashed lines indicate that the scaffold continues beyond what is shown. Scaffold length is depicted to scale with size noted on the left. Genes are positioned to illustrate orthology, which is also highlighted by color.
Extended Data Figure 3
Extended Data Figure 3. Gene complement and gene architecture evolution in metazoans
a, Principal component analysis of gene family counts. O. bimaculoides highlighted in green. Deuterostomes are indicated in blue, ecdysozoans in red, lophotrochozoans in green, and sponges and cnidarians in orange. Xtr: Xenopus tropicalis, Gga: Gallus gallus, Tca: Tribolium castaneum, Dpu: Daphnia pulex, Isc: Ixodes scapularis, Ava: Adineta vaga, Spu: S. purpuratus, Hma: Hydra magnipapillata, Adi: Acropora digitifera. For methods, see Supplementary Note 7.4. b–d, MrBayes tree (constrained topology) on binary characters of presence or absence of Pfam domain architectures (b), introns (c), or indels (d); scale bar represents estimated changes per site. For methods, see Supplementary Note 7.3.
Extended Data Figure 4
Extended Data Figure 4. Protocadherin genes within a genomic cluster are similar in sequence and sites of expression
a, Expression profile of the 31 protocadherin genes located on Scaffold 30672 in 12 octopus transcriptomes. Over three-quarters of the protocadherins are highly expressed throughout central brain, OL, and ANC, while the others show more mixed distributions. b, Phylogenetic tree highlighting Scaffold 30672 protocadherins in grey bars. c, Expression profile of the 17 protocadherin genes located on Scaffold 9600. Almost all of these protocadherins are most highly expressed in nervous tissues, with the exception of Ocbimv220039316m, which is most highly expressed in the St15 sample. d, Phylogenetic tree highlighting Scaffold 9600 protocadherins in grey bars. As seen in b, protocadherins of the same scaffold tend to cluster together on the tree. Order of the genes in the heatmaps (a, c) follows the ordering on the corresponding scaffold.
Extended Data Figure 5
Extended Data Figure 5. Expansion of Interleukin (IL) 17-like genes
a, Phylogenetic tree of interleukin genes in Obi, Cte, Cgi, and Lgi. Mammalian IL1a, IL1b, and IL7 used as outgroups. Human and mouse IL17s branch from other members of the IL family. Octopus ILs (as well as all identified invertebrate ILs) group with the mammalian IL17 branch and are named “IL17-like”. The 31 octopus genes are distributed across 5 scaffolds: Scaffold A (Obi_A), 23 members; Scaffold B (Obi_B), 4 members; Scaffold C (Obi_C), 2 members; Scaffolds D (Obi_D) and E (Obi_E), 1 member each. b, Expression profile of 31 octopus IL17-like genes. Heatmap rows are arranged by order on each scaffold. Blank rows indicate genes not expressed in our transcriptomes. The 27 genes found in our transcriptomes have strong expression in the suckers and skin. The Scaffold C genes are enriched in the PSG and the Scaffold D gene is enriched in the viscera. c, Conserved cysteine residues in human IL17 and invertebrate IL17-like proteins. The human IL17 proteins share a conserved cysteine motif comprising 4 cysteine residues, which may form interchain disulfide bonds and facilitate dimerization. Octopus IL17-like proteins also contain this 4-cysteine motif, highlighted in yellow. One octopus sequence encodes only 3 of these highly conserved cysteine residues. These four cysteines are also present to varying degrees in Lottia, Capitella, and Crassostrea sequences. Two additional conserved cysteine residues were found in the octopus sequences and are highlighted in red. The first cysteine residue is found in all invertebrate sequences examined, and none of the mammalian IL17 sequences.
Extended Data Figure 6
Extended Data Figure 6. G protein-coupled receptors
GPCRs, also known as 7-transmembrane (7TM) or serpentine receptors, form a large superfamily that activates intracellular second messenger systems upon ligand binding. This figure considers a subset of the 329 GPCRs we identified in O. bimaculoides. The full complement of GPCRs is presented in Supplementary Note 8.5. a and b, As reported for other lophotrochozoan genomes, the octopus genome contains chemosensory-like GPCRs: 74 GPCRs are similar to the Aplysia chemosensory GPCRs and 11 GPCRs are similar to vertebrate olfactory receptors. c, We identified 4 opsins in the octopus genome (from top to bottom): rhodopsin, rhabdomeric opsin, peropsin, and retinochrome. d, The octopus Class F GPCRs comprises 6 genes: 5 Frizzled genes and 1 Smoothened gene (*). e, Thirty octopus genes show similarity to vertebrate adhesion GPCRs.
Extended Data Figure 7
Extended Data Figure 7. O. bimaculoides acetylcholine receptor (AchR) subunits
a, Phylogenetic tree of AchR subunit genes identified in Hsa, Mmu, Dme, Cte, Lgi, and Obi. Black asterisk indicates a Dme sequence that groups with alpha 1-4-like subunits despite lacking two defining cysteine residues. b, Expression profiles of octopus AchR subunits. Genes ordered as in the tree (a), starting from the gray arrow and continuing counterclockwise. Putative non-Ach binding subunits are highly expressed in the suckers. One sequence was not detected in our transcriptome datasets. In a and b, red asterisks indicate subunits with the substitution known to confer anionic permissivity. c, Divergent octopus subunits lack nearly all residues necessary for Ach binding. Alignment of sequence flanking the cysteine loop (yellow) of the L. stagnalis Ach binding protein (Lst_AchBP), the human and octopus alpha-7 receptor subunits (Has_AchR7, Obi_10697+), and the 23 divergent AchR subunits. Essential Ach-binding residues on the primary (pink) and complementary (blue) side of the ligand-binding domain are indicated, with conservative substitutions in a lighter shade. Outside of the binding residues, residues shared between the alpha 7 subunits are shaded in light grey, with bold letters for conservative substitutions.
Extended Data Figure 8
Extended Data Figure 8. Active transposable elements and gene expression specificity
a, Transposable element expression across 12 tissues. b, Correlation between the total TE load (in bp) in the 5kb regions flanking the gene and the fraction of genes with tissue-specific expression (defined as having at least 75% of expression in a single tissue; Source Data: TELoadAndTissueExpression.xls). p-value indicates F-statistic for the significance of linear regression (H0: r-squared=0), with tissues with a p-value ≤ 0.05 indicated in pink.
Extended Data Figure 9
Extended Data Figure 9. Synteny dynamics in octopus and the effect of transposable element (TE) expansions
a, Circos plot showing shared synteny across 6 genomes. Individual scaffolds are plotted according to bp length; scaffolds with no synteny are merged together (lighter arcs). Despite the large size of the octopus genome, only a small proportion of the scaffolds show synteny. b, Synteny reduction in octopus quantified based on synteny inference using gene families with at least one representative in human, amphioxus, Capitella, Helobdella, Octopus, Lottia, Crassostrea, Drosophila, and Nematostella. Drosophila, Helobdella, and Octopus show the highest synteny loss rates. Branch lengths, estimated with MrBayes, reflect extent of local genome rearrangement (Supplementary Note 6). c, Enrichment of overall and specific TE classes (base pairs masked) around genes from ancient bilaterian synteny blocks, including those absent in octopus (see key). Asterisks indicates Mann-Whitney U test with p-value < 0.02. d, Transposable element insertion history (Jukes-Cantor distance adjusted, see text) into the vicinity of genes from ‘lost’ synteny blocks. Notice that only one SINE peak is present; a more recent peak (visible in “All genomic SINEs”) cannot be recovered from those insertions.
Extended Data Figure 10
Extended Data Figure 10. Cephalopod phylogeny and novelties
a, Whole-genome-derived phylogeny of molluscs and select other phyla showing the relative position of octopus at the base of the coleoid cephalopods. For methods see Supplementary Note 7.1. Members of the cephalopod class are indicated in blue, scale indicates number of substitutions per site. b, Phylogenetic tree of reflectin genes. Reflectins are cephalopod-specific genes that allow for rapid and reversible changes in iridescence. Six reflectin genes were identified in the octopus genome. c and d, Novel gene expression across multiple tissues. Bars depict all cephalopod novelties; dark grey indicates sequences with no similarity to non-cephalopod genes using HMM searches (Source Data: CephalopodNovelties.xls). c, Counts of tissue-specific novelties in a given tissue. d, Proportion of expression of novel genes versus total expression in individual tissues. CNS (central nervous system) combines Supra, Sub, OL and ANC expression data.
Figure 1
Figure 1. Octopus anatomy and gene family representation analysis
a, Schematic of Octopus bimaculoides anatomy, highlighting the tissues sampled for transcriptome analysis: viscera (heart, kidney, and hepatopancreas), yellow; gonads (ova or testes), peach; retina, orange; optic lobe (OL), maroon; supraesophageal brain (Supra), bright pink; subesophageal brain (Sub), light pink; posterior salivary gland (PSG), purple; axial nerve cord (ANC), red; suckers, grey; skin, mottled brown; stage 15 (St15) embryo, aquamarine. Skin sampled for transcriptome analysis included the eyespot, shown in light blue. b, C2H2 and protocadherin domain-containing gene families are expanded in octopus. Enriched Pfam domains were identified in lophotrochozoans (green) and molluscs (yellow), including O. bimaculoides (light blue). For a domain to be labeled as expanded in a group, at least 50% of its associated gene families need a corrected p-value of 0.01 against the outgroup average. Some Pfams (e.g., Cadherin and Cadherin_2) may occur in the same gene, however multiple domains in a given gene were counted only once. Abbreviations used throughout: Obi: O. bimaculoides, Lgi: Lottia gigantea, Pfu: Pinctada fucata, Cgi: Crassostrea gigas, Aca: Aplysia californica, Cte: Capitella teleta, Hro: Helobdella robusta, Dme: Drosophila melanogaster, Cel: Caenorhabditis elegans, Bfl: Branchiostoma floridae, Dre: Danio rerio, Lch: Latimeria chalumnae, Xtr: Xenopus tropicalis, Gga: Gallus gallus, Mmu: Mus musculus, Hsa: Homo sapiens.
Figure 2
Figure 2. Protocadherin expansion in octopus
a, Phylogenetic tree of cadherin genes in Hsa (red), Dme (orange), Nematostella vectensis (Nve, mustard yellow), Amphimedon queenslandica (Aqu, yellow), Cte (green), Lgi (teal), Obi (blue), and Saccoglossus kowalevskii (Sko, purple). I, Type I classical cadherins; II, calsyntenins; III, octopus protocadherin expansion (168 genes); IV, human protocadherin expansion (58 genes); V, dachsous; VI, fat-like; VII, fat; VIII, CELSR; IX, Type II classical cadherins. Asterisk denotes a novel cadherin with over 80 extracellular cadherin domains found in Obi and Cte. b, Scaffold 30672 and Scaffold 9600 contain the two largest clusters of protocadherins, with 31 and 17, respectively. Clustered protocadherins vary greatly in genomic span and are oriented in head-to-tail fashion along each scaffold. c, Expression profiles of 161 protocadherins and 19 cadherins in 12 octopus tissues; 7 protocadherins were not detected in the tissues sampled. Cells are colored according to number of standard deviations from the mean expression level. Protocadherins have high expression in neural tissues. Cadherins generally show a similar expression pattern, with the exception of a group of sucker-specific cadherins.
Figure 3
Figure 3. C2H2-ZNF expansion in octopus
a, Genomic organization of the largest C2H2 cluster. Scaffold 19852 contains 58 C2H2 genes that are transcribed in different directions. b, Expression profile of C2H2 genes along Scaffold 19852 in 12 octopus transcriptomes. Neural and developmental transcriptomes show high levels of expression for a majority of these C2H2 genes. In a and b, arrow denotes scaffold orientation. c, Distribution of fourfold synonymous site transversion distance (4DTv) distances between C2H2 domain containing genes.

References

    1. Hanlon RT, Messenger JB. Cephalopod behaviour. Cambridge University Press; 1996.
    1. Young JZ. The anatomy of the nervous system of Octopus vulgaris. Clarendon Press; 1971.
    1. Wells MJ. Octopus: physiology and behaviour of an advanced invertebrate. Chapman and Hall; 1978.
    1. Bonnaud L, Ozouf-Costaz C, Boucher-Rodoni R. A molecular and karyological approach to the taxonomy of Nautilus. Comptes Rendus Biologies. 2004;327:133–138. doi: 10.1016/j.crvi.2003.12.004. - DOI - PubMed
    1. Hallinan NM, Lindberg DR. Comparative analysis of chromosome counts infers three paleopolyploidies in the mollusca. Genome biology and evolution. 2011;3:1150–1163. doi: 10.1093/gbe/evr087. - DOI - PMC - PubMed

Publication types

MeSH terms