. 2015 Aug 13:6:8024.
doi: 10.1038/ncomms9024.

p75(NTR)-dependent activation of NF-κB regulates microRNA-503 transcription and pericyte-endothelial crosstalk in diabetes after limb ischaemia

Affiliations

p75(NTR)-dependent activation of NF-κB regulates microRNA-503 transcription and pericyte-endothelial crosstalk in diabetes after limb ischaemia

Andrea Caporali et al. Nat Commun. .

Abstract

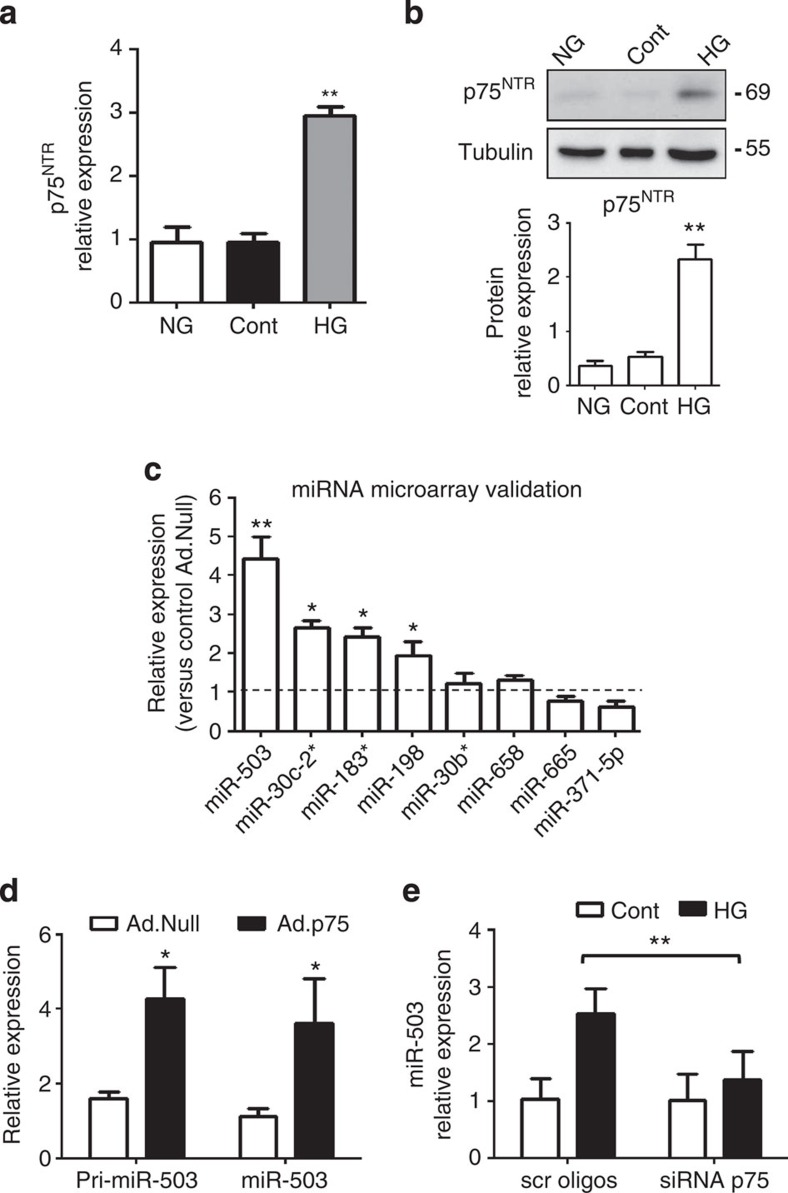
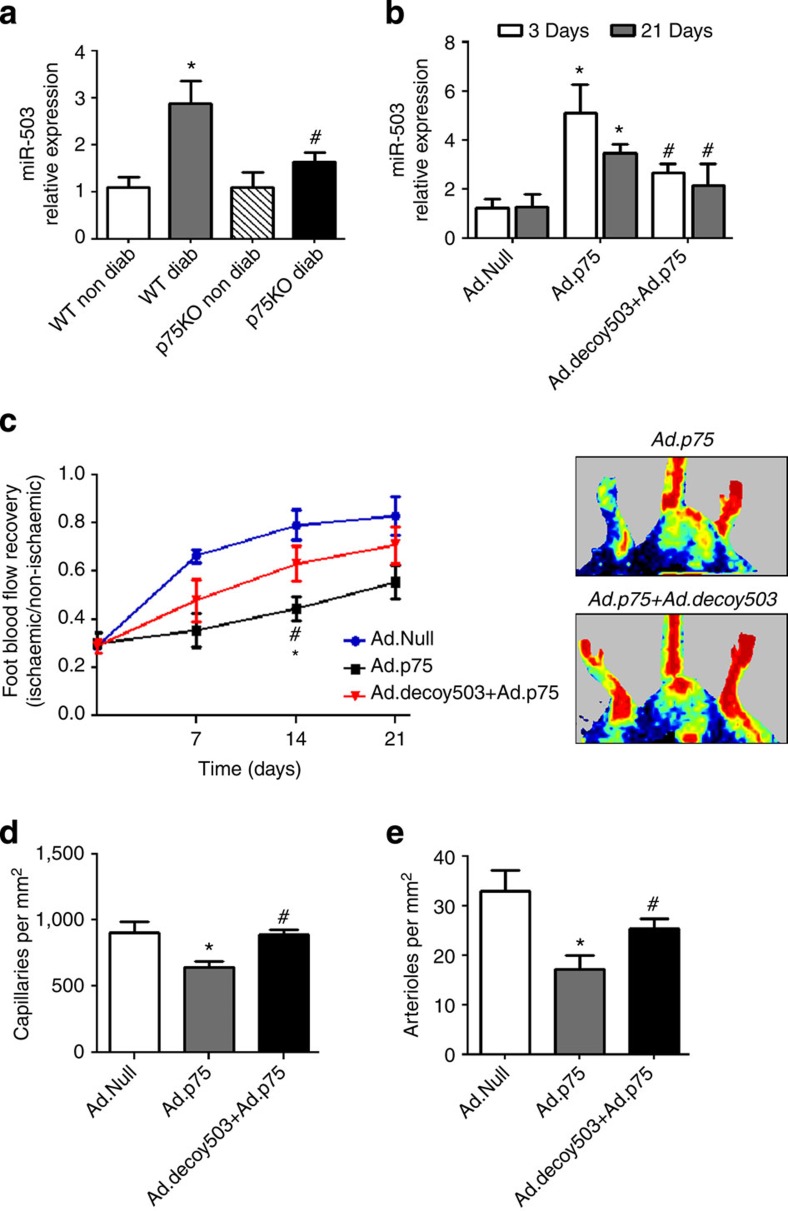
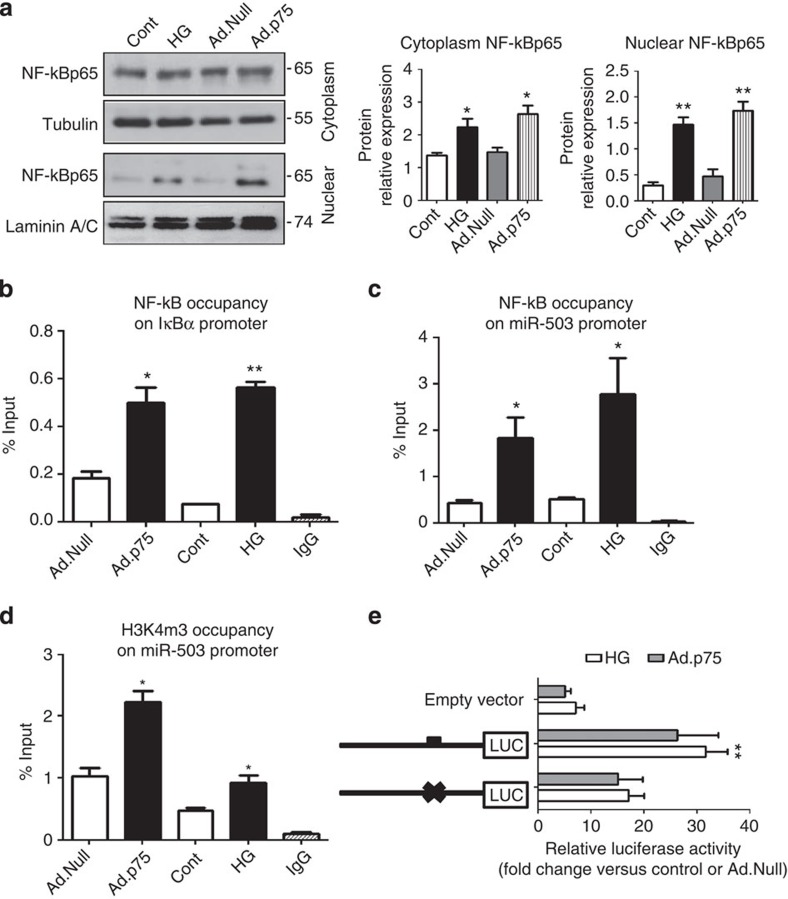
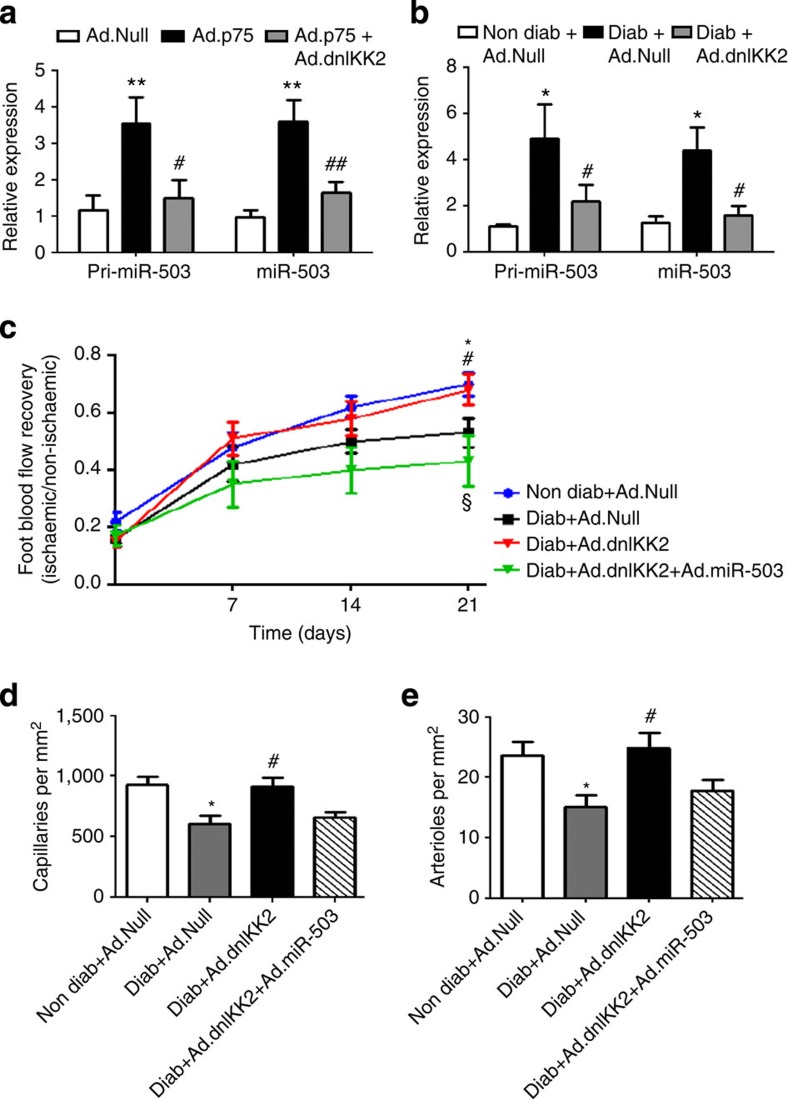
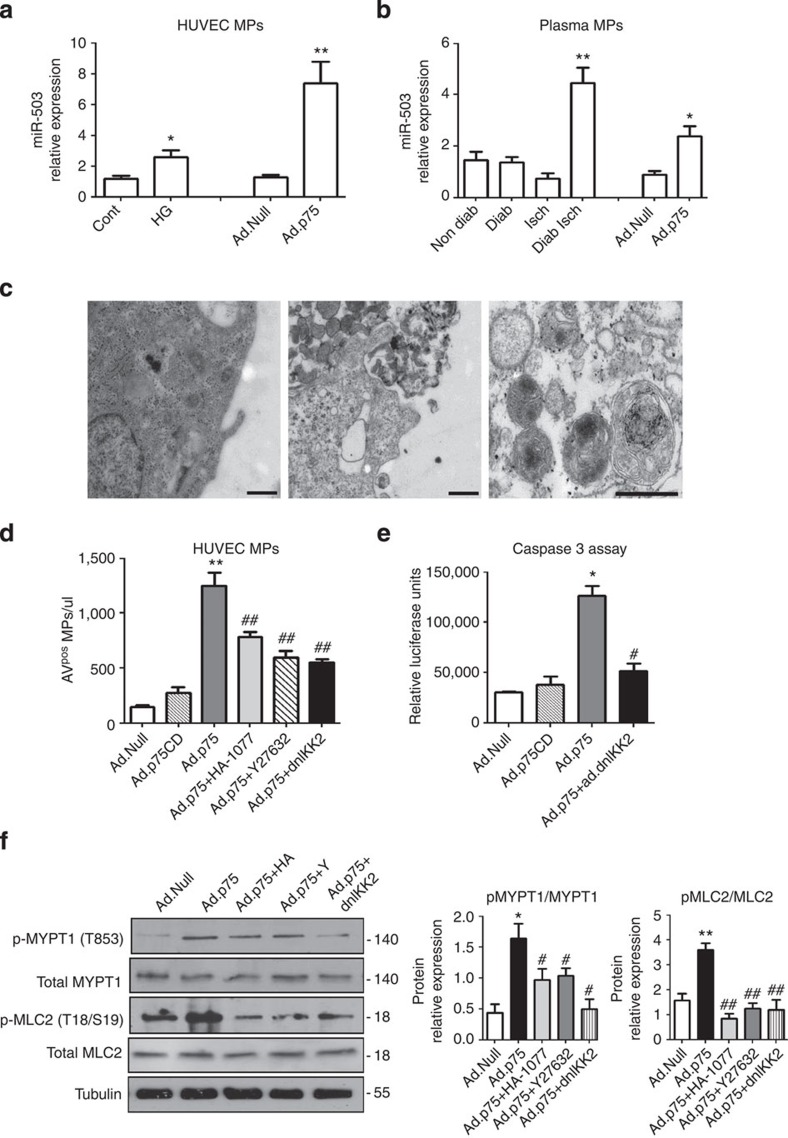
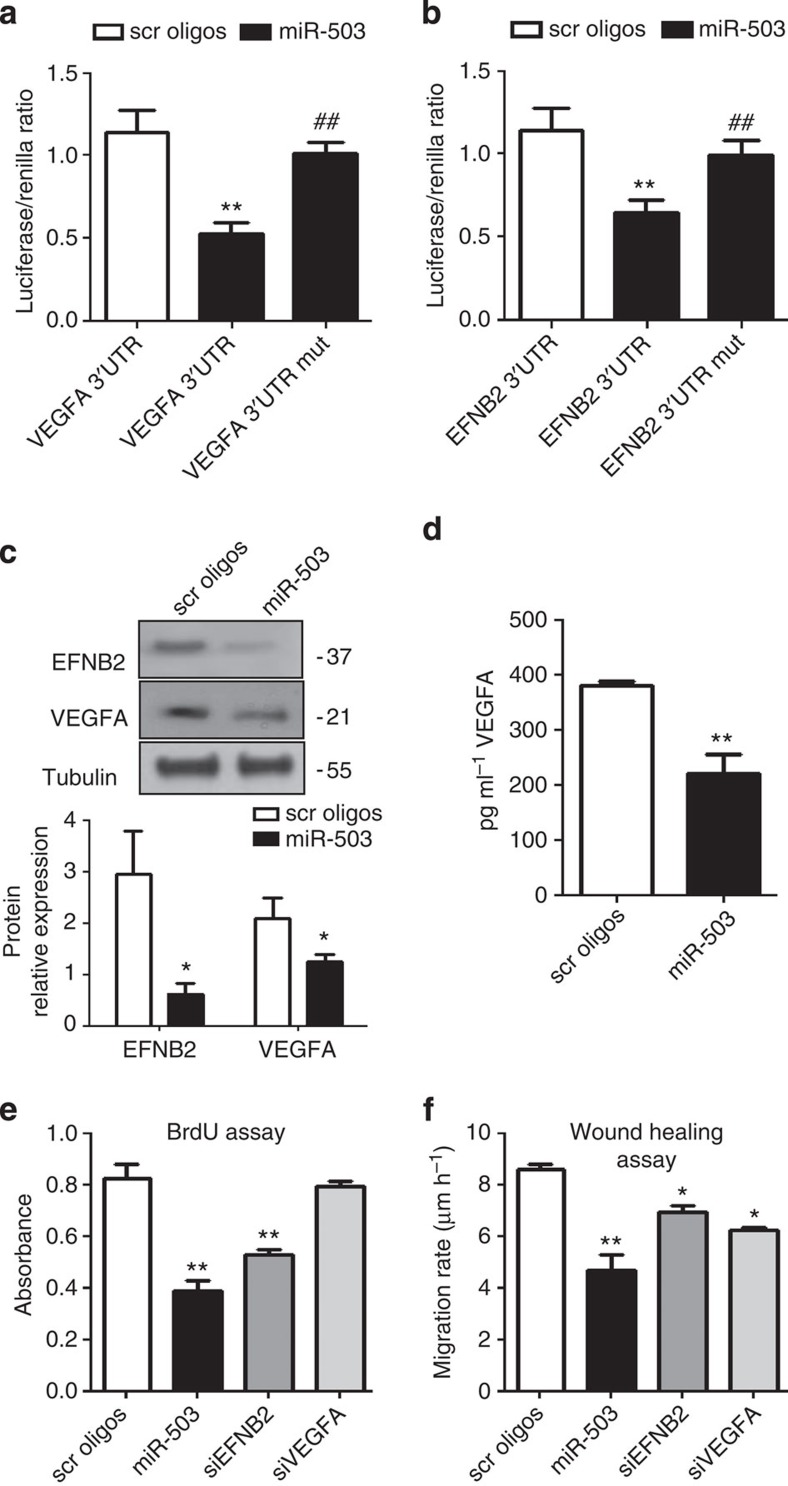
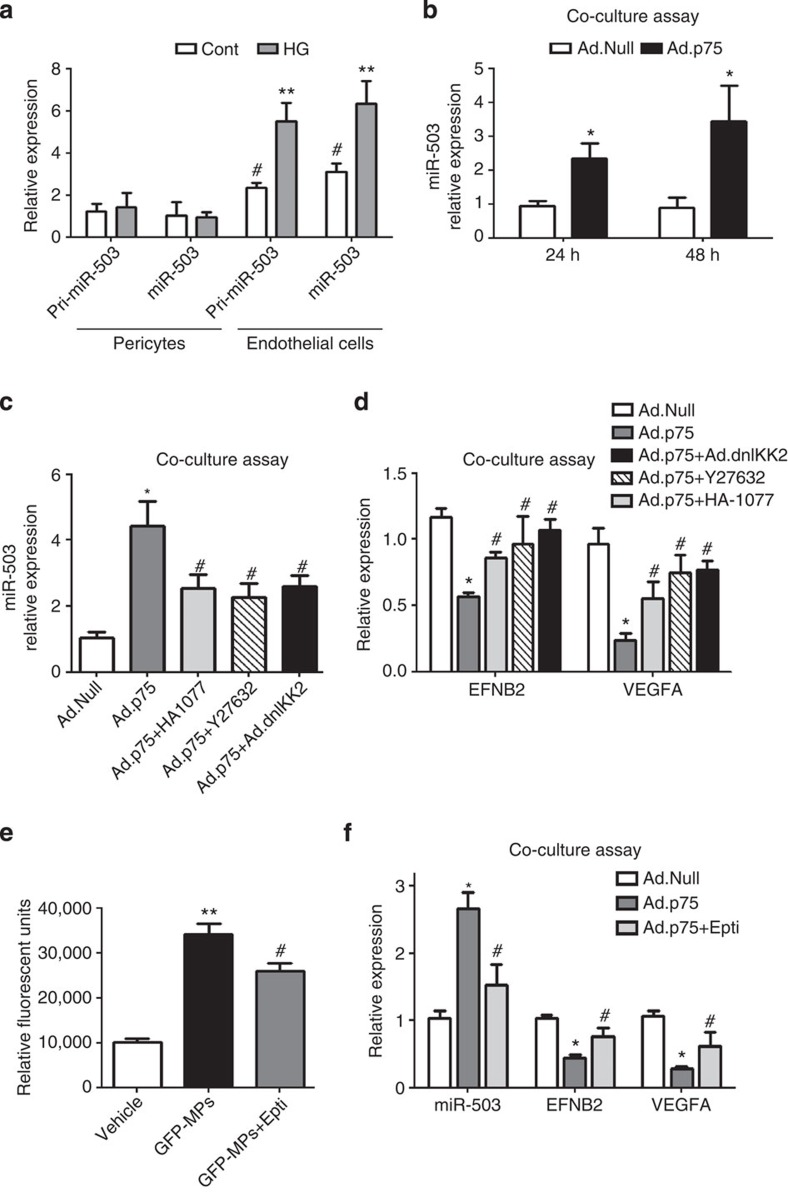
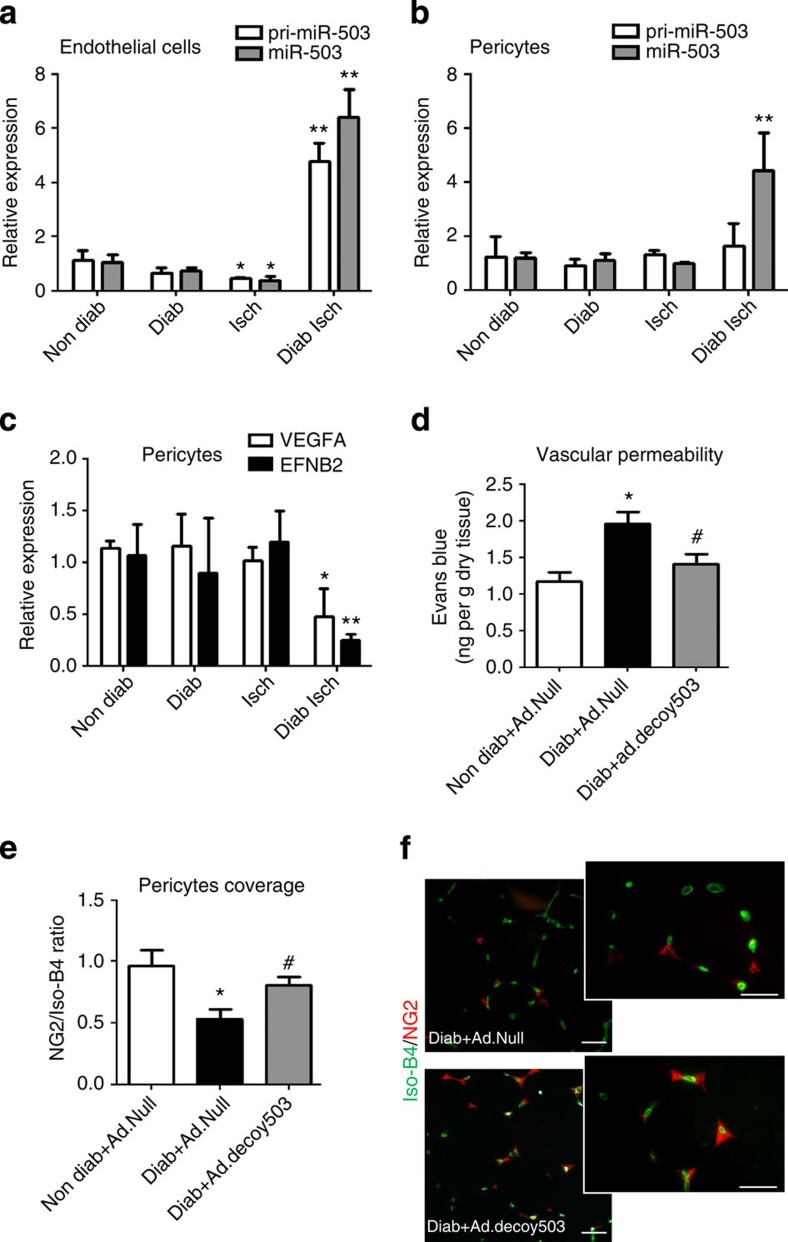
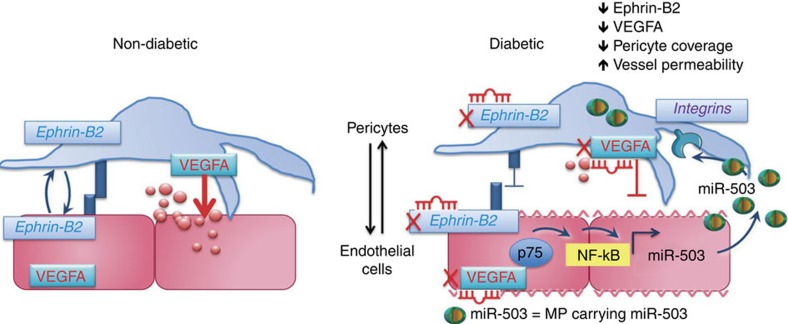
The communication between vascular endothelial cells (ECs) and pericytes in the microvasculature is fundamental for vascular growth and homeostasis; however, these processes are disrupted by diabetes. Here we show that modulation of p75(NTR) expression in ECs exposed to high glucose activates transcription of miR-503, which negatively affects pericyte function. p75(NTR) activates NF-κB to bind the miR-503 promoter and upregulate miR-503 expression in ECs. NF-κB further induces activation of Rho kinase and shedding of endothelial microparticles carrying miR-503, which transfer miR-503 from ECs to vascular pericytes. The integrin-mediated uptake of miR-503 in the recipient pericytes reduces expression of EFNB2 and VEGFA, resulting in impaired migration and proliferation. We confirm operation of the above mechanisms in mouse models of diabetes, in which EC-derived miR-503 reduces pericyte coverage of capillaries, increased permeability and impaired post-ischaemic angiogenesis in limb muscles. Collectively, our data demonstrate that miR-503 regulates pericyte-endothelial crosstalk in microvascular diabetic complications.


Figures

Figure 1
Figure 1. p75NTR regulates miR-503 expression.
(a) HUVECs were exposed to high glucose (HG), cultured in normal glucose (NG) or osmotic control (Cont; L-Glucose) conditions for 24 h, and p75NTR expression was analysed using qPCR. **P<0.01 versus NG or Cont (n=3). (b) Representative western blot images and protein quantification of p75NTR and Tubulin expression in total cell extracts. **P<0.01 versus NG or Cont (n=3). (c) Microarray data validation using qPCR. HUVECs were transduced with Ad.Null or Ad.p75 and qPCR was carried out to measure the expression of top-ranked miRNAs. (d) Expression of precursor and mature miR-503 for c,d; *P<0.05, **P<0.01 versus Ad.Null (n=3). (e) Relative expression of miR-503 in HUVECs transfected with scrambled oligos (scr oligos) or short interfering RNA (siRNA)-p75 oligos and then cultured in Cont or HG for 24 h. **P<0.01 (n=5). Unpaired two-tailed Student's t-test or Mann–Whitney nonparametric test was applied. Differences among groups were analysed using two-way analysis of variance followed by Bonferroni post hoc test. All values are mean±s.e.m. of three independent experiments.
Figure 2
Figure 2. In vivo regulation of miR-503 by p75NTR.
(a) Relative expression of miR-503 in ischaemic muscle (3 days post ischaemia) of diabetic and non-diabetic WT and p75KO mice (n=6 per group); *P<0.05 versus WT Non Diab; #P<0.05 versus WT Diab. (b) Relative expression of miR-503 in ischaemic adductors of non-diabetic mice injected with Ad.p75, Ad.Null or Ad.p75 and Ad.decoy503 together (n=6 per group). Ad.Null was also given to singly injected mice to equalize the virus quantity. (c) Line graph shows the time course of post-ischaemic foot blood flow recovery in mice (calculated as the ratio between ischaemic and contralateral foot blood flow; n=12 per group). Representative colour laser Doppler images are taken at 14 days post ischaemia. (d,e) Column graphs show capillary and small arteriole (diameter <50 μm) densities in ischaemic adductors of mice at 21 days post ischaemia (n=6 per group). For be, *P<0.05 versus Ad.Null; #P<0.05 versus Ad.p75. Unpaired two-tailed Student's t-test or Mann–Whitney nonparametric test was applied. All values are mean±s.e.m. of three independent experiments.
Figure 3
Figure 3. NF-κB p65 binds miR-503 promoter and regulates its transcription.
(a) HUVECs were treated with HG (control: L-Glucose) or transduced with Ad.p75 (control: Ad.Null). Representative western blot images and protein quantification of NF-κB p65, Tubulin and Laminin in nuclear and cytoplasmatic cell extracts *P<0.05, **P<0.01 versus Cont (n=3). (b) Sonicated chromatin of samples prepared as above was subjected to ChIP using normal mouse IgG or anti-NF-κB p65 antibody. Nuclear translocation of NF-κB p65 was verified with qPCR using primers for the IKBα promoter as a positive locus. (c) NF-κB p65 enrichment of miR-503 promoter (−3,480 bp from TSS). (d) Occupancy of H3K4me3 in the region of the NF-κB p65-binding sequence within the miR-503 promoter. For bd, IgG-precipitated samples were used as negative control. Data are presented as % input for each IP sample relative to the input chromatin (1%) for each amplicon and ChIP sample as indicated; *P<0.05 versus Cont or Ad.Null; **P<0.01 versus Cont (n=3). (e) HUVECs were transfected with various luciferase reporter constructs spanning the putative NF-κB-binding sites of the miR-503 promoter and treated in the above conditions. Luciferase activity was measured and presented as a fold-change compared with osmotic control or Ad.Null. *P<0.05 versus empty vector (n=5). Unpaired two-tailed Student's t-test or Mann–Whitney nonparametric test was applied. All values are mean±s.e.m. of three independent experiments.
Figure 4
Figure 4. In vivo NF-κB-dependent transcription of miR-503.
(a) HUVECs were transduced with Ad.Null, Ad.p75 or Ad.dnIKK2, and qPCR was carried out to measure the expression of pri-miR-503 and mature miR-503; **P<0.01 versus Ad.Null; #P<0.05, ##P<0.01 versus Ad.p75 (n=3). (b) Relative expression of miR-503 in the ischaemic adductors of non-diabetic and diabetic mice, which received Ad.Null, Ad.dnIKK2 or Ad.miR-503 (n=6 per group). Ad.Null was given to singly injected mice to equalize the virus quantity. (c) Line graph shows the time course of post-ischaemic foot blood flow recovery in mice (calculated as the ratio between ischaemic and contralateral foot blood flow; n=12 per group). (d,e) Column graphs show capillary and small arteriole (diameter <50 μm) densities in the ischaemic adductors of mice at 21 days post-ischaemia (n=8 per group). For be, *P<0.05 versus Non Diab+Ad.Null; #P<0.05 versus Diab+Ad.Null; §P<0.05 versus Diab+Ad.dnIKK2. Unpaired two-tailed Student's t-test or Mann–Whitney nonparametric test was applied. All values are mean±s.e.m. of three independent experiments.
Figure 5
Figure 5. Mechanism of MP-miR-503 release in endothelial cells.
Expression of mature miR-503 in MPs isolated by centrifugation from (a) the supernatant of HUVECs transduced with Ad.Null or Ad.p75; or exposed to HG versus L-Glucose control (**P<0.01, *P<0.05 versus Cont or Ad.Null; n=3). (b) From the plasma of non-diabetic, diabetic, non-diabetic ischaemic and diabetic ischaemic mice or ischaemic mice after Ad.Null or Ad.p75 overexpression (**P<0.01, *P<0.05 versus Non-Diab; *P<0.05 versus Ad.Null, n=8 per group). (c) Transmission electron microscopy showing the shedding of MPs by a membrane-blebbing process in Ad.Null- (left) and Ad.p75 (middle)-transduced HUVECs; (right) purified endothelial MPs showing a spheroid shape. Scale bars, 500 nm. (d) Flow cytometric analysis of MPs from HUVECs transduced with the Ad.Null, Ad.p75, Ad.dnIKK2 or treated with Rho kinase inhibitors Y27632 (10 μM) and HA-1077 (10 μM). (e) Caspase-3 activity in HUVECs transduced with Ad.Null, Ad.p75 or Ad.dnIKK2. (f) Representative western blot analyses and protein quantification of phospho and total MLC2 and MYPT1 in HUVECs transduced with Ad.Null, Ad.p75, Ad.dnIKK2 or treated with Rho kinase inhibitors Y27632 and HA-1077. For df, *P<0.05, **P<0.01 versus Ad.Null, #P<0.05, ##P<0.01 versus Ad.p75 (n=3). Unpaired two-tailed Student's t-test or Mann–Whitney nonparametric test was applied. All values are mean±s.e.m. of three independent experiments.
Figure 6
Figure 6. EFNB2 and VEGFA are miR-503 target genes.
(a,b) Luciferase activity at 48 h post-co-transfection of HEK293T cells with either miR-503 or miR-scrambled oligonucleotides (scr oligos) and the following plasmids: 3′-UTR-EFNB2, 3′-UTR-VEGFA, 3′-UTR-EFNB2mut and 3′-UTR-VEGFAmut (with mutation of the putative miRNA target site). **P<0.01 versus scr oligos; ##P<0.01 versus non-mutated (n=5). (c) Representative western blot images and protein quantification of VEGFA and EFNB2). Tubulin was used as a loading control. (d) VEGFA quantification in the medium by ELISA. (e) Proliferation (assessed by 5-bromodeoxyuridine incorporation) or (f) migration of pericytes transfected with miR-503 or siRNA oligos for EFNB2 or VEGFA (control: scr oligos). For cf, *P<0.05; **P<0.01 versus scr oligos (n=3). Unpaired two-tailed Student's t-test or Mann–Whitney nonparametric test was applied. All values are mean±s.e.m. of three independent experiments.
Figure 7
Figure 7. miR-503 targets VEGFA and EFNB2 in pericytes.
(a) Expression of pri-miR-503and mature miR-503 was measured in ECs and pericytes cultured in HG; **P<0.01 versus control endothelial cells; #P<0.05 versus control pericytes (n=3). (b) In vitro coculture system of HUVECs overexpressing p75NTR (or Ad.Null as control; top compartment) with pericytes (bottom compartment) has been set up, in which the cells are separated by a membrane to prevent direct cell–cell contact. miR-503 relative expression in pericytes was analysed using qPCR at 24 and 48 h after the start of coculture; *P<0.05 versus Ad.Null (n=3). (c) Ad.Null- or Ad.p75-transduced HUVECs (top compartments) were co-transduced with Ad.dnIKK2 or treated with Y27632 or HA-1077 and miR-503 expression was analysed in pericytes (bottom compartment) after 48 h from the treatment; (d) in the same experimental conditions, expression of EFNB2 and VEGFA was measured; *P<0.05 versus Ad.Null; #P<0.05 versus Ad.p75 (n=3). (e) The measurement by fluorimeter of the uptake of endothelial GFP-labelled MPs by pericytes. Where stated, pericytes were incubated with Eptifibatide (250 μM). **P<0.01 versus vehicle; #P<0.05 versus GFP-MPs (n=5). (f) Expression levels of miR-503, EFNB2 and VEGFA were measured in the coculture system described in b,c in the presence of Eptifibatide. *P<0.05 versus Ad.Null; #P<0.05 versus Ad.p75 (n=3). Unpaired two-tailed Student's t-test or Mann–Whitney nonparametric test was applied. All values are mean±s.e.m. of three independent experiments.
Figure 8
Figure 8. In vivo transfer of miR-503 during diabetes and ischaemia.
Unilateral limb ischaemia was induced in diabetic mice and endothelial cells, and pericytes were sorted from the limb muscles using CD31 and NG2 antibodies. Relative expression of pri-miR-503 and mature miR-503 was measured in (a) endothelial cells and in (b) pericytes. (c) Relative expression of EFNB2 and VEGFA in pericytes sorted from the limb muscles. For ac, *P<0.05, **P<0.01 versus Non Diab (n=10 per group). (d) Quantitative analysis of vascular permeability using Evans blue dye and expressed as ng of dye per mg of muscle tissue (n=8 per group). *P<0.05 versus Non Diab+Ad.Null; #P<0.05 versus Diab+Ad.Null. (e) Representative Isolectin-B4 staining (green) and immunostaining with anti-NG2 antibody (red) in adductor muscle of diabetic ischaemic and diabetic ischaemic mice injected with Ad.decoy503. Scale bar, 100 μm. (f) Quantification of pericyte coverage determined as ratio of NG2 to Isolectin-B4 (Iso-B4) staining. *P<0.05 versus Non Diab+Ad.Null; #P<0.05 versus Diab+Ad.Null (n=6 per group). Unpaired two-tailed Student's t-test or Mann–Whitney nonparametric test was applied. All values are mean±s.e.m. of three independent experiments.
Figure 9
Figure 9. Proposed mechanism of crosstalk between ECs and pericytes during microvascular diabetic complications.
p75NTR-dependent activation of NF-κB regulates miR-503 transcription in hyperglycemic ECs and the release of miR-503 in the extracellular compartment within microparticles. Microparticles carrying miR-503 are secreted from the diabetic ECs and can be transferred into neighbouring pericytes to subsequently modulate vessel permeability and angiogenesis through miR-503 target genes, VEGFA and EFNB2.

References

    1. Dinh T., Scovell S. & Veves A. Peripheral arterial disease and diabetes: a clinical update. Int. J. Low. Extrem. Wounds 8, 75–81 (2009). - PubMed
    1. Hinchliffe R. J. et al. A systematic review of the effectiveness of revascularization of the ulcerated foot in patients with diabetes and peripheral arterial disease. Diabetes Metab. Res. Rev. 28, (Suppl 1): 179–217 (2012). - PubMed
    1. Emanueli C. et al. Prevention of diabetes-induced microangiopathy by human tissue kallikrein gene transfer. Circulation 106, 993–999 (2002). - PubMed
    1. Giacco F. & Brownlee M. Oxidative stress and diabetic complications. Circ. Res. 107, 1058–1070 (2010). - PMC - PubMed
    1. Hammes H. P. et al. Pericytes and the pathogenesis of diabetic retinopathy. Diabetes 51, 3107–3112 (2002). - PubMed

Publication types

MeSH terms

Associated data