. 2015 Sep 15;195(6):2683-95.
doi: 10.4049/jimmunol.1500510. Epub 2015 Aug 12.

Transcription Factor Repertoire of Homeostatic Eosinophilopoiesis

Affiliations

Transcription Factor Repertoire of Homeostatic Eosinophilopoiesis

Carine Bouffi et al. J Immunol. .

Abstract

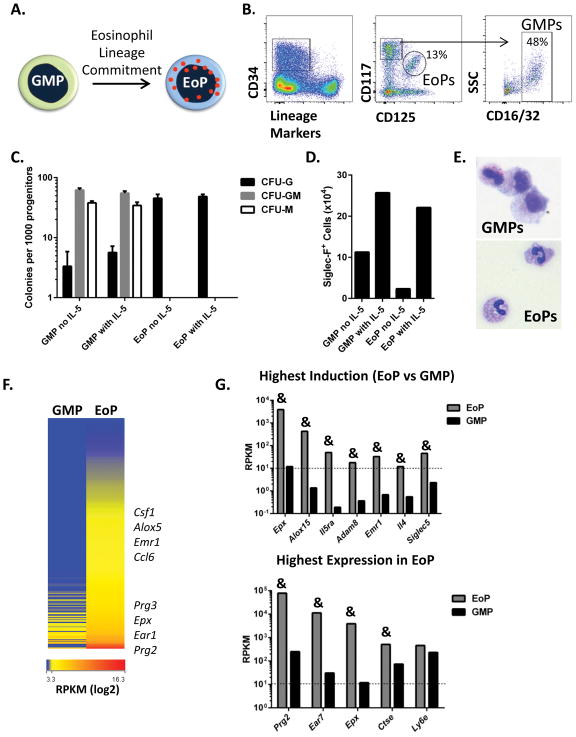
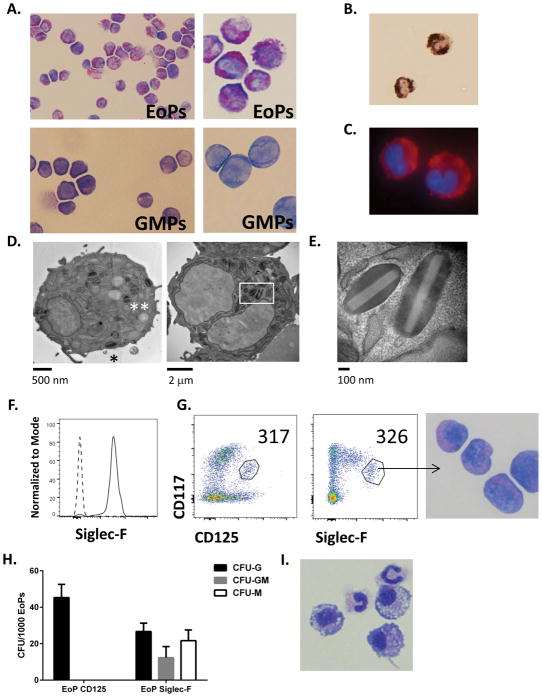
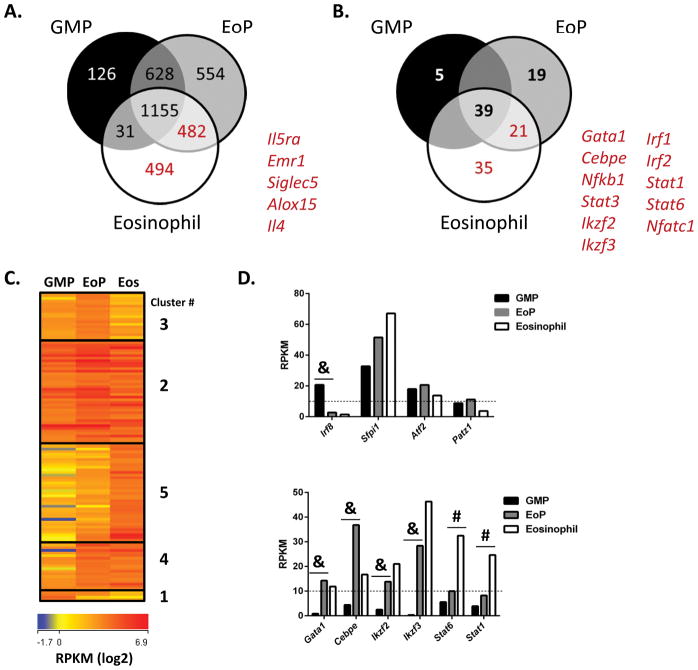
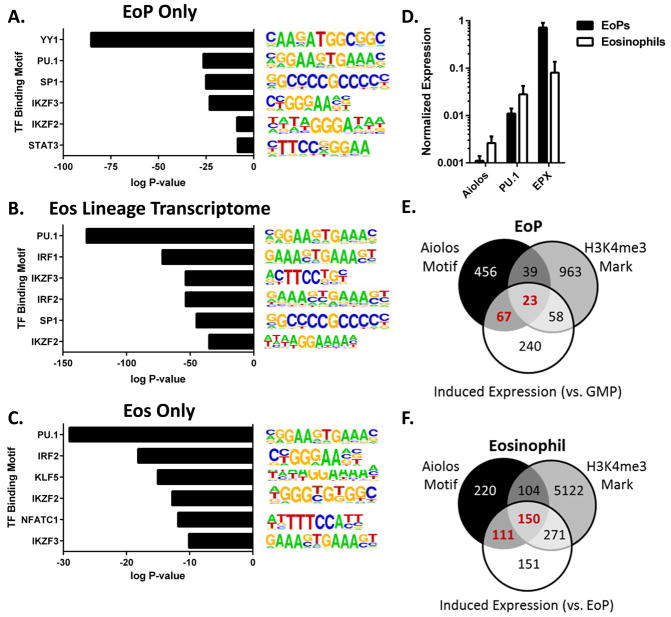
The production of mature eosinophils (Eos) is a tightly orchestrated process with the aim to sustain normal Eos levels in tissues while also maintaining low numbers of these complex and sensitive cells in the blood. To identify regulators of homeostatic eosinophilopoiesis in mice, we took a global approach to identify genome-wide transcriptome and epigenome changes that occur during homeostasis at critical developmental stages, including Eos-lineage commitment and lineage maturation. Our analyses revealed a markedly greater number of transcriptome alterations associated with Eos maturation (1199 genes) than with Eos-lineage commitment (490 genes), highlighting the greater transcriptional investment necessary for differentiation. Eos-lineage-committed progenitors (EoPs) were noted to express high levels of granule proteins and contain granules with an ultrastructure distinct from that of mature resting Eos. Our analyses also delineated a 976-gene Eos-lineage transcriptome that included a repertoire of 56 transcription factors, many of which have never previously been associated with Eos. EoPs and Eos, but not granulocyte-monocyte progenitors or neutrophils, expressed Helios and Aiolos, members of the Ikaros family of transcription factors, which regulate gene expression via modulation of chromatin structure and DNA accessibility. Epigenetic studies revealed a distinct distribution of active chromatin marks between genes induced with lineage commitment and genes induced with cell maturation during Eos development. In addition, Aiolos and Helios binding sites were significantly enriched in genes expressed by EoPs and Eos with active chromatin, highlighting a potential novel role for Helios and Aiolos in regulating gene expression during Eos development.


Figures

Figure 1
Figure 1. EoPs express high mRNA levels of granule proteins
(A) Eosinophil-lineage commitment schematic is shown. (B) A representative gating strategy to delineate EoPs and GMPs in whole bone marrow for FACS is shown and starts with pre-gating on viable single cells and then further gating on cells that express CD34, are negative for lineage markers and Sca-1, and co-express either CD117int (c-Kit) and CD125 (IL-5Rα) for EoPs or CD117hi and CD16/32 for GMPs. Percentage of cells in the parent gate is shown. (C) Colony-forming assay from sorted GMPs and EoPs cultured with and without IL-5 is shown (data from a representative of 2 independent experiments is shown with 3 plates per condition). (D) Total number of Siglec-F+ cells in colonies on a single plate from GMPs or EoPs cultured with or without IL-5 is shown (data from a representative of 2 independent experiments is shown). (E) Cytospins from colonies derived from GMPs and EoPs are shown (magnification 1000X). (F) Heat map showing mRNA expression levels for genes that were significantly induced 2-fold or more (P < 0.05) in EoPs compared to GMPs. Expression levels (mean RPKM) for genes that are highly induced in EoPs compared to GMPs (G, upper panel) and for genes that are the most highly expressed in EoPs (G, lower panel) are shown. Minimal expression level was mean RPKM equal to 10 and is indicated with a dashed line. &P < 1e-5.
Figure 2
Figure 2. EoPs express granule proteins and Siglec-F
(A) Cytospins of isolated EoPs and GMPs are shown (400X magnification on left, 1000X magnification on right). (B) Eosinophil peroxidase activity (brown-black precipitate) in isolated EoPs is shown (400X). (C) Anti-MBP staining (red) in isolated EoPs is shown with nuclei stained with DAPI (1000X). Results shown in panels A–C are representative of 3 experiments. (D) Electron micrographs showing scattered secondary granules with electron-dense core (asterisk) as seen in mature eosinophils, secondary granules with electron dense matrix on one side (double asterisk), and secondary granules with an electron-lucent core (box) are shown. (E) Higher magnification image of secondary granules in EoP with electron-lucent core and electron-dense matrix is shown. (F) Surface expression (solid line) of Siglec-F by EoPs in naïve murine bone marrow compared to isotype control (dashed line) is shown. Pre-gating included live, single cells that were lineage-marker negative but expressed CD34, CD125, and CD117. Results are representative of 3 experiments. (G) EoP identification via surface expression of CD117 and CD125 compared to CD117 and Siglec-F by CD34-expressing, lineage-marker negative bone marrow cells is shown with cell counts within each gate in the upper right corner of the dot blot. Cytospin of EoPs sorted via Siglec-F expression is shown. Results are representative of 2 experiments. (H) Colony-forming assay from EoPs sorted via surface expression of CD125 and Siglec-F is shown (data from a representative of 2 independent experiments is shown with 3 plates per condition). (I) Cytospins from colony-forming assay are shown (magnification 1000X).
Figure 3
Figure 3. Granule protein transcripts are higher in EoPs than eosinophils
(A) Eosinophil maturation schematic is shown. (B) A representative gating strategy to identify mature eosinophils from naïve murine bone marrow is shown and starts with pre-gating on viable single cells and then further gating on cells that co-express Siglec-F and CCR3. Percentage of parent gate is shown. (C) Heat map showing transcript levels of genes that were significantly reduced 2-fold or more (P < 0.05) in eosinophils (Eos) compared to EoPs is shown. (D) Expression level (mean RPKM) of genes that were significantly reduced in eosinophils compared to EoPs. &P < 1e-5. (E) Heat map showing transcript levels of genes that were significantly induced 2 fold or more (P <0.05) in eosinophils (Eos) compared to EoPs is shown. Expression level (mean RPKM) of genes with the greatest relative induction in eosinophils compared to EoPs (F) or the highest expression (G) in eosinophils (Eos) is shown. &P < 1e-5, *P < 5e-2.
Figure 4
Figure 4. Identification of eosinophil-lineage transcriptome and repertoire of TFs
(A) Venn diagram with overlap of gene expression between GMPs, EoPs, and eosinophils is shown. The number of genes, and select gene names, included in the eosinophil-lineage transcriptome (EoP and eosinophil shared expression and eosinophil-only expression) appear in red. (B) Venn diagram with overlap of TF expression between GMPs, EoPs, and eosinophils is shown. The number of TF genes, and select TF gene names, included in the eosinophil-lineage transcriptome appear in red. (C) Heap map showing differential TF expression between GMPs, EoPs, and eosinophils (Eos) is shown. Clusters based on differential expression pattern are delineated with boxes and numbered on the right. (D) Expression level (mean RPKM) of TFs in isolated GMPs, EoPs, and eosinophils is shown with lower limit of expression (RPKM equal to 10) depicted with a dashed line. &P < 1e-5, #P < 1e-4.
Figure 5
Figure 5. Differential epigenetic regulation during eosinophil development
(A) Heat maps of mRNA levels and distribution of H3K4me3 around transcriptional start sites (TSSs) in isolated GMPs, EoPs, and eosinophils are shown with each horizontal line being the same single gene across the heat and distribution maps. (B) Pie charts representing the presence of H3K4me3 marks in gene promoter regions (+/− 1000 bp from TSS) that are in common (black) or unique for GMPs (green), EoPs (blue), or eosinophils (orange) are shown, with the upper pie chart representing a comparison between GMPs and EoPs and the lower pie chart representing a comparison between EoPs and eosinophils. (C) Pie charts representing the proportion of expressed genes (RPKM ≥ 10) that contain at least one H3K4me3 mark in the promoter region in EoPs (left chart) or eosinophils (right chart) are shown. (D) Heat maps of mRNA levels and H3K4me3 distribution relative to TSS for genes that are expressed (RPKM ≥ 10) or silent (RPKM ≤ 2) in EoPs or eosinophils are shown. (E) Heat maps of mRNA levels and H3K4me3 distribution relative to TSS for genes that are significantly induced 2 fold or more (P ≤ 1e-2) in the EoPs compared to GMPs or in eosinophils (Eos) compared to EoPs are shown.
Figure 6
Figure 6. Enrichment of Helios and Aiolos binding motifs in eosinophil-lineage transcriptome
Highly represented TF motifs (HOMER motif enrichment algorithm) in H3K4me3-marked sequences in genes expressed by EoPs only (not by GMPs or eosinophils) (A), in the eosinophil (Eos)-lineage transcriptome (EoPs and eosinophils but not GMPs) (B), and by eosinophils only (not by GMPs or EoPs) (C) are shown with log-transformed P values on the x-axis. (D) Normalized expression of Aiolos, PU.1, and EPX in EoPs and eosinophils as determined by quantitative PCR is shown (n = 2 independent experiments with 2–6 samples per cell type). Shown are Venn diagrams representing genes with significantly induced expression (white circle, P < 0.01) in EoPs (compared to GMPs) (E) or in eosinophils (compared to EoPs) (F) and whether they contain Aiolos binding motifs (Aiolos Motif) and/or H3K4me3 peaks that are significantly elevated (P < 0.01, H3K4me3 Mark). The number of genes with Aiolos binding motifs and induced expression is in red font.

References

    1. Lee J, Rosenberg HF. Eosinophils in health and disease. Elsevier/Academic Press; London; Waltham, MA: 2013.
    1. Rosenberg HF, Dyer KD, Foster PS. Eosinophils: changing perspectives in health and disease. Nature reviews Immunology. 2013;13:9–22. - PMC - PubMed
    1. Iwasaki H, Mizuno S, Mayfield R, Shigematsu H, Arinobu Y, Seed B, Gurish MF, Takatsu K, Akashi K. Identification of eosinophil lineage-committed progenitors in the murine bone marrow. The Journal of experimental medicine. 2005;201:1891–1897. - PMC - PubMed
    1. Mori Y, Iwasaki H, Kohno K, Yoshimoto G, Kikushige Y, Okeda A, Uike N, Niiro H, Takenaka K, Nagafuji K, Miyamoto T, Harada M, Takatsu K, Akashi K. Identification of the human eosinophil lineage-committed progenitor: revision of phenotypic definition of the human common myeloid progenitor. The Journal of experimental medicine. 2009;206:183–193. - PMC - PubMed
    1. Duffin R, Leitch AE, Fox S, Haslett C, Rossi AG. Targeting granulocyte apoptosis: mechanisms, models, and therapies. Immunol Rev. 2010;236:28–40. - PubMed

Publication types

MeSH terms

Associated data