

A method for the evaluation of thousands of automated 3D stem cell segmentations
- PMID: 26268699
- PMCID: PMC4888372
- DOI: 10.1111/jmi.12303
A method for the evaluation of thousands of automated 3D stem cell segmentations
Abstract
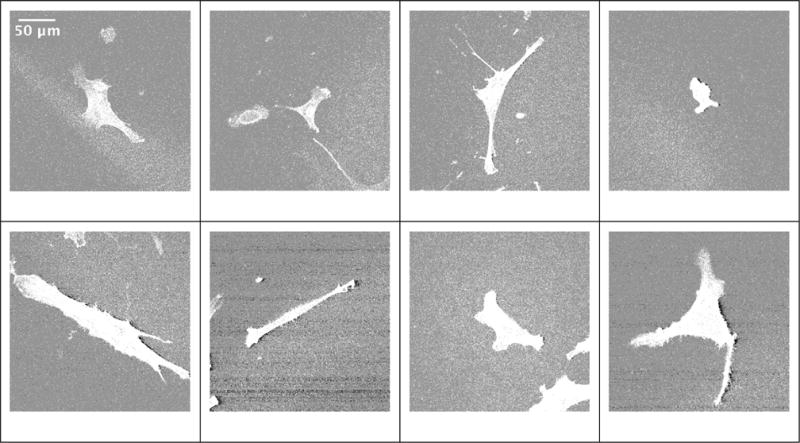
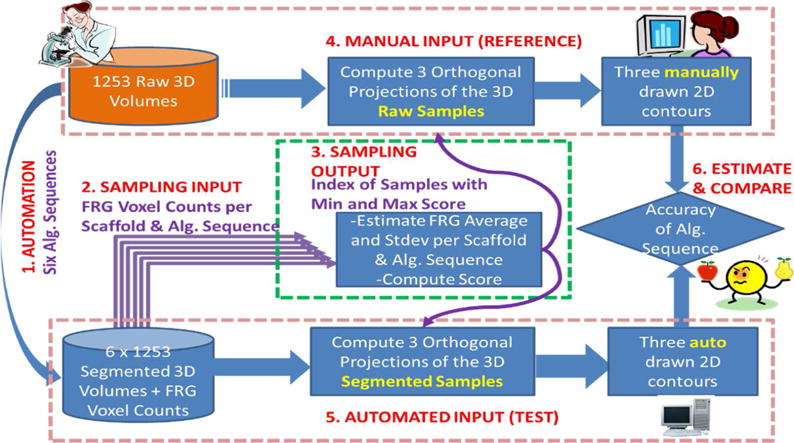
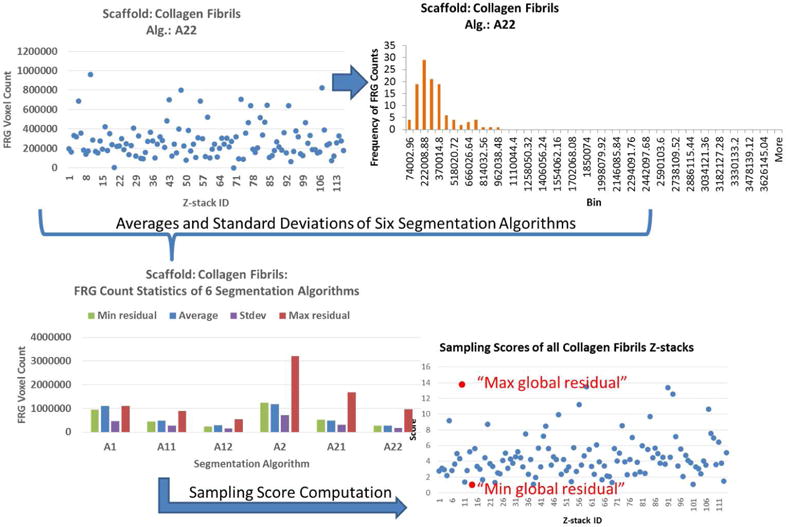
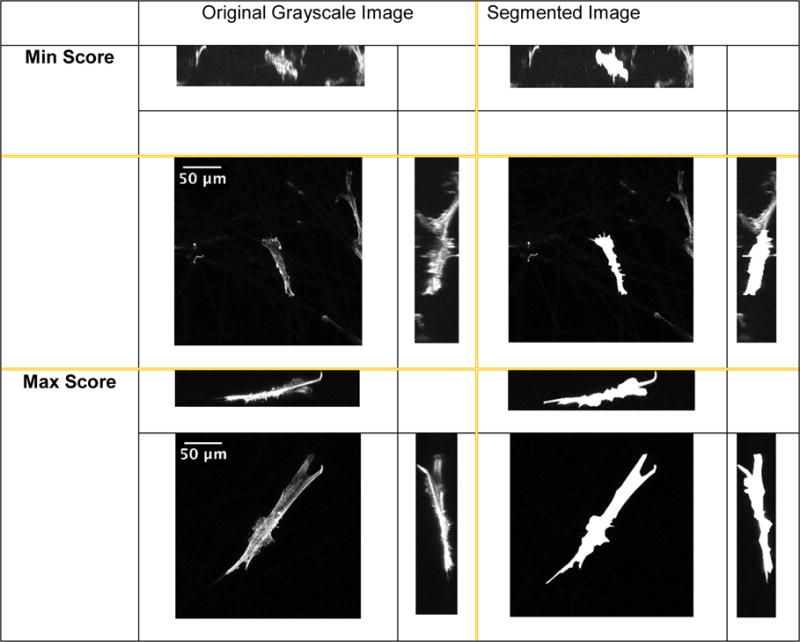
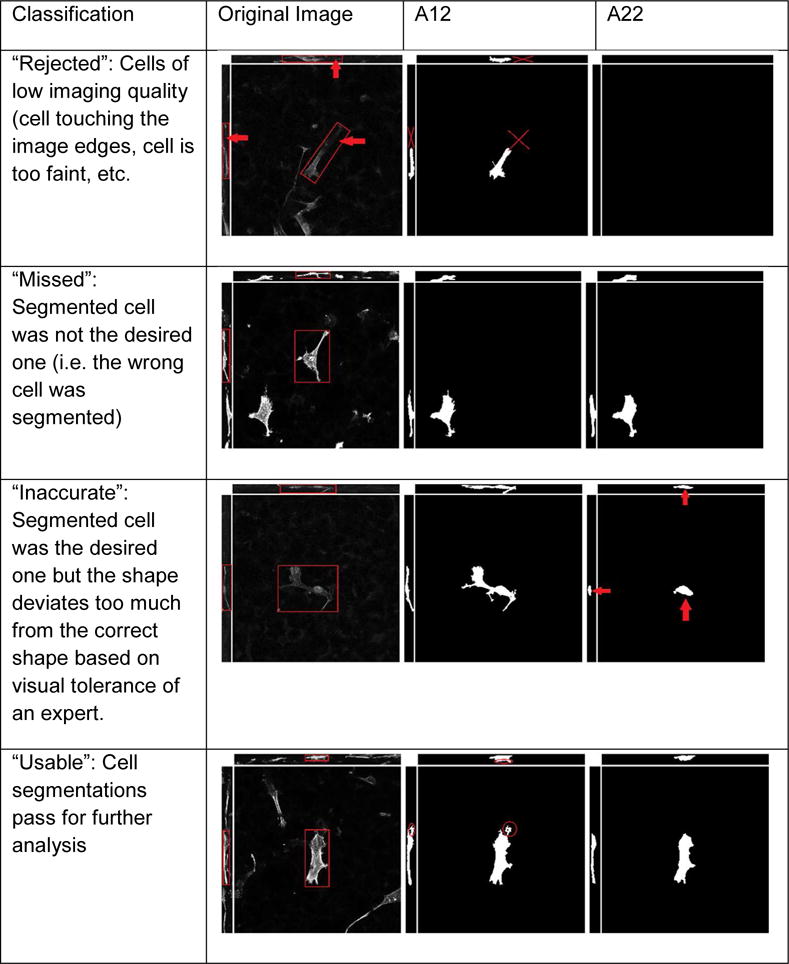
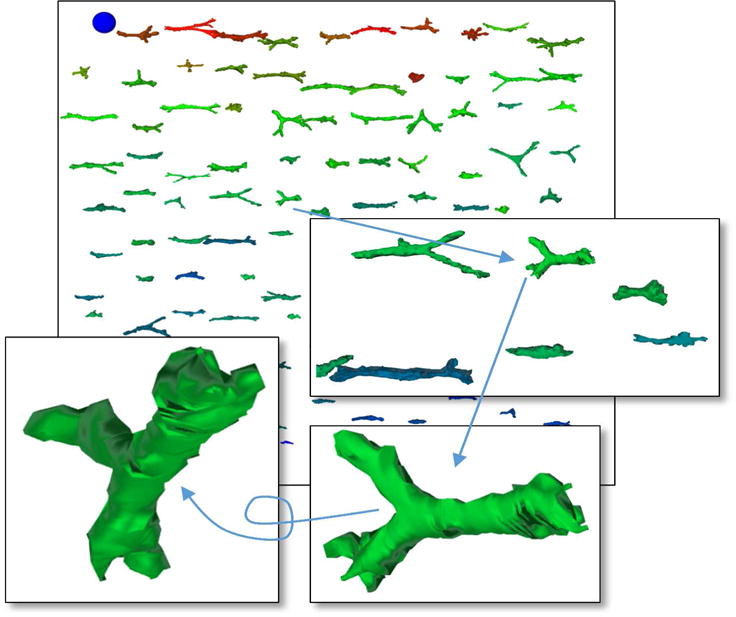
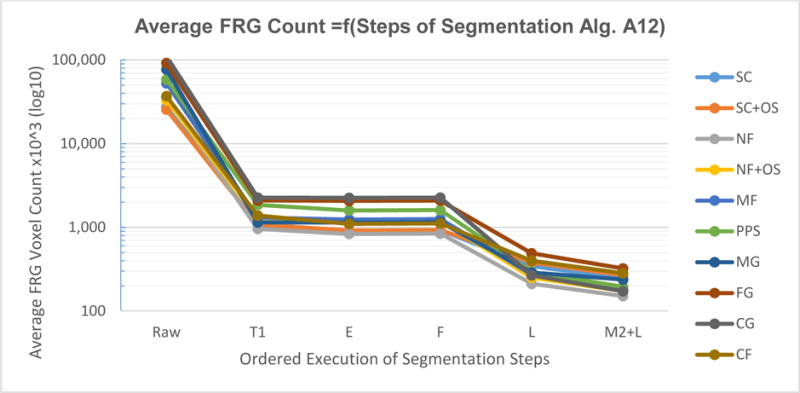
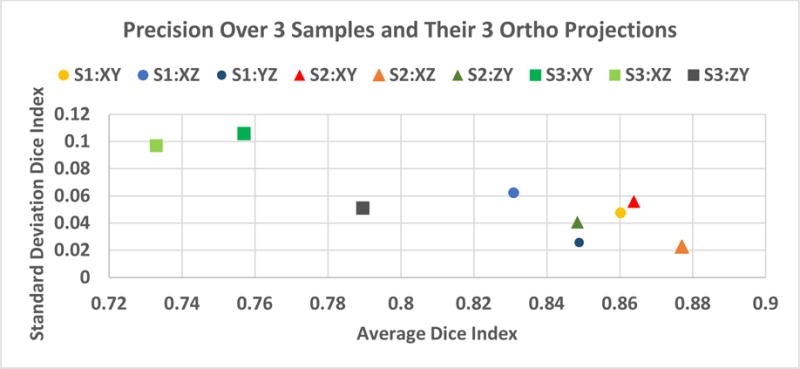
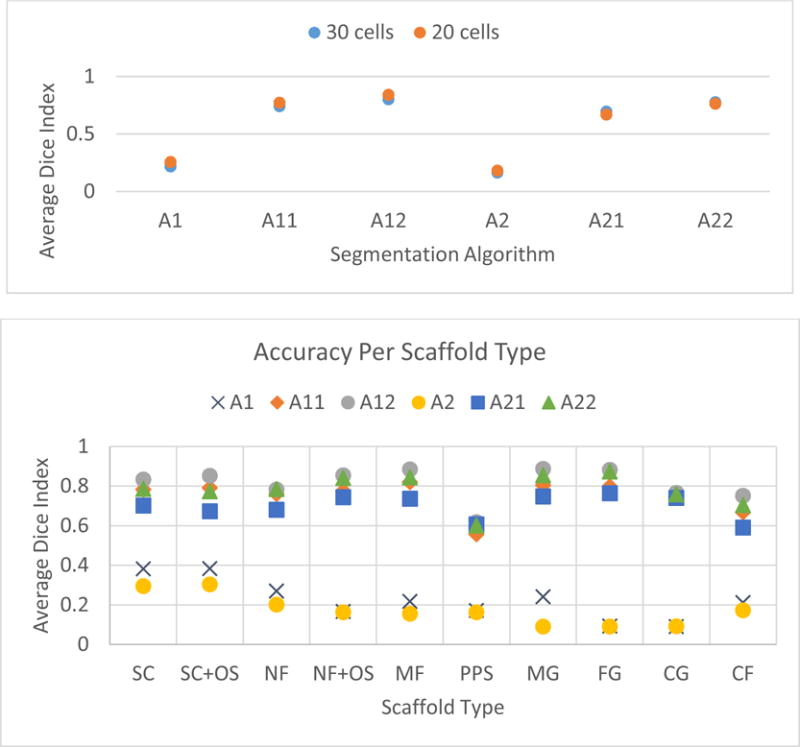
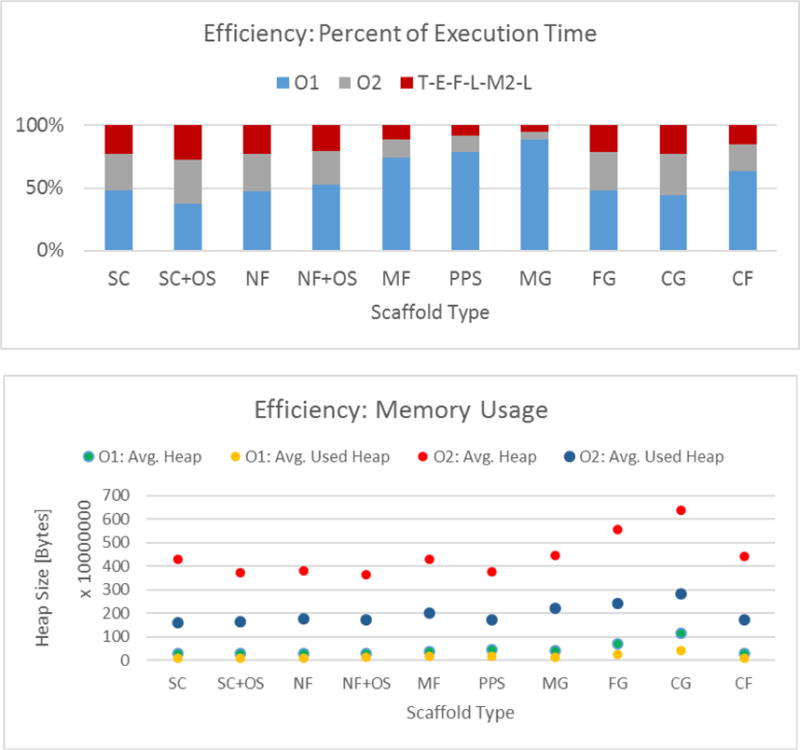
There is no segmentation method that performs perfectly with any dataset in comparison to human segmentation. Evaluation procedures for segmentation algorithms become critical for their selection. The problems associated with segmentation performance evaluations and visual verification of segmentation results are exaggerated when dealing with thousands of three-dimensional (3D) image volumes because of the amount of computation and manual inputs needed. We address the problem of evaluating 3D segmentation performance when segmentation is applied to thousands of confocal microscopy images (z-stacks). Our approach is to incorporate experimental imaging and geometrical criteria, and map them into computationally efficient segmentation algorithms that can be applied to a very large number of z-stacks. This is an alternative approach to considering existing segmentation methods and evaluating most state-of-the-art algorithms. We designed a methodology for 3D segmentation performance characterization that consists of design, evaluation and verification steps. The characterization integrates manual inputs from projected surrogate 'ground truth' of statistically representative samples and from visual inspection into the evaluation. The novelty of the methodology lies in (1) designing candidate segmentation algorithms by mapping imaging and geometrical criteria into algorithmic steps, and constructing plausible segmentation algorithms with respect to the order of algorithmic steps and their parameters, (2) evaluating segmentation accuracy using samples drawn from probability distribution estimates of candidate segmentations and (3) minimizing human labour needed to create surrogate 'truth' by approximating z-stack segmentations with 2D contours from three orthogonal z-stack projections and by developing visual verification tools. We demonstrate the methodology by applying it to a dataset of 1253 mesenchymal stem cells. The cells reside on 10 different types of biomaterial scaffolds, and are stained for actin and nucleus yielding 128 460 image frames (on average, 125 cells/scaffold × 10 scaffold types × 2 stains × 51 frames/cell). After constructing and evaluating six candidates of 3D segmentation algorithms, the most accurate 3D segmentation algorithm achieved an average precision of 0.82 and an accuracy of 0.84 as measured by the Dice similarity index where values greater than 0.7 indicate a good spatial overlap. A probability of segmentation success was 0.85 based on visual verification, and a computation time was 42.3 h to process all z-stacks. While the most accurate segmentation technique was 4.2 times slower than the second most accurate algorithm, it consumed on average 9.65 times less memory per z-stack segmentation.
Keywords: 3D segmentation; confocal imaging; sampling; segmentation evaluation; stem cells; visual verification.
Published 2015. This article is a U.S. Government work and is in the public domain in the USA.
Figures
References
-
- Cardoso Jaime S, Corte-Real Luís. Toward a Generic Evaluation of Image Segmentation. IEEE Transactions on Image Processing. 2005 Nov;14(11):1773–82. - PubMed
-
- Cha Sung-Hyuk. Comprehensive Survey on Distance/similarity Measures between Probability Density Functions. International Journal of Mathematical Models and Methods in Applied Sciences. 2007;1(4):300–308.
-
- Chen Jianxu, Oleg Kim V, Litvinov Rustem I, Weisel John W, Alber Mark S, Chen Danny Z. An Automated Approach for Fibrin Network Segmentation and Structure Identification in 3D Confocal Microscopy Images. 2014 IEEE 27th International Symposium on Computer-Based Medical Systems. 2014 May;:173–178. doi: 10.1109/CBMS.2014.62. - DOI
-
- Cohen Andrew R, Bjornsson Christopher S, Temple Sally, Banker Gary, Roysam Badrinath, Senior Member Automatic Summarization of Changes in Biological Image Sequences Using Algorithmic Information Theory. IEEE on Pattern Analysis and Machine Intelligence. 2009;31(8):1386–1403. - PubMed
-
- Dice LR. Measures of the Amount of Ecologic Association between Species. Ecology. 1945;26(3):297–302.
MeSH terms
Grants and funding
LinkOut - more resources
Full Text Sources
Other Literature Sources
Medical
