. 2015 Aug 13:5:13336.
doi: 10.1038/srep13336.

Extensive shift in placental transcriptome profile in preeclampsia and placental origin of adverse pregnancy outcomes

Affiliations

Extensive shift in placental transcriptome profile in preeclampsia and placental origin of adverse pregnancy outcomes

Siim Sõber et al. Sci Rep. .

Abstract

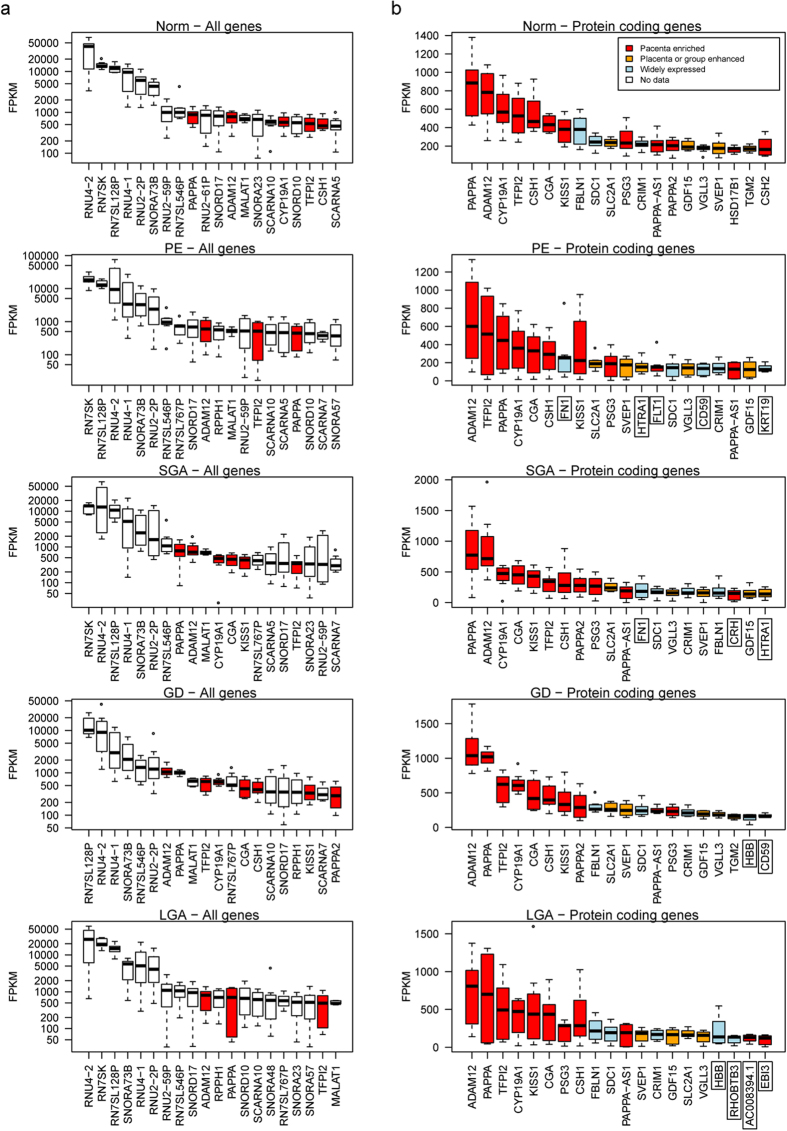
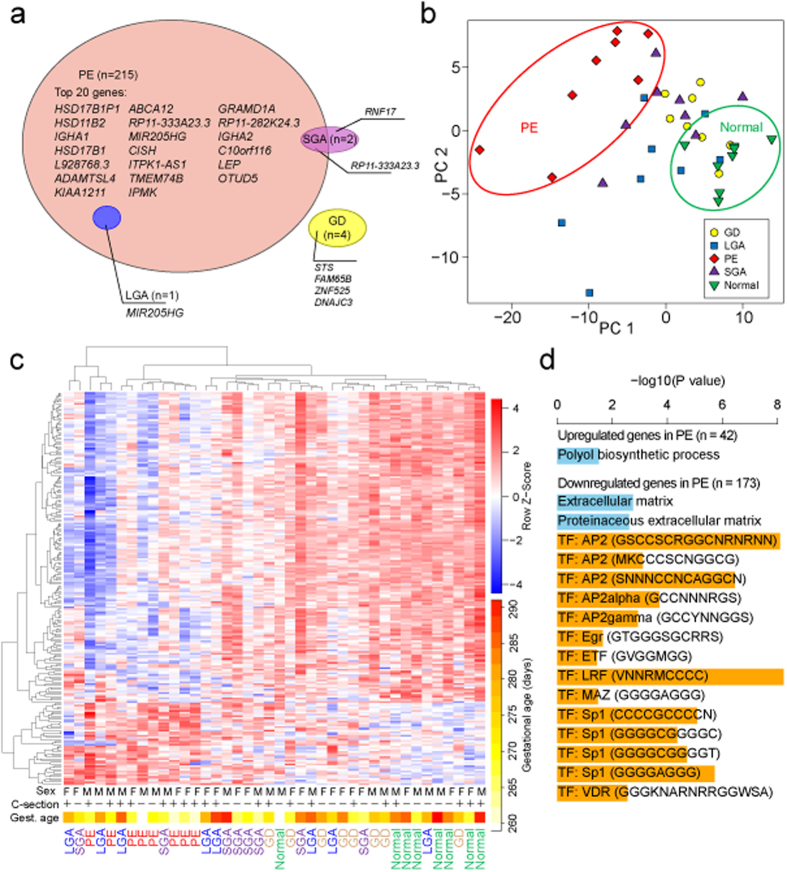
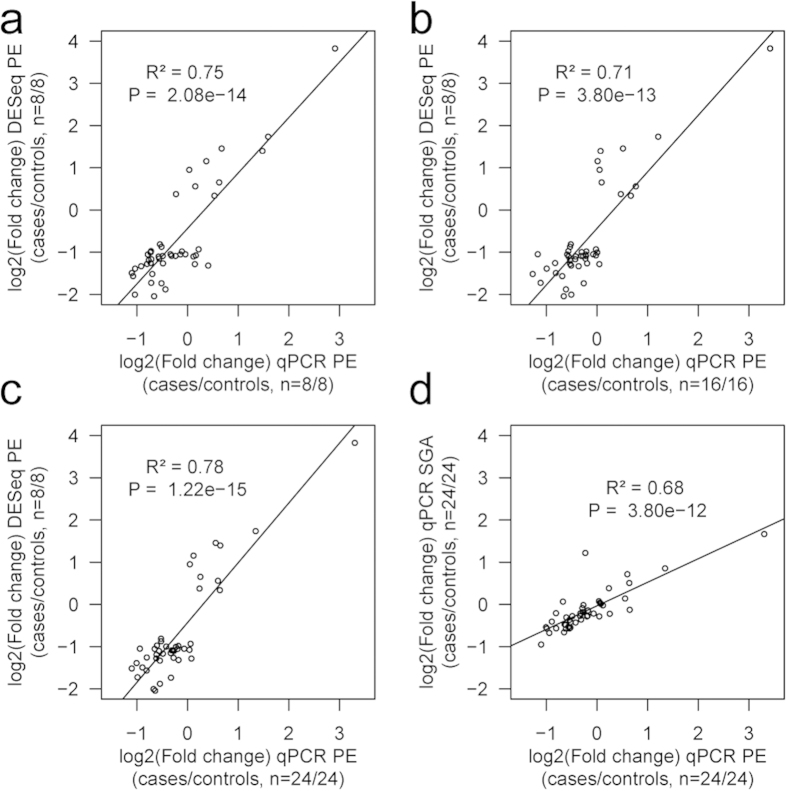
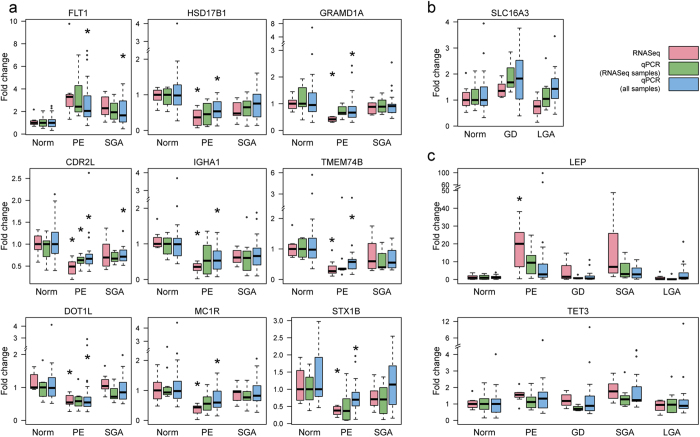
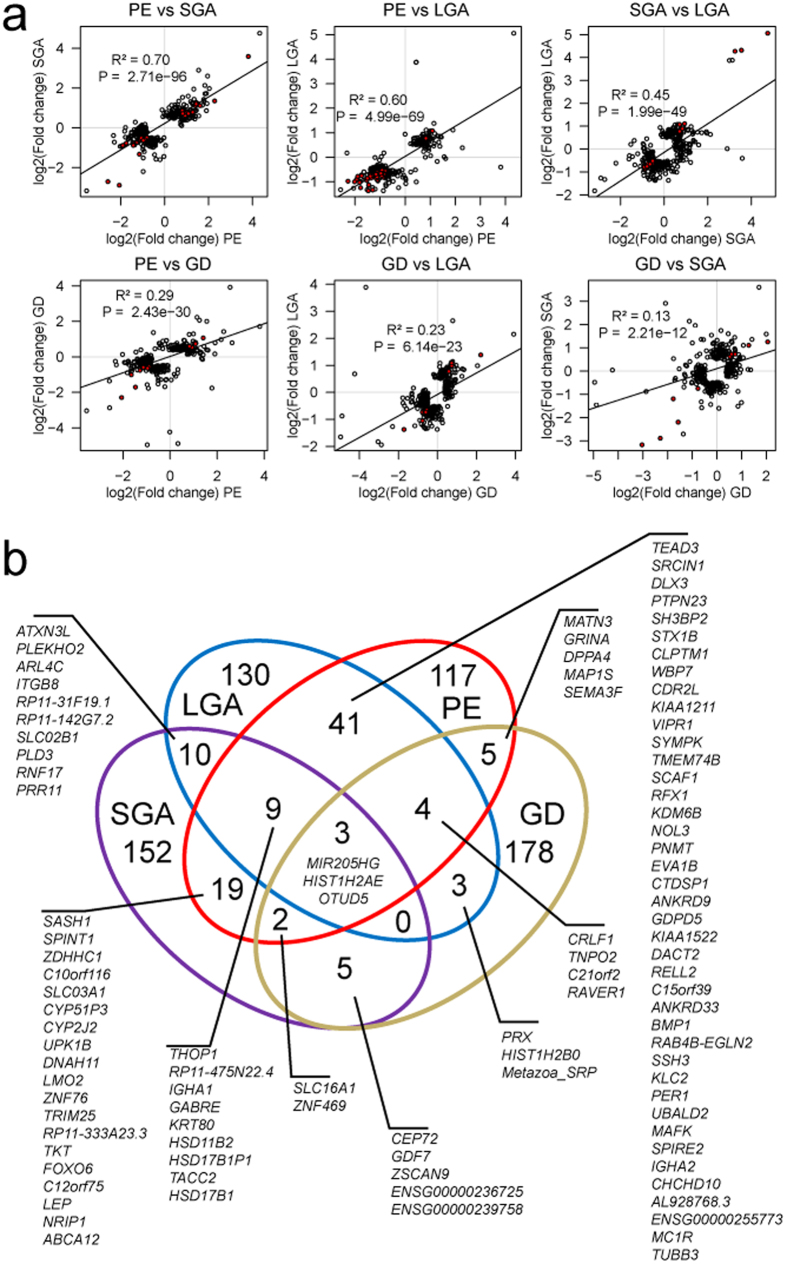
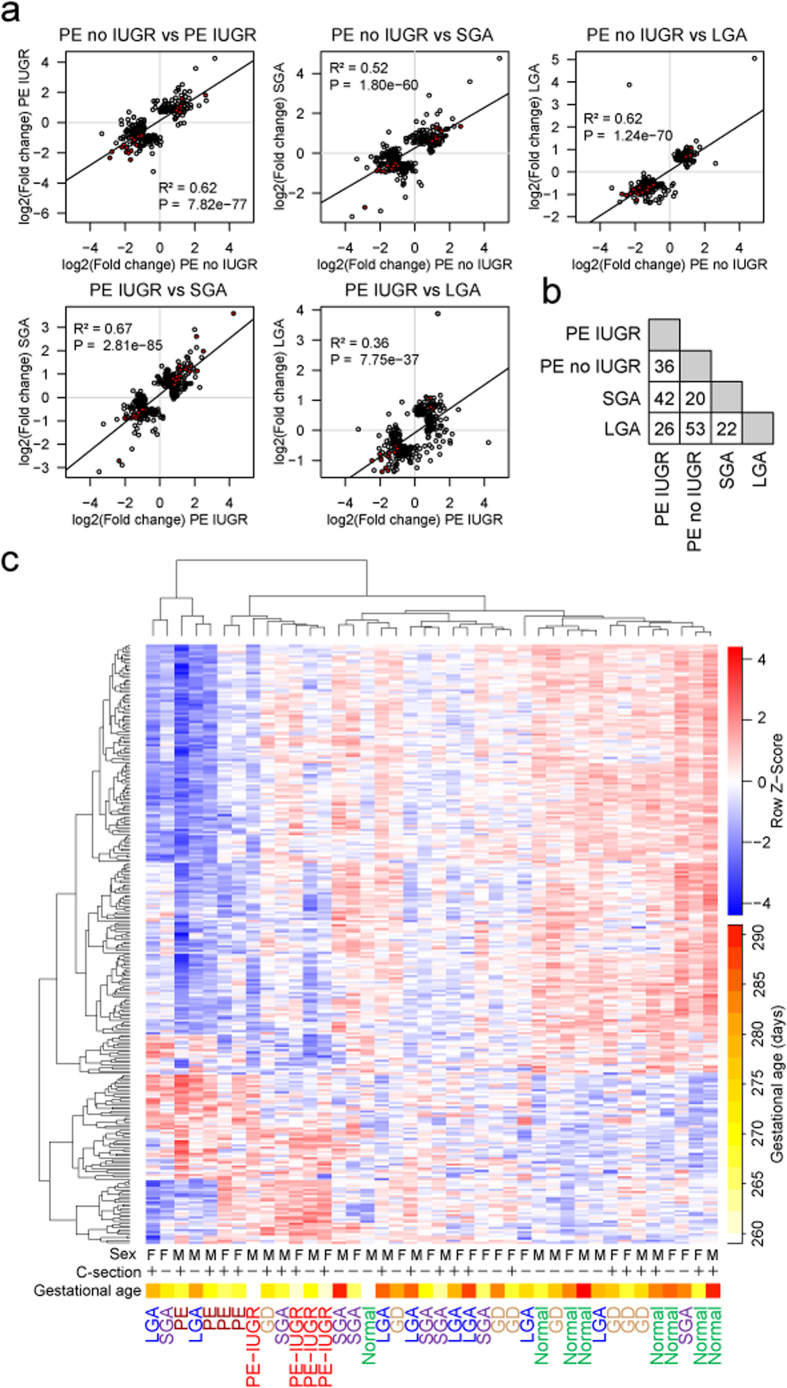
One in five pregnant women suffer from gestational complications, prevalently driven by placental malfunction. Using RNASeq, we analyzed differential placental gene expression in cases of normal gestation, late-onset preeclampsia (LO-PE), gestational diabetes (GD) and pregnancies ending with the birth of small-for-gestational-age (SGA) or large-for-gestational-age (LGA) newborns (n = 8/group). In all groups, the highest expression was detected for small noncoding RNAs and genes specifically implicated in placental function and hormonal regulation. The transcriptome of LO-PE placentas was clearly distinct, showing statistically significant (after FDR) expressional disturbances for hundreds of genes. Taqman RT-qPCR validation of 45 genes in an extended sample (n = 24/group) provided concordant results. A limited number of transcription factors including LRF, SP1 and AP2 were identified as possible drivers of these changes. Notable differences were detected in differential expression signatures of LO-PE subtypes defined by the presence or absence of intrauterine growth restriction (IUGR). LO-PE with IUGR showed higher correlation with SGA and LO-PE without IUGR with LGA placentas. Whereas changes in placental transcriptome in SGA, LGA and GD cases were less prominent, the overall profiles of expressional disturbances overlapped among pregnancy complications providing support to shared placental responses. The dataset represent a rich catalogue for potential biomarkers and therapeutic targets.


Conflict of interest statement

The authors declare no competing financial interests.

Figures

Figure 1
Figure 1. Top 20 transcripts
((a) logarithmic scale) and protein coding genes ((b) linear scale) with the highest expression in placentas representing normal pregnancy (NORM) and cases of preeclampsia (PE), gestational diabetes (GD), small- and large-for-gestational-age newborns (SGA, LGA) (n = 8/group). Annotation of placental transcripts detected and quantified by the RNA-Seq pipeline was based on ENSEMBL v67 database. Gene expression levels are expressed in FPKM (fragments per kilobase of exons per million mapped fragments) as determined by cufflinks v 2.0.2. Data on the enrichment of gene expression in the placenta compared to other tissues was derived from Protein Atlas v12. Expression profile across tissues for noncoding RNAs was not available. Boxed gene names indicate transcripts ranked among the top-20 highest expressed genes only in specific pregnancy complications, comparative expression values of these transcripts in all studied groups are shown in Supplementary Fig. S3.
Figure 2
Figure 2. Differential gene expression in cases of preeclampsia (PE), gestational diabetes (GD), cases of small- and large-for-gestational-age newborns (SGA, LGA) compared to normal pregnancy (Normal) based on RNA-Seq profiling of 40 term placental samples (n = 8/group)
(a) Venn diagram showing differentially expressed genes in each pathology group supported by stringent statistical significance criteria (DESeq: FDR < 0.1 and DESeq2: FDR < 0.05). (b) Principal component analysis (PCA, the two first components are plotted) and (c) hierarchical clustering based on transformed read counts of 220 differentially expressed genes across pregnancy complications. The gene expression levels were subjected to variance stabilizing transformation in DESeq and standardized by subtracting the mean expression across all samples from its value for a given sample and then dividing by the standard deviation across all the samples. This scaled expression value, denoted as the row Z-score, is plotted in red-blue color scale with red indicating increased expression and blue indicating decreased expression. Hierarchical clustering of genes (rows) and samples (columns) was based on Pearson’s correlation. Hierarchical clustering trees are shown for the analyzed samples (top) and genes (left). For each sample are shown newborn sex (M, male; F, female), delivery by caesarean section (+/–) and gestational age at birth plotted in white-yellow-red color scale (white < 260, red > 290 gestational days). (d) Significantly enriched categories among the significantly differentially expressed genes in PE (n = 215) from gene set enrichment analysis in g:Profiler. Horizontal bars indicate significance. Blue bars represent GO terms, orange bars represent transcription factor binding sites.
Figure 3
Figure 3. Estimated gene expression log2(fold change) of the 45 tested placental genes in preeclamptic placentas (PE) compared to normal gestation (NORM) is highly correlated between the RNA-Seq and Taqman RT-qPCR datasets.
The correlation with RNA-Seq results (Y-axis) holds for the (a) technical replicate by the RT-qPCR performed in the discovery samples (PE, n = 8; NORM, n = 8), (b) for the biological replicate by RT-qPCR using an independent placental sample-set (PE, n = 16; NORM, n = 16) and (c) for the combined RT-qPCR data of discovery and follow-up samples (PE, n = 24; NORM, n = 24) (X-axis). (d) The estimated gene expression log2(fold change) of the 45 placental genes subjected to Taqman RT-qPCR in small-for-gestational-age (SGA, n = 24; Y-axis) cases compared to normal gestation (NORM, n = 24) is correlated with gene expression shifts in PE placentas (n = 24; X-axis). Note the difference in slope of the regression line due to more prominent fold changes of all genes in PE compared to SGA. Each dot represents one tested gene and the plots present linear regression lines, P values and correlation coefficients (R2).
Figure 4
Figure 4. Examples of technical replicates from the experimental validation of differentially expressed placental genes in pregnancy complications.
Plots represent gene expression fold changes relative to the median value of the normal pregnancy samples (treated as the reference level = 1) in the discovery RNA-Seq dataset (pink; n = 8 samples/group), in the validation by Taqman RT-qPCR (green; n = 8 samples/group) and in the complete Taqman RT-qPCR dataset (blue; n = 24 samples/group). (a) Genes with the highest statistical significance in gene expression shift in pre-eclamptic (PE) placentas (RT-qPCR: FDR <0.05; Supplementary Table S3) show concordant effect directions in the PE and small-for-gestational-age (SGA) groups. (b) Placental expression of SLC16A3 in gestational diabetes (GD) and large for gestational age (LGA) groups. (c) LEP and TET3 show elevated transcript level in PE and SGA placentas compared to other pregnancy outcomes. Asterisks (*) indicate differential expression meeting the statistical significance criteria either for the RNA-Seq (DESeq: FDR < 0.1, DESeq2: FDR < 0.05) or RT-qPCR (FDR < 0.05) datasets. CDR2L, cerebellar degeneration-related protein 2-like; DOT1L, DOT1-like histone H3K79 methyltransferase; FLT1, fms-related tyrosine kinase 1; GRAMD1A, GRAM domain containing 1A; HSD17B1, hydroxysteroid (17-beta) dehydrogenase 1; IGHA1, immunoglobulin heavy constant alpha 1; LEP, leptin; MC1R, melanocortin 1 receptor (alpha melanocyte stimulating hormone receptor); TET3, tet methylcytosine dioxygenase 3; TMEM74B, transmembrane protein 74B; SLC16A3, solute carrier family 16 (monocarboxylate transporter); STX1B, syntaxin 1B.
Figure 5
Figure 5. High concordance in placental gene expression changes in alternative scenarios of complicated compared to normal pregnancy.
(a) Correlation plots for the fold changes of the highest ranked genes in the differential expression testing in each pregnancy complication compared to normal pregnancy (DESeq analysis). For each pairwise analysis of gestational complications, the lists of top-200 genes (circles) were united and plotted at the x,y-plane, where the axes correspond to the log2(fold changes) in the two groups. Red circles represent genes, which are shared between the top gene lists. The linear regression line along with correlation coefficient R2 and statistical significance is given. (b) Venn diagram for the shared fraction of the highest ranked genes in differential expression testing in alternative pregnancy complications. The number and gene list in each intersection are given. PE, preeclampsia, GD, gestational diabetes, SGA and LGA, small- and large-for-gestational-age newborns.
Figure 6
Figure 6. Placentas from the cases of late-onset preeclampsia (PE) with and without concomitant intra-uterine growth restriction (IUGR) exhibit distinct gene expression patterns.
(a) Correlation plots for the fold changes of the highest ranked genes in the differential expression testing in each pregnancy complication compared to normal pregnancy (DESeq analysis). For each pairwise analysis of gestational complications, the lists of top-200 genes (circles) were united and plotted at the x,y-plane, where the axes correspond to log2(fold changes) in the two groups. Red circles represent genes, which are shared between the top gene lists. The linear regression line along with correlation coefficient R2 and statistical significance is given. (b) Numbers of shared genes among the top 200 highest ranked transcripts in differential expression testing. Detailed information on the pairwise overlaps among the study groups for the shared top-genes with altered placental expression is provided in Supplementary Fig. S4. (c) Hierarchical clustering based on transformed read counts of 283 differentially expressed genes in PE without IUGR, PE with IUGR, SGA, LGA and GD. Gene expression levels were subjected to variance stabilizing transformation in DESeq and standardized by subtracting the mean expression across all samples from its value for a given sample and then dividing by the standard deviation across all the samples. This scaled expression value, denoted as the row Z-score, is plotted in red-blue color scale with red indicating increased expression and blue indicating decreased expression. Hierarchical clustering of genes (rows) and samples (columns) was based on Pearson’s correlation. Hierarchical clustering trees are shown for the analyzed samples (top) and genes (left). For each sample are shown newborn sex (M, male; F, female), delivery by caesarean section (+/–) and gestational age at birth plotted in white-yellow-red color scale (white < 260, red  > 290 gestational days).

References

    1. Kurt, B. Graham, J. & Burton R. N. B. in Pathol. Hum. Placenta (Springer-Verlag Berlin and Heidelberg GmbH & Co, 2012).
    1. Kleinrouweler C. E. et al.. Differentially Expressed Genes in the Pre-Eclamptic Placenta: A Systematic Review and Meta-Analysis. PLoS One 8, e68991 (2013). - PMC - PubMed
    1. Rull K. et al.. Increased placental expression and maternal serum levels of apoptosis-inducing TRAIL in recurrent miscarriage. Placenta 34, 141–148 (2013). - PMC - PubMed
    1. Struwe E. et al.. Microarray analysis of placental tissue in intrauterine growth restriction. Clin. Endocrinol. (Oxf). 72, 241–247 (2010). - PubMed
    1. Triche E. W. et al.. Bioinformatic approach to the genetics of preeclampsia. Obstet. Gynecol. 123, 1155–61 (2014). - PMC - PubMed

Publication types