. 2015 Aug 13:6:7972.
doi: 10.1038/ncomms8972.

Slow-growing cells within isogenic populations have increased RNA polymerase error rates and DNA damage

Affiliations

Slow-growing cells within isogenic populations have increased RNA polymerase error rates and DNA damage

David van Dijk et al. Nat Commun. .

Abstract

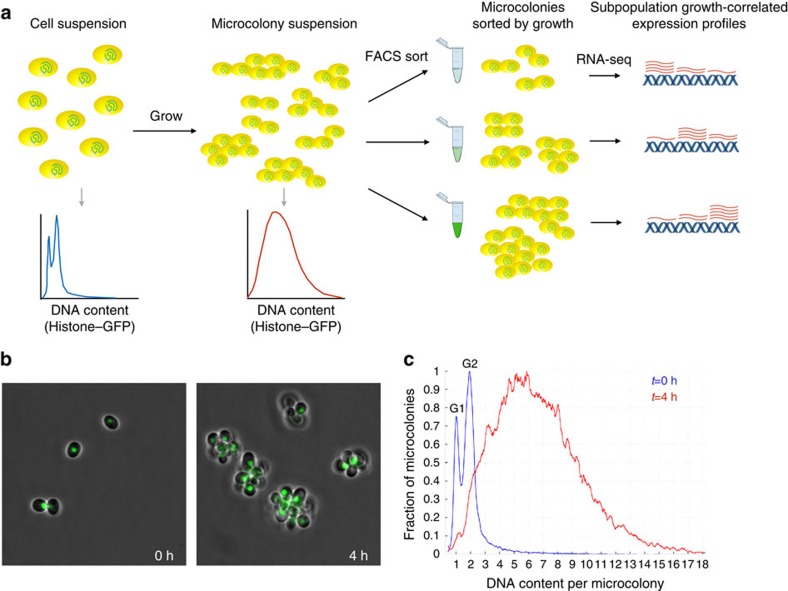
Isogenic cells show a large degree of variability in growth rate, even when cultured in the same environment. Such cell-to-cell variability in growth can alter sensitivity to antibiotics, chemotherapy and environmental stress. To characterize transcriptional differences associated with this variability, we have developed a method--FitFlow--that enables the sorting of subpopulations by growth rate. The slow-growing subpopulation shows a transcriptional stress response, but, more surprisingly, these cells have reduced RNA polymerase fidelity and exhibit a DNA damage response. As DNA damage is often caused by oxidative stress, we test the addition of an antioxidant, and find that it reduces the size of the slow-growing population. More generally, we find a significantly altered transcriptome in the slow-growing subpopulation that only partially resembles that of cells growing slowly due to environmental and culture conditions. Slow-growing cells upregulate transposons and express more chromosomal, viral and plasmid-borne transcripts, and thus explore a larger genotypic--and so phenotypic--space.


Figures

Figure 1
Figure 1. FitFlow: sorting cells by single-cell fitness.
(a) FitFlow method: single, chitinase-deficient, Hta2–GFP-expressing cells are suspended after brief sonication and G1 selection. Growth for several generations in liquid media results in microcolonies of cells that have a distribution of cell number. Flow cytometry of Hta2–GFP measurement reveals the microcolony size distribution. Subsequent sorting on Hta2–GFP abundance thus separates populations according to their single-cell growth rate. RNA-seq analysis of each bin of growth rate reveals gene expression patterns associated with variable stochastic growth. (b) Microscopy at different time points shows microcolony formation. (c) Flow cytometry of single cells (t=0 h) and microcolonies (t=4 h) shows the distribution cell number per microcolony. The HTA2–GFP fusion enables high-resolution measurement of DNA content as shown by separate G1 and G2 peaks at t=0 h.
Figure 2
Figure 2. More transcriptional diversity in slow-growing subpopulations.
(a) At low expression (<5 FPKM (fragments per kilobase of transcript per million mapped reads)), slow- and fast-growing cells express similar numbers of transcripts, but at medium (5–30 FPKM), slow-growing cells express both more genes and more unique gene functions (paired t-test P<1e−35 for transcripts and GO terms). (b) The slow-growing subpopulation expresses more unannotated transcripts (paired ks-test P=5.36 × 10⁻¹⁰) and antisense transcripts (paired ks-test P=1.34 × 10⁻²²) at >10 FPKM. (c) Highly expressed genes (higher than one s.d., red) are upregulated (paired ks-test P=1.1 × 10−63), while lowly expressed genes (lower than one s.d., blue) tend to be downregulated with increasing subpopulation growth rate (paired ks-test P=4.6 × 10⁻³⁵). y axis shows the average expression level in all measured populations. The x axis shows expression change from slow to fast subpopulation growth, computed as the log2 ratio.
Figure 3
Figure 3. Transcriptional profiles of mean and subpopulation growth.
(a) Bar-plot showing mean and standard expression of all genes in each functional group of genes upregulated in the slow- (blue) or fast (blue)-growing subpopulations. (bd) Growth-correlated expression from slow- and fast-growing subpopulations (FitFlow, x axis) are compared with expression differences from growth rate varied in nutrient limited chemostats (y axis). (b) Scatter-plot the correlation of gene expression between subpopulation growth and mean population growth. Ribosomal genes (red) and stress genes (blue) are, respectively, up- and downregulated both in subpopulation (x axis, paired ks-tests Pred=3.36 × 10−67; Pblue=4.02 × 10⁻²¹) and mean population (y axis, paired ks-tests Pred=2.45 × 10−36; Pblue=8.26 × 10−50) fast growth. (c) Scatter-plot highlighting genes for which subpopulation growth is anti-correlated with mean population growth. Amino-acid biosynthesis (red) and mitochondrial translation (blue) are downregulated in the fast subpopulation (paired ks-tests Pred=1.03 × 10⁻¹²; Pblue=3.31 × 10−04) but upregulated in mean population fast growth (paired ks-tests Pred=3.30 × 10−04; Pblue=2.64 × 10⁻¹⁶), while the proteasome (green) is upregulated in the fast subpopulation (paired ks-test P=2.25 × 10−06) but downregulated in mean population fast growth (paired ks-test P=4.69 × 10−07). (d) DNA damage genes (black points) are upregulated in the slow subpopulation (x axis, paired ks-test P=4.73 × 10−07), but are not correlated with average population growth rate differences (y axis, paired ks-test P=0.83). DIN7 (red point) is involved in mitochondrial DNA damage repair, and is the only DNA damage related gene that is not upregulated in the slow subpopulation. (e) Time-lapse microscopy shows that cells from the slow-growing subpopulation have Rad52–GFP foci. Foci were measured as the maximum Rad52–GFP signal in the nucleus (y axis) and growth (x axis) as the microcolony growth rate where slow and fast cells represent the slowest 25% and fastest 75%, respectively (t-test, P=0.02). (f) Addition of the antioxidant vitamin C reduced the fraction of slow-growing microcolonies (t-test, P=0.005).
Figure 4
Figure 4. Slow-growing cells exhibit more transcript errors.
(a) For each genomic nucleic acid molecule (plasmid, chromosome or RNA virus), the median expression fold change, across all genes (x axis), is graphed versus nucleic acid sequence length. Vertical solid and dashed lines show mean and s.d. of the 16 native yeast chromosomes. Mitochondria (magenta star), two viruses (blue circle and green square) and the 2-micron plasmid (red triangle) show significantly stronger upregulation in slow cells compared with the 16 yeast chromosomes. (b) The number of RNA-seq errors was measured across the genome for three different experiments performed in three different labs. RNA-seq data from isogenic cells that differ only by their stochastic growth rate, the growth conditions, or have been grown in H2O2 for 30 min, were analysed to measure the amount per-nucleotide transcriptome variability in each condition. In all cases, slow-growing cells have more variability (t-test, P=0.013 for the H2O2 data, t-test P=0.004 for all the data combined. (c) To determine whether this effect is yeast specific, an identical genome-wide analysis was performed on RNA-seq data from C. elegans subjected to 0.5% O2 for 36 h. These hypoxia stressed nematodes also contain more errors in their transcriptomes. (d) More highly conserved genes (% amino acid identity across yeast species53) have lower RNA-seq error rates (average error rate across all experiments) suggesting a lower RNA polymerase II error rate (t-test, P<10−3). This is not a function of expression level; the correlation with amino-acid conservation is seen when looking at only the top 25% of genes by expression level (inset, P<10−6).

References

    1. Orr H. A. Fitness and its role in evolutionary genetics. Nat. Rev. Genet. 10, 531–539 (2009). - PMC - PubMed
    1. Kiviet D. J. et al.. Stochasticity of metabolism and growth at the single-cell level. Nature 514, 376–379 (2014). - PubMed
    1. Wakamoto Y. et al.. Dynamic persistence of antibiotic-stressed mycobacteria. Science 339, 91–95 (2013). - PubMed
    1. Balaban N. Q., Gerdes K., Lewis K. & McKinney J. D. A problem of persistence: still more questions than answers? Nat. Rev. Microbiol. 11, 587–591 (2013). - PubMed
    1. Fridman O., Goldberg A., Ronin I., Shoresh N. & Balaban N. Q. Optimization of lag time underlies antibiotic tolerance in evolved bacterial populations. Nature 513, 418–421 (2014). - PubMed

Publication types

MeSH terms