. 2015 Oct;89(20):10580-90.
doi: 10.1128/JVI.01799-15. Epub 2015 Aug 12.

Viral Source-Independent High Susceptibility of Dendritic Cells to Human T-Cell Leukemia Virus Type 1 Infection Compared to That of T Lymphocytes

Affiliations

Viral Source-Independent High Susceptibility of Dendritic Cells to Human T-Cell Leukemia Virus Type 1 Infection Compared to That of T Lymphocytes

Sandrine Alais et al. J Virol. 2015 Oct.

Abstract

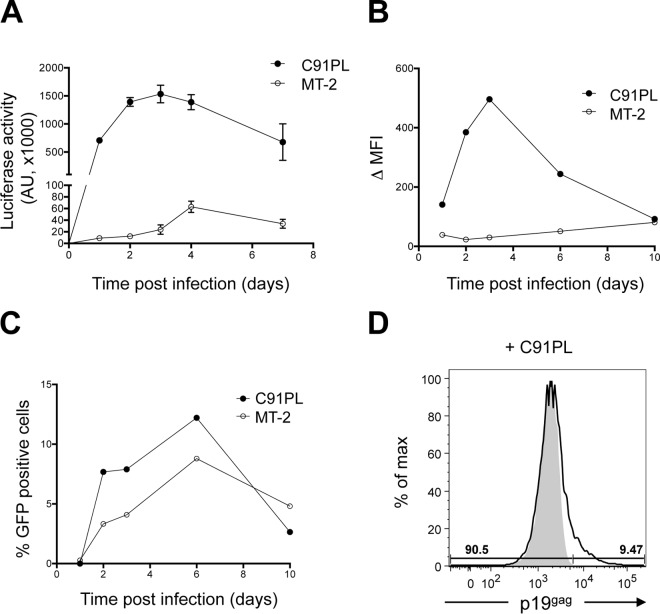
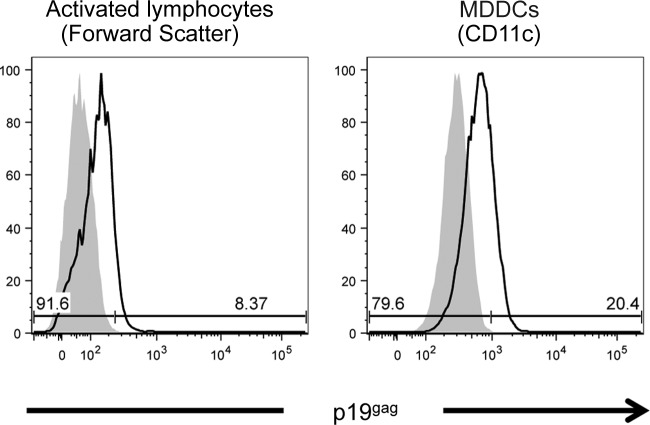
Human T-cell leukemia virus type 1 (HTLV-1)-infected CD4(+) T cells and dendritic cells (DCs) are present in peripheral blood from HTLV-1 carriers. While T-cell infection requires cell-cell contact, DCs might be infected with cell-free virus, at least in vitro. However, a thorough comparison of the susceptibilities of the two cell types to HTLV-1 infection using cell-associated and cell-free viral sources has not been performed. We first determined that human primary monocyte-derived dendritic cells (MDDCs) were more susceptible to HTLV-1 infection than their autologous lymphocyte counterparts after contact with chronically infected cells. Next, a comparison of infection efficiency using nonconcentrated or concentrated supernatants from infected cells as well as purified viral biofilm was performed. Integrated provirus was found after exposure of MDDCs or primary lymphocytes to viral biofilm but not to a viral supernatant. Using a large series of primary cell samples (n = 21), we demonstrated a higher proviral load in MDDCs exposed to viral biofilm than in lymphocytes. This higher susceptibility is correlated to a higher expression of neuropilin-1 on MDDCs than on autologous activated T lymphocytes. Moreover, we show that MDDCs infected with viral biofilm can transmit the virus to lymphocytes. In conclusion, MDDCs are more susceptible to HTLV-1 infection than autologous lymphocytes in vitro, supporting a model in which DC infection might represent an important step during primo-infection in vivo.

Importance: HTLV-1 is able to infect several cell types, but viral DNA is mainly found in T lymphocytes in vivo. This supports a model in which T lymphocytes are the main target of infection. However, during the primo-infection of new individuals, incoming viruses might first encounter dendritic cells (DCs), the specialized immune cells responsible for the antiviral response of the host. HTLV-1 cell-free purified viruses can infect dendritic cells in vitro, while T-cell infection is restricted to cell-to-cell transmission. In order to understand the sequence of HTLV-1 dissemination, we undertook a direct comparison of the susceptibilities of the two cell types using cell-associated and cell-free viral sources. We report here that MDDCs are more susceptible to HTLV-1 infection than autologous lymphocytes in vitro and are able to efficiently transmit the virus to lymphocytes. Our results suggest that DCs may represent a true viral reservoir, as the first cell type to be infected in vivo.


Figures

FIG 1
FIG 1
C91PL cells produce more infectious viral particles than MT-2 cells. (A) Jurkat-LTR-Luc cell infection after coculture with C91PL or MT-2 cells. The graph shows the means and the standard deviations from 3 independent experiments. (B) Time course infection of Jurkat-LTR-GFP cell infection after coculture with C91PL or MT-2 cells. Fluorescence intensity was measured by flow cytometry, and the difference in mean fluorescence intensity (Δ MFI) measured in uninfected and infected Jurkat-LTR-GFP cells was plotted over time. (C) Time course detection of GFP-positive cells after coculture with C91PL or MT-2 cells. (D) p19gag signal was measured in Jurkat-LTR-Luc cells after 3 days of coculture with C91PL cells. Jurkat-LTR-Luc cells were differentiated from C91PL cells based on their size. p19gag expression (solid line) was assessed in the Jurkat-LTR-Luc cell gated population. Noninfected Jurkat-LTR-Luc cells were used as a p19gag expression negative control (gray).
FIG 2
FIG 2
MDDCs are more susceptible than autologous activated primary lymphocytes to infection through cell-cell contact. Infection of MDDCs or activated lymphocytes was assessed by flow cytometry using p19gag antibody followed by anti-mouse-allophycocyanin staining after 3 days of coculture with C91PL cells. As a control, p19gag staining was also performed in the absence of coculture (gray). Lymphocyte infection was determined after gating on the lymphocyte population discriminated from the C91PL population based on its smaller size and lower granularity (left). Infection of MDDCs was determined after gating on CD11c expression (right).
FIG 3
FIG 3
Virus embedded in biofilm is more potent than cell-free virus for infection of T-lymphocytes. (A) Schematic representation of the experimental procedure. (B) Jurkat-LTR-Luc cells were exposed to biofilm, concentrated virus ([virus]), or supernatant (Sup) produced by C91PL cells. Luciferase activity was measured 3 days postexposure. Results were normalized according to the amount of p19gag present in each viral preparation. The median values from 15 independent experiments are indicated. Asterisks indicate statistically significant differences calculated using a paired t test: *, P < 0.1; ns, not significant. (C) Luciferase activity measured 24 h after coculture of Jurkat-LTR-luc cells with C91PL. The median values from 11 independent experiments are indicated. (D) Jurkat-LTR-Luc cells were exposed to freshly prepared biofilm or to a 3-day-old biofilm. Luciferase activity was measured after 3 days. The median values from 10 independent experiments are indicated. Asterisks indicate statistically significant differences calculated using a paired t test: ***, P < 0.001.
FIG 4
FIG 4
MDDCs are more susceptible to HTLV-1 infection with biofilm than activated primary lymphocytes. Primary activated lymphocytes (A) and MDDCs (B) were exposed to biofilm, concentrated virus ([virus]), or supernatant (Sup). Genomic DNA was extracted 3 days postinfection and analyzed by real-time PCR. The percentage of positive cells was normalized according to the amount of HTLV-1 p19gag present in each viral preparation. (C) The same results were plotted for each viral preparation. For panels A to C, the median values from 25 independent experiments obtained with 21 different blood donors are indicated. Asterisks indicate statistically significant differences calculated using a paired t test: ***, P < 0.001; ****, P < 0.0001; ns, not significant. (D) ALU-PCR was carried out on genomic DNA extracted from biofilm-exposed cells (lanes 1 and 4), concentrated virus-exposed cells (lanes 2 and 5), and viral supernatant-exposed cells (lanes 3 and 6). The length of the amplified gag sequence is shown on the right (arrow). DNA extracted from C91PL cells was used as a positive control (lane 8). Negative control, no DNA (lane 7). MW, molecular weight. (E) Results of the ALU-PCR analyses performed on genomic DNA extracted from cells from 5 different blood donors (donors 7, 10, 12, 23, and 30).
FIG 5
FIG 5
HTLV-1 infection of MDDCs and activated primary autologous lymphocytes. Primary activated lymphocytes (A) or autologous MDDCs (B) obtained from 21 different blood donors were incubated with biofilm (circles), concentrated supernatants ([virus]) (squares) or supernatant (Sup) (diamonds) for 3 days. Genomic DNA was extracted and real-time PCR performed. Data were normalized according to the p19gag amount present in each viral preparation used to infect the target cells. Results were plotted for each blood donor. Lines indicate experimental duplicates using donors 12 and 30 or a triplicate using donor 24.
FIG 6
FIG 6
HTLV-1-infected MDDCs transmit the virus to reporter T cells. (A) Schematic representation of the experimental procedure. (B) Real-time PCR performed on genomic DNA extracted from biofilm- or [virus]-exposed MDDCs. Results were normalized according to the amount of p19gag present in each viral preparation. The median values from 5 independent experiments obtained with 5 different blood donors are indicated. Asterisks indicate statistically significant differences calculated using a paired t test: *, P < 0.1; ns, not significant. (C) Luciferase activity was measured after coculture of reporter T cells with biofilm-exposed MDDCs. Noninfected reporter cells were used as a negative control (NI). The median values from 5 independent experiments obtained with 5 different blood donors are indicated. Asterisks indicate statistically significant differences calculated using a paired t test: **, P < 0.01; *, P < 0.1; ns, not significant. (D) Real-time PCR performed on genomic DNA extracts from biofilm-exposed MDDCs in the absence (black bars) or in presence (gray bars) of AZT. Results from independent experiments using cells from 3 different blood donors are represented as percentages of Tax-positive MDDCs in the absence of AZT. (E) Luciferase activity measured after coculture of reporter T cells with biofilm-exposed MDDCs in the absence (black bars) or in presence (gray bars) of AZT. Results from independent experiments using cells from 3 different blood donors are represented as percentages of the luciferase activity obtained with MDDCs in the absence of AZT.
FIG 7
FIG 7
HTLV-1 receptor expression in Jurkat-LTR-Luc cells, primary activated lymphocytes, and MDDCs. Cells were labeled with fluorochrome-coupled antibodies (black lines) directed against hGlut-1 (A) or NRP-1 (B). Unstained cells were used as negative controls (solid gray). Flow cytometry analysis was performed using FACSCanto II. Quantification of the mean fluorescence intensity was performed using FlowJo software and is presented on the right as the difference in mean fluorescence intensity detected in stained versus unstained cells.

References

    1. Gessain A, Cassar O. 2012. Epidemiological aspects and world distribution of HTLV-1 infection. Front Microbiol 3:388. - PMC - PubMed
    1. Yodoi J, Maeda M. 2011. Discovery of ATL: an odyssey in restrospect [sic]. Int J Hematol 94:423–428. doi:10.1007/s12185-011-0957-x. - DOI - PubMed
    1. Gessain A, Barin F, Vernant J, Gout O, Maurs L, Calender A, de Thé G. 1985. Antibodies to human T-lymphotropic virus type-I in patients with tropical spastic paraparesis. Lancet ii:407–410. - PubMed
    1. Osame M, Igata A, Matsumoto M, Izumo S, Usuku K, Rosales RL, Tara M. 1988. HTLV-1 associated myelopathy (HAM). Kansenshogaku Zasshi 62(Suppl):240–248. - PubMed
    1. Makino M, Wakamatsu S, Shimokubo S, Arima N, Baba M. 2000. Production of functionally deficient dendritic cells from HTLV-I-infected monocytes: implications for the dendritic cell defect in adult T cell leukemia. Virology 274:140–148. doi:10.1006/viro.2000.0445. - DOI - PubMed

Publication types

MeSH terms