. 2015 Nov;89(21):10786-801.
doi: 10.1128/JVI.01432-15. Epub 2015 Aug 12.

Increased Immune Response Variability during Simultaneous Viral Coinfection Leads to Unpredictability in CD8 T Cell Immunity and Pathogenesis

Affiliations

Increased Immune Response Variability during Simultaneous Viral Coinfection Leads to Unpredictability in CD8 T Cell Immunity and Pathogenesis

Laurie L Kenney et al. J Virol. 2015 Nov.

Abstract

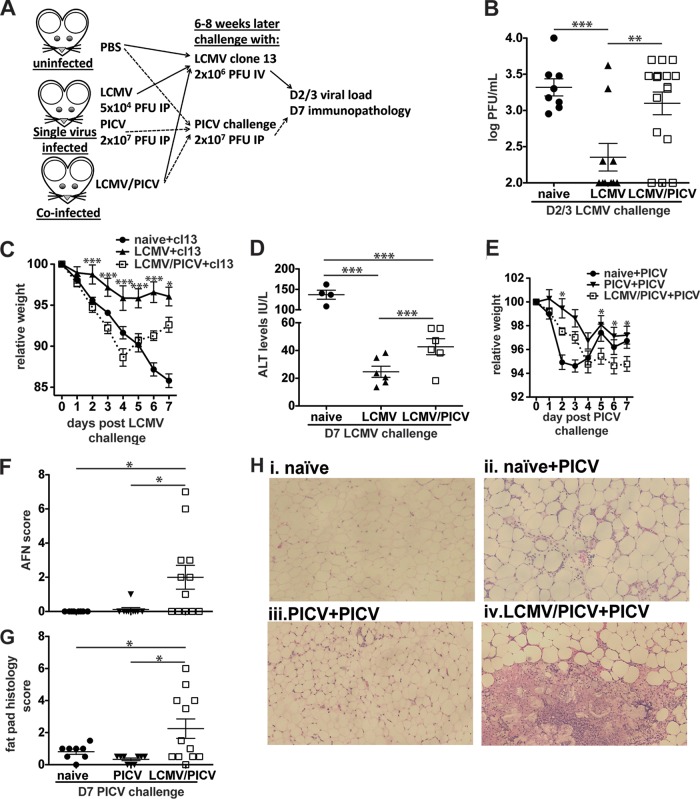
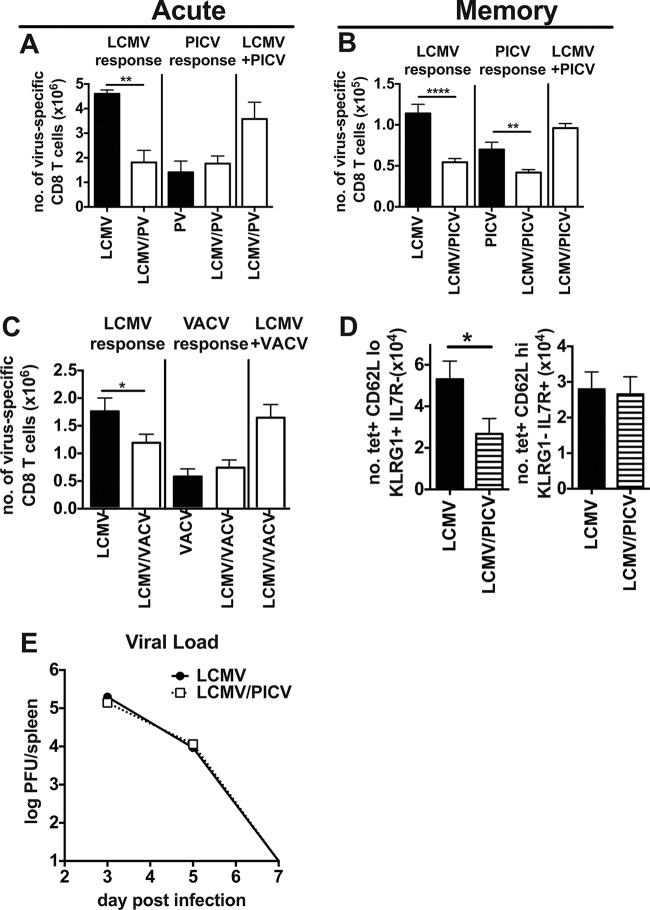
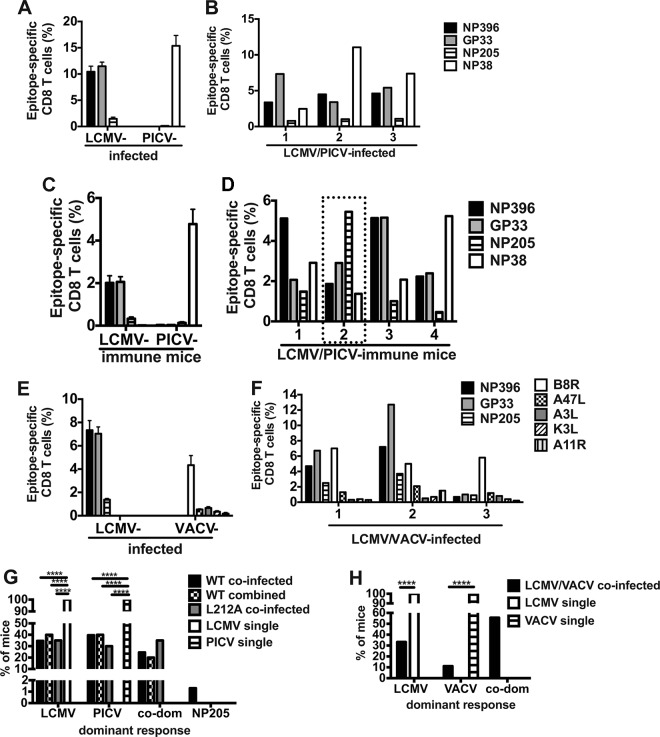
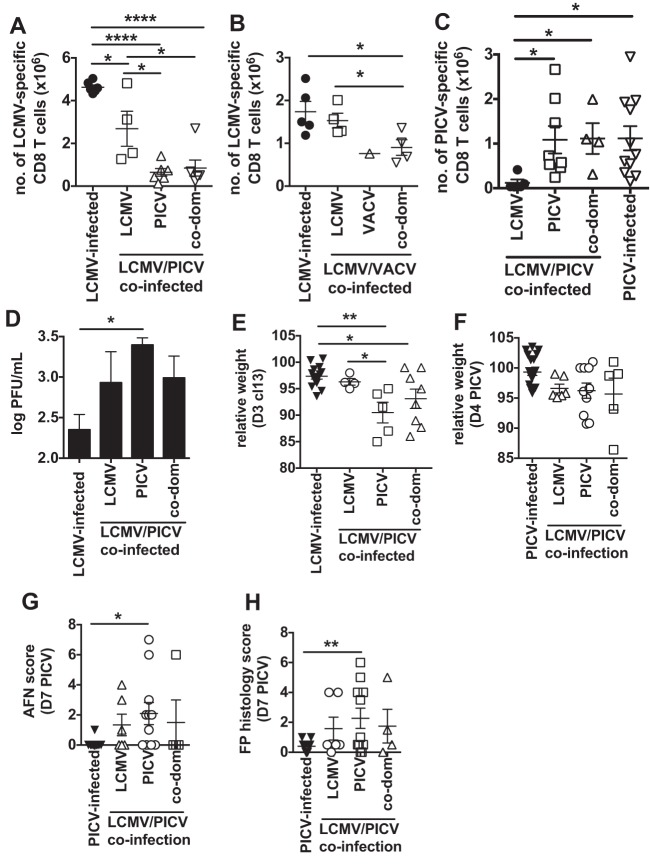
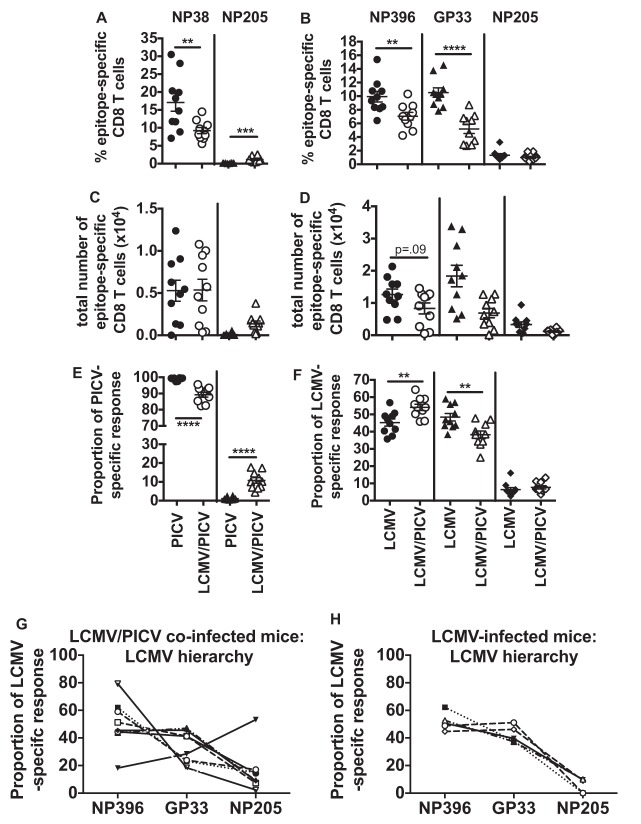
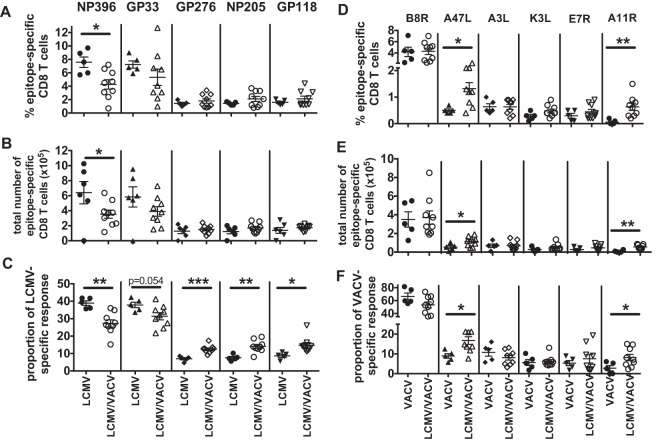
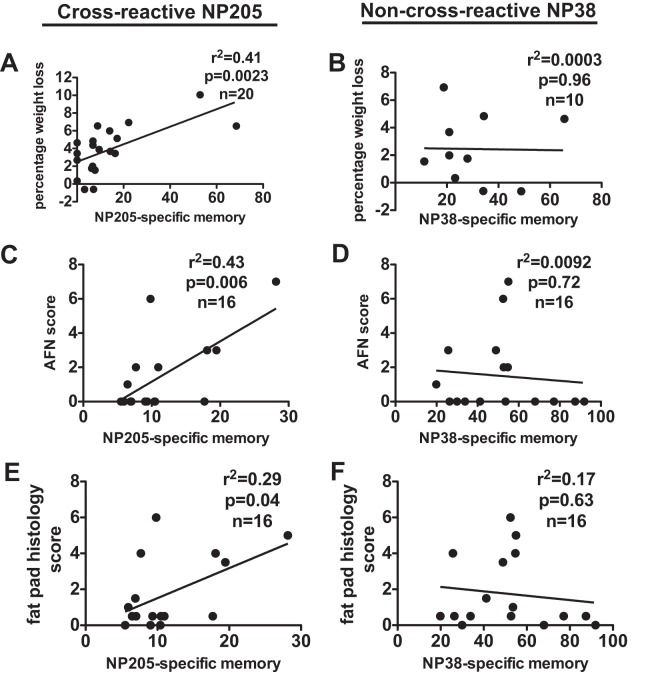
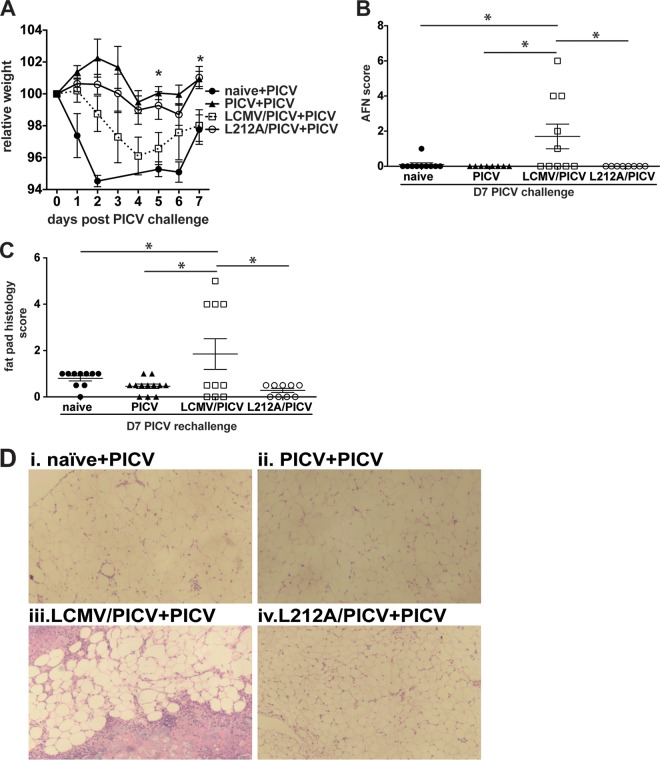
T cell memory is usually studied in the context of infection with a single pathogen in naive mice, but how memory develops during a coinfection with two pathogens, as frequently occurs in nature or after vaccination, is far less studied. Here, we questioned how the competition between immune responses to two viruses in the same naive host would influence the development of CD8 T cell memory and subsequent disease outcome upon challenge. Using two different models of coinfection, including the well-studied lymphocytic choriomeningitis (LCMV) and Pichinde (PICV) viruses, several differences were observed within the CD8 T cell responses to either virus. Compared to single-virus infection, coinfection resulted in substantial variation among mice in the size of epitope-specific T cell responses to each virus. Some mice had an overall reduced number of virus-specific cells to either one of the viruses, and other mice developed an immunodominant response to a normally subdominant, cross-reactive epitope (nucleoprotein residues 205 to 212, or NP205). These changes led to decreased protective immunity and enhanced pathology in some mice upon challenge with either of the original coinfecting viruses. In mice with PICV-dominant responses, during a high-dose challenge with LCMV clone 13, increased immunopathology was associated with a reduced number of LCMV-specific effector memory CD8 T cells. In mice with dominant cross-reactive memory responses, during challenge with PICV increased immunopathology was directly associated with these cross-reactive NP205-specific CD8 memory cells. In conclusion, the inherent competition between two simultaneous immune responses results in significant alterations in T cell immunity and subsequent disease outcome upon reexposure.

Importance: Combination vaccines and simultaneous administration of vaccines are necessary to accommodate required immunizations and maintain vaccination rates. Antibody responses generally correlate with protection and vaccine efficacy. However, live attenuated vaccines also induce strong CD8 T cell responses, and the impact of these cells on subsequent immunity, whether beneficial or detrimental, has seldom been studied, in part due to the lack of known T cell epitopes to vaccine viruses. We questioned if the inherent increased competition and stochasticity between two immune responses during a simultaneous coinfection would significantly alter CD8 T cell memory in a mouse model where CD8 T cell epitopes are clearly defined. We show that some of the coinfected mice have sufficiently altered memory T cell responses that they have decreased protection and enhanced immunopathology when reexposed to one of the two viruses. These data suggest that a better understanding of human T cell responses to vaccines is needed to optimize immunization strategies.


Figures

FIG 1
FIG 1
LCMV/PICV-coinfected mice had significantly increased viral loads and immunopathology after challenge. (A) Naive mice were infected with LCMV (Armstrong strain at 5 × 10⁴ PFU i.p.), PICV (2 × 10⁷ PFU i.p.), or both simultaneously. After at least 6 weeks mice were considered immune and challenged with either CL-13 or PICV. Viral loads were determined on days 2 to 3 (D2/3) postchallenge, and immunopathology was assessed on day 7 (D7). (B to D) Naive, LCMV-infected, and LCMV/PICV-coinfected mice were challenged with 2 × 10⁶ PFU of CL-13 i.v. (B) Viral loads were determined in serum at days 2 to 3 postchallenge. Data were pooled from three similar experiments. (C) Mice were weighed daily, and relative weight was calculated from day 0 (n = 3 to 8 mice/group). Data are representative of three similar experiments. Statistics compare LCMV-infected and LCMV/PICV-coinfected mice. (D) ALT levels were determined at day 7 post-CL-13 challenge in serum. Data were pooled from two similar experiments. (E to H) Naive, PICV-infected, and coinfected mice were challenged with 2 × 10⁷ PFU of PICV i.p. (E) Mice were weighed daily, and relative weight was calculated from day 0 (n = 7 to 12 mice/group). Statistics show differences between PICV-infected and coinfected mice. Data were pooled from two similar experiments. The AFN score of abdominal/epididymal fat pad (F) and fat pad histopathology scores (G) were determined at day 7 post-PICV challenge. Data were pooled from two similar experiments. (H) Fat pad sections from naive, naive PICV-challenged (naive+PICV) mice, PICV-infected PICV-challenged (PICV+PICV) mice, and coinfected PICV-challenged (LCMV/PICV+PICV) mice were stained with H&E at day 7 of PICV-challenge. Naive mice showed normal fat pad structure, naive+PICV mice showed focal patches of mononuclear infiltrates, PICV+PICV mice showed mild mononuclear infiltrates around the periphery, and LCMV/PICV+PICV mice showed severe necrosis of up to 50% of the fat pad. *, P < 0.05; **, P < 0.01;***, P < 0.001.
FIG 2
FIG 2
Coinfected mice had smaller LCMV-specific CD8 T cell responses after primary infection. On day 8 (A) and 8 weeks postinfection (B) total numbers of virus-specific CD8 T cells were determined based on IFN-γ production in an ICS assay to multiple virus-specific epitopes in LCMV-, PICV-, and LCMV/PICV-infected mice. The total LCMV or PICV response represents summation of well-described LCMV or PICV epitope-specific responses for each virus. LCMV+PICV responses represent the summation of responses for the two viruses in coinfected mice. For the experiment shown in panel A, n = 3 to 4 mice/group; data are representative of three similar experiments. For the experiment shown in panel B, n = 10 mice/group; data were pooled from two similar experiments. (C) Day 7 postinfection total numbers of virus-specific CD8 T cells were determined for LCMV-, VACV-, and LCMV/VACV-infected mice (n = 5 to 9 mice/group). Data are from two similar experiments pooled. (D) The total number of LCMV-specific CD8 T cells was calculated for CD62Llo KLRG1+ IL7R cells and CD62Lhi KLRG1 IL7R+ cells at 8 weeks postinfection in LCMV/PICV-coinfected mice (n = 10 mice/group). Data are pooled from two similar experiments. tet, tetramer. (E) Splenic viral load was determined by INT-stained plaque assay in LCMV-infected and LCMV/PICV-coinfected mice after primary infection (n = 4 to 5 mice/group/time point). Data are representative of two similar experiments. *, P < 0.05; **, P < 0.01; ****, P < 0.0001.
FIG 3
FIG 3
Coinfected mice have variability in which virus-specific or cross-reactive responses dominated the CD8 T cell response. CD8 T cell immunodominance hierarchies were determined on either day 7 to 8 (A, B, E, and F) or day 42 (B and C) postinfection on lymphocytes isolated from spleen or peripheral blood by ICS assay for IFN-γ production. (A) LCMV- or PICV-infected mice (n = 25 mice/group from five similar experiments). (B) Three individual LCMV/PICV-coinfected mice representative of immunodominance patterns observed in four similar experiments. (C) Memory frequencies of epitope-specific CD8 T cells in LCMV- or PICV-immune mice (n = 25 mice/group from five similar experiments). (D) Four individual LCMV/PICV-coinfected mice representative of immunodominance patterns observed 8 weeks postinfection in 15 similar experiments. (E) LCMV- or VACV-infected mice (n = 5 mice/group from two similar experiments). (F) Three individual LCMV/VACV-coinfected mice representative of immunodominance patterns observed in two similar experiments. (G) The frequency of mice that had a dominant LCMV-specific, PICV-specific, codominant LCMV- and PICV-specific (co-dom), or cross-reactive NP205-specific CD8 T cell response. Wild-type (WT)-coinfected mice, n = 164 from 15 similar experiments; wild-type combined infection (wild-type viruses were combined in the same injection) n = 15 from 2 similar experiments; L212A-coinfected mice, n = 20 from 4 similar experiments; LCMV single and PICV single infections, n = 20 (each) from 4 similar experiments. (H) The frequency of mice that had a dominant LCMV-specific, VACV-specific, or codominant (co-dom) LCMV- and VACV-specific CD8 T cell response. LCMV/VACV-coinfected mice, n = 5 to 9 from two similar experiments; LCMV single and VACV single infections, n = 20 (each) from 4 similar experiments.
FIG 4
FIG 4
In coinfected mice the dominating virus-specific response correlates with the total number of virus-specific CD8 T cells and immunopathology after CL-13 challenge. (A) The total number of LCMV-specific CD8 T cells for LCMV/PICV-coinfected mice that were categorized by the dominance of their CD8 T cell response into LCMV-, PICV-, or codominant (co-dom) and compared with responses of LCMV-infected mice (n = 4 to 7 mice/group from 2 similar experiments). (B) The total number of LCMV-specific CD8 T cells for LCMV/VACV-coinfected mice that were categorized by the dominance of their CD8 T cell response into LCMV-, VACV-, or codominant compared with responses of LCMV-infected mice (n = 1 to 5 mice/group from 2 similar experiments). (C) The total number of PICV-specific CD8 T cells for LCMV/PICV-coinfected mice that were categorized by their dominating CD8 T cell response into LCMV-, PICV-, or codominant compared with responses of PICV-infected mice (n = 4 to 10 mice/group from 3 similar experiments). (D and E) Serum viral load on day 2 to 3 post-CL-13 challenge (D) and weight loss on day 3 postchallenge (E) of LCMV/PICV-coinfected mice that were LCMV-, PICV-, or codominant compared with responses of LCMV-infected mice during CL-13 challenge (n = 4 to 12 mice/group from 3 similar experiments). (F to H) Immunopathology of LCMV/PICV-coinfected mice that were LCMV-, PICV-, or codominant compared with responses of PICV-infected mice during PICV challenge. (F) Weight loss. (G) AFN score. (H) Fat pad (FP) histology score (n = 5 to 18 mice/group from 4 similar experiments). *, P < 0.05; **, P < 0.01; ****, P < 0.0001.
FIG 5
FIG 5
LCMV/PICV-coinfected mice had increased private specificity with new predictable intravirus-specific immunodominance hierarchies. Peripheral blood lymphocytes were isolated from LCMV-infected, PICV-infected, and LCMV/PICV-coinfected mice at least 6 weeks post-primary infection, and immunodominance was determined by IFN-γ production. (A and B) Epitope-specific CD8 T cell responses for PICV (A) and LCMV (B) directly comparing responses in single-virus-infected mice with those in coinfected mice. (C and D) The total number of virus-specific CD8 T cells was determined for PICV (C) and LCMV (D). (E and F) The epitope-specific proportional responses were determined for PICV and LCMV (n = 9 to 10 mice/group from two similar experiments pooled). (G and H) The LCMV-specific proportional response for a representative experiment using LCMV/PICV-coinfected and LCMV-infected mice illustrates the intraviral variability. **, P < 0.01; ****, P < 0.0001.
FIG 6
FIG 6
LCMV/VACV-coinfected mice have altered immunodominance hierarchies and overall increased frequencies of cross-reactive CD8 T cells. Splenocytes were isolated from LCMV-infected, VACV-infected, and LCMV/VACV-coinfected mice, and immunodominance hierarchies were determined by IFN-γ production on day 7 postinfection. (A and D) Epitope-specific CD8 T cell responses for LCMV (A) and VACV (D) directly comparing single-virus-infected mice with coinfected mice. (B and E) Total numbers of epitope-specific CD8 T cell responses for LCMV (B) and VACV (E). (C and F) The proportional response for each epitope was determined for LCMV (C) and VACV (F). *, P < 0.05; **, P < 0.01; ***, P < 0.001 (n = 5 to 9 mice/group from two similar experiments pooled).
FIG 7
FIG 7
NP205-specific memory proportions prior to PICV challenge directly correlated with severity of immunopathology in LCMV/PICV-coinfected mice after PICV challenge. Linear regression analyses comparing the proportion of memory cells specific to the cross-reactive NP205 or the non-cross-reactive NP38 epitope to the severity of disease as indicated by percentage of weight loss (A and B), AFN score (C and D), or fat pad histopathology score (E and F) in LCMV/PICV-coinfected mice.
FIG 8
FIG 8
NP205 memory response mediates immunopathology in LCMV/PICV-coinfected mice during PICV challenge. Naive, PICV-, wild-type LCMV/PICV-, and L212A/PICV-immune mice were challenged with 2 × 10⁷ PFU PICV i.p. (A) Mice were weighed daily, and relative weight was calculated from day 0 (n = 7 to 10 mice/group). Data are from two similar experiments pooled. Statistics show differences between wild-type- and L212A-coinfected mice. AFN score of fat pads (B) and fat pad histopathology scores (C) were determined at day 7 post-PICV challenge. Data are from two similar experiments pooled. (D) Fat pad sections were stained with H&E. Results after PICV challenge were as follows: naive mice (naive+PICV) showed focal patches of mononuclear infiltrate, PICV-immune mice challenged with PICV (PICV+PICV) showed very mild mononuclear infiltrate, wild-type LCMV/PICV-immune mice challenged with PICV (LCMV/PICV+PICV) showed severe necrosis, and L212A/PICV-immune mice challenged with PICV (L212A/PICV+PICV) displayed mild mononuclear infiltration. *, P < 0.05.

References

    1. Lam KS, Marshall ID. 1968. Dual infections of Aedes aegypti with arboviruses. I. Arboviruses that have no apparent cytopathic effect in the mosquito. Am J Trop Med Hyg 17:625–636. - PubMed
    1. Chamberlain RW, Sudia WD. 1957. Dual infections of eastern and western equine encephalitis viruses in Culex tarsalis. J Infect Dis 101:233–236. doi:10.1093/infdis/101.3.233. - DOI - PubMed
    1. Bharaj P, Chahar HS, Pandey A, Diddi K, Dar L, Guleria R, Kabra SK, Broor S. 2008. Concurrent infections by all four dengue virus serotypes during an outbreak of dengue in 2006 in Delhi, India. Virol J 5:1. doi:10.1186/1743-422X-5-1. - DOI - PMC - PubMed
    1. Esper FP, Spahlinger T, Zhou L. 2011. Rate and influence of respiratory virus co-infection on pandemic (H1N1) influenza disease. J Infect 63:260–266. doi:10.1016/j.jinf.2011.04.004. - DOI - PMC - PubMed
    1. Palacios G, Hornig M, Cisterna D, Savji N, Bussetti AV, Kapoor V, Hui J, Tokarz R, Briese T, Baumeister E, Lipkin WI. 2009. Streptococcus pneumoniae coinfection is correlated with the severity of H1N1 pandemic influenza. PLoS One 4:e8540. doi:10.1371/journal.pone.0008540. - DOI - PMC - PubMed

Publication types