. 2015 Sep;5(9):932-43.
doi: 10.1158/2159-8290.CD-15-0012. Epub 2015 Aug 12.

Real-Time Imaging Reveals Local, Transient Vascular Permeability, and Tumor Cell Intravasation Stimulated by TIE2hi Macrophage-Derived VEGFA

Affiliations

Real-Time Imaging Reveals Local, Transient Vascular Permeability, and Tumor Cell Intravasation Stimulated by TIE2hi Macrophage-Derived VEGFA

Allison S Harney et al. Cancer Discov. 2015 Sep.

Abstract

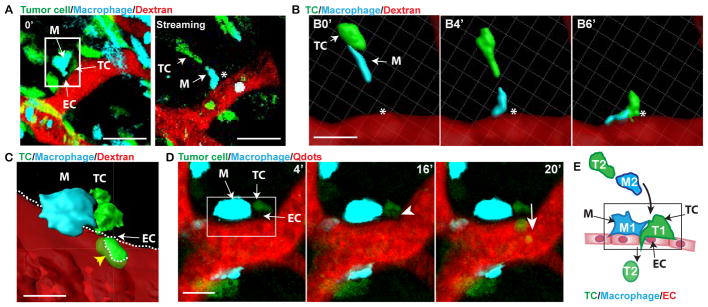
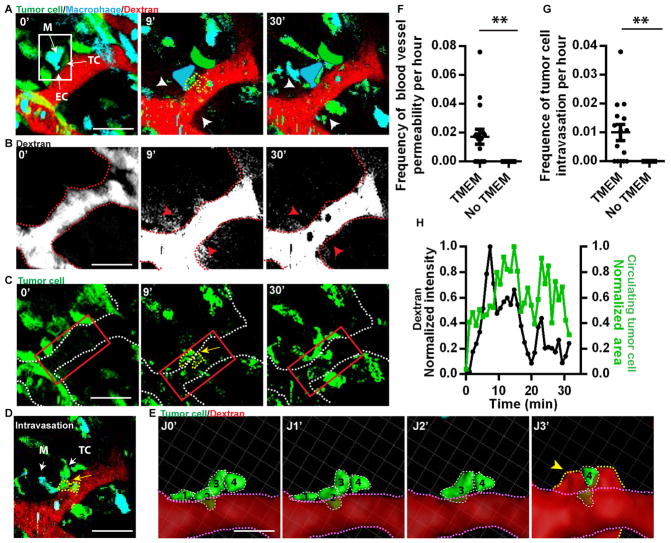
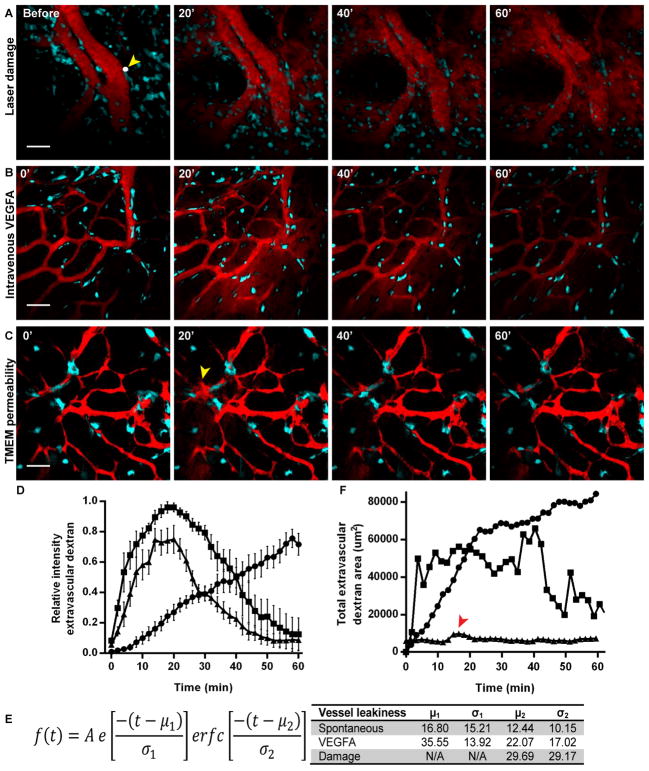
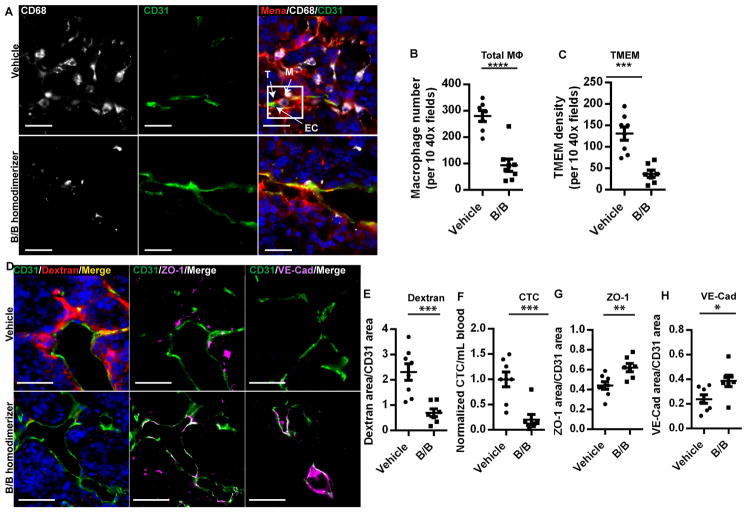
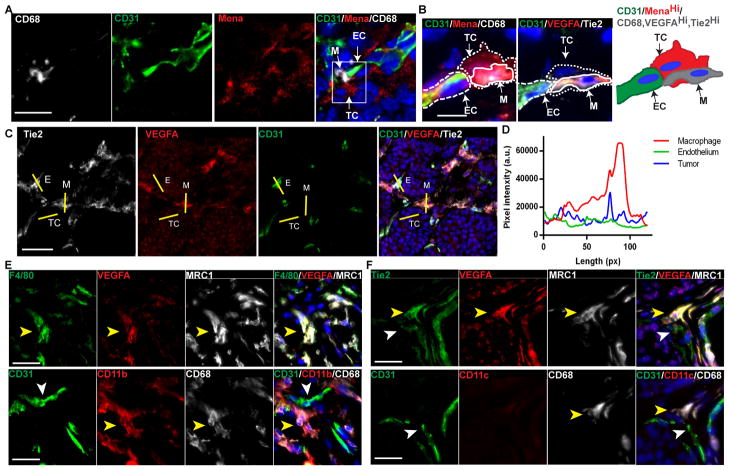
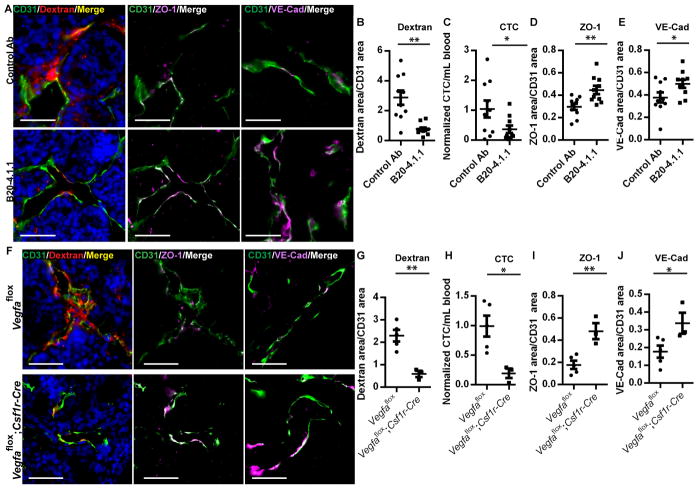
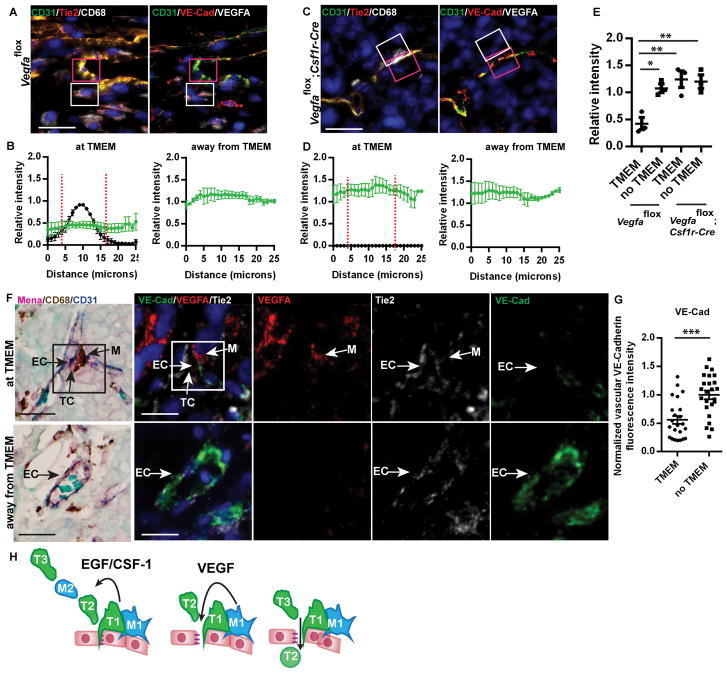
Dissemination of tumor cells is an essential step in metastasis. Direct contact between a macrophage, mammalian-enabled (MENA)-overexpressing tumor cell, and endothelial cell [Tumor MicroEnvironment of Metastasis (TMEM)] correlates with metastasis in breast cancer patients. Here we show, using intravital high-resolution two-photon microscopy, that transient vascular permeability and tumor cell intravasation occur simultaneously and exclusively at TMEM. The hyperpermeable nature of tumor vasculature is described as spatially and temporally heterogeneous. Using real-time imaging, we observed that vascular permeability is transient, restricted to the TMEM, and required for tumor cell dissemination. VEGFA signaling from TIE2(hi) TMEM macrophages causes local loss of vascular junctions, transient vascular permeability, and tumor cell intravasation, demonstrating a role for the TMEM within the primary mammary tumor. These data provide insight into the mechanism of tumor cell intravasation and vascular permeability in breast cancer, explaining the value of TMEM density as a predictor of distant metastatic recurrence in patients.

Significance: Tumor vasculature is abnormal with increased permeability. Here, we show that VEGFA signaling from TIE2(hi) TMEM macrophages results in local, transient vascular permeability and tumor cell intravasation. These data provide evidence for the mechanism underlying the association of TMEM with distant metastatic recurrence, offering a rationale for therapies targeting TMEM.


Conflict of interest statement

Conflicts of interest: The authors acknowledge the following financial relationships: Consultant and stockholder of MetaStat, Inc. (Boston, MA) (JGJ and JSC); Consultant of MetaStat (MHO, DE); Consultant of Deciphera Pharmaceuticals, LLC (Cambridge, MA) (JSC); (ASH, and YW) Sponsored research agreement with Deciphera. Neither MetaStat nor Deciphera contributed financial resources and reagents to this paper. The other authors disclose no potential conflicts of interest.

Figures

Fig. 1
Fig. 1. Motile tumor cells intravasate at TMEM
(A) Time 0′ in the left panel indicating TMEM (white box) from time-lapse IVM. Macrophages (M, cyan), Tumor cells (TC, green) and blood vessels (155 kDa Dextran-TMR (red)). Right panel is a single time point from time lapse of tumor cell and macrophage streaming towards non-migratory TMEM (asterisk, TMEM position from left panel). Streams and TMEM are in different focal planes. Scale bar, 50 μm. (B) 3D reconstruction of time-lapse IVM from (A) of TC and macrophage streaming towards TMEM (asterisk). Scale bar, 20 μm. (C) 3D reconstruction of TC intravasation (yellow arrowhead) at TMEM (luminal surface of the endothelium dashed white line). (D) IVM time-lapse of tumor cell intravasation at TMEM (white box in 4′ panel containing stationary TMEM-Macrophage (M), -Tumor cell (TC) and -endothelial cell boundary (EC)(arrows)). A non-TMEM TC arrives at TMEM (arrowhead in panel 16′) and undergoes transendothelial migration (arrow in panel 20′) while TMEM-macrophage and -TC remain immobile. Scale bar = 10 μm. (E) Schematic summary diagram of panels A–D where TC (green, T2) and macrophage (blue, M2) stream towards non-migratory TMEM (black box, T1 and M1), where the TC (T2) undergoes transendothelial migration.
Fig. 2
Fig. 2. Transient, local blood vessel permeability events accompany intravasation, at TMEM
(A) IVM time-lapse of 155 kDa dextran-TMR extravasation and tumor cell intravasation. TMEM (white box). Blood vessel permeability sites (white arrows) and intravasating TC (yellow dashed line, 9′). Clearance of dextran and decrease of CTC at 30′. Scale bar, 50 μm. At 9′ and 30′ TMEM tumor cells and macrophages are added in false color to increase visibility after bleaching. (B) Isolated 155 kDa dextran-TMR channel from (A). Red arrows mark dextran extravasation (white). Dashed red line indicates the luminal side of the endothelium. (C) Isolated tumor cell channel from (A). Yellow arrowhead marks site of intravasating TC (yellow dashed line) at TMEM. White dashed line marks the luminal surface of the endothelium. Red box indicates the region adjacent to TMEM with elevated CTC. (D) Single time point of tumor cell intravasation (yellow dashed line) by time-lapse IVM. Scale bar, 50 μm. (E) 3D reconstruction of time-lapse IVM from (D) of tumor cell intravasation at TMEM. Transmigrating tumor cells (individually numbered, dashed white lines) are isolated from other cell types for clarity with time in minutes from start (J0′) to end of transmigration (J3′). The luminal endothelial surface is outlined in a pink dashed line. Extravascular dextran (red) at TMEM indicated with a yellow arrowhead and outlined in a yellow dashed line. (F) Frequency of blood vessel permeability events in the presence of TMEM or away from TMEM in 100 μm windows (See fig. S4) (n = 16, **, P = 0.0034). (G) Frequency of tumor cell intravasation events in the presence of TMEM or away from TMEM in 100 μm windows (n = 16, **, P = 0.0012). (H) Quantification of extravascular dextran intensity and CTC area at TMEM over time from (A). (●) Extravascular dextran, (■) CTC.
Fig. 3
Fig. 3. TMEM-mediated vascular permeability is transient and localized
(A) Time lapse imaging demonstrates that laser-induced damage to the endothelium creates a hole allowing for extravasation of 155 kDa dextran-TMR. The location of the hole is marked by a white dot (2 μm) and a yellow arrowhead. 155 kDa dextran-TMR extravasates and increases over time up to 60′ filling the field of view and not clearing from the tissue (n = 4). Scale bar, 50 μm. (B) 155 kDa dextran-TMR is injected by tail vein i.v. catheter followed by 8 μg of VEGFA165 at 0′. VEGFA165 induces blood vessel permeability in all of the blood vessels in the field of view. Peak extravascular dextran is observed at 20′ followed by clearance by 60′ after resealing of vascular junctions (n = 4). Scale bar, 50 μm. (C) Spontaneous vascular permeability at TMEM is both transient and local. Local peak extravasation of 155 kDa dextran-TMR occurs after 20′ (yellow arrowhead) and clears within 60′ (n = 11). Scale bar, 50 μm. (D) Quantification of average relative intensity of extravascular 155 kDa dextran-TMR after (●) laser damage (n = 4), (■) intravenous VEGFA165 n = 4 and (▲) spontaneous permeability (n =11). (E) Table of parameters from curve fitting to an Exponentially Modified Gaussian function using data from (D). (F) Quantification of total extravascular 155 kDa dextran-TMR area after laser-induced damage, i.v. injection of VEGFA165 or spontaneous permeability at TMEM from individual animals represented in (A), (B) and (C). Peak of 155 kDa dextran-TMR area in spontaneous permeability at TMEM indicated with a red arrowhead. (●) laser damage, (■) intravenous VEGFA165 and (▲) spontaneous vascular permeability at TMEM.
Fig. 4
Fig. 4. Macrophage depletion reduces vascular permeability and tumor cell intravasation
(A) Immunofluorescence imaging of tumor sections stained for TMEM. Vasculature (CD31, green), tumor cells (Mena, red) and macrophages (CD68, gray) and DAPI (blue). TMEM are outlined in a white box. Scale bar, 20 μm. (B) Quantification of total CD68+ macrophages in tumor tissue (****, P < 0.0001), (C) in TMEM (***, P = 0.0003). (D) Immunfluorescence imaging of tumor sections stained for vasculature (CD31, green), 155 kDa dextran-TMR (red) and DAPI (blue), ZO-1 (magenta) or VE-Cadherin (magenta) as indicated demonstrating changes in vascular permeability by extravascular dextran and vascular junction staining. Scale bar, 50 μm. (E) Quantification of extravascular 155 kDa dextran-TMR from (D) (vehicle n = 7, B/B homodimerizer n = 8; ***, P = 0.0009) (F) circulating tumor cells (***, P = 0.0007) (G) Vascular ZO-1 from (D) (**, P = 0.006) and (H) Vascular VE-Cadherin from (D) (* P = 0.02).
Fig. 5
Fig. 5. Tie2Hi/VEGFAHi TEMs are present in TMEM
(A) Immunofluorescence imaging of TMEM. Macrophages (CD68, gray), blood vessels (CD31, green), tumor cells (Mena, red), and DAPI (blue). TMEM in white box (right panel). Scale bar, 15 μm. (B) Immunofluorescence imaging of VEGFAHi macrophages in TMEM in sequential sections. Scale bar, 10 μm. Tumor cell, spotted line; macrophages, solid line; and blood vessels, dashed line. Left panel: Macrophages (CD68, gray), tumor cells (Mena, red), blood vessels (CD31, green), and DAPI (blue). Sequential section (center panel): VEGFA (red), Tie2 (gray), blood vessels (CD31, green), and DAPI (blue). Schematic representation (right panel) of protein expression in TMEM; tumor cells with MenaHi (red), endothelial cells CD31 (green) and macrophages CD68, VEGFAHi and Tie2Hi (gray). M, macrophage; TC, tumor cell; and EC, endothelial cell. (C) Immunofluorescence images of Tie2, VEGFA and CD31. Yellow lines indicate regions of intensity profiling of VEGFA intensity for CD31 (EC), macrophage (M) and tumor tissue (TC). Scale bar, 25 μm. (D) Fluorescence intensity profile of VEGFA from (C) of macrophage, endothelial cell and tumor tissue. (E) Immunofluorescence imaging of sequential PyMT tumor sections for TEM markers. VEGFAHi TMEM macrophages express F4/80, MRC1, CD11b and CD68 as indicated by a yellow arrowhead in sequential sections. CD31+ endothelium is indicated by a white arrowhead. (F) VEGFAHi TMEM macrophages express Tie2, MRC1, and CD68 but not CD11c as indicated by a yellow arrowhead. CD31+/Tie2+ endothelium is indicated by a white arrowhead. Scale bar, 25 μm.
Fig. 6
Fig. 6. Inhibition of VEGFA or macrophage-specific ablation of Vegfa from Tie2Hi/VEGFAHi TMEM macrophages reduces vascular permeability and tumor cell intravasation
(A) Immunfluorescence imaging of tumor sections after blocking VEGFA with anti-VEGFA blocking antibody (B20-4.1.1). Tumors are stained for vasculature (CD31, green), 155 kDa dextran-TMR (red) and DAPI (blue), ZO-1 (magenta) or VE-Cadherin (magenta) as indicated demonstrating changes in vascular permeability by extravascular dextran and vascular junction staining. Scale bar, 50 μm. (B) Quantification of extravascular 155 kDa dextran-TMR from (A) and (n = 10; **, P = 0.0015) (C) circulating tumor cells (*, P = 0.0497), (D) Vascular ZO-1 from (A) (**, P = 0.005) and (E) Vascular VE-Cadherin from (A) (*, P = 0.0463). (F) Immunfluorescence of tumor sections stained for vasculature (CD31, green), 155 kDa dextran-TMR (red) and DAPI (blue), ZO-1 (magenta) or VE-Cadherin (magenta) as indicated demonstrating changes in vascular permeability after ablation of Vegfa by extravascular dextran and vascular junction staining. Scale bar, 50 μm. (G) Quantification of extravascular 155 kDa dextran-TMR from (F) and (Vegfaflox n = 5, Vegfaflox;Csf1r-Cre n = 3; **; P = 0.0029) (H) circulating tumor cells (*, P = 0.0177) (I) Vascular ZO-1 from (F) (**, P = 0.0054) and (J) Vascular VE-Cadherin from (F) (*, P = 0.0457).
Fig. 7
Fig. 7. Macrophage-specific ablation of Vegfa in PyMT implant tumors blocks blood vessel permeability and tumor cell intravasation at TMEM
(A, C) Immunofluorescence of tumor sections stained for the presence of vascular junction proteins at TMEM macrophages. Tumor sections are stained for VE-cadherin (red), CD31 and VEGFA (gray). Sequential sections are stained for CD31 (green), Tie2 (red) and CD68 (gray). (A) Control tumors (Vegfaflox) or (C) after ablation of Vefga (Vegfaflox;Csf1r-Cre). CD68+ macrophage in TMEM outlined in white box, adjacent endothelium in TMEM in pink box. Yellow indicates merged signal of CD31 and Tie2 (left) or CD31 and VE-Cadherin (right). Decreased VE-Cadherin at TMEM (F, right) seen as decreased VE-Cadherin, resulting in green (CD31) at vascular junction. Scale bar, 15 μm. (B, D) Quantification of the relative intensity of VEGFA or vascular junction proteins (ratio of VE-cadherin to CD31 in blood vessels) in (A and C) at TMEM or away from TMEM in (B) control tumors (Vegfaflox) or (D) after ablation of Vegfa in Vegfaflox;Csf1r-Cre tumors along 25 μm lengths of blood vessel (n = 3). (●) Relative fluorescence intensity of VE-Cadherin/CD31, (■) Relative VEGFA intensity. Red dashed line indicates the presence of a CD68+ macrophage. (E) Quantification of average pixel intensity of VE-Cadherin/CD31immunofluorescence staining in 25 μm lengths of blood vessel at TMEM or away from TMEM in the presence of VEGFAHi macrophages (Vegfaflox , n = 3) or after macrophage-specific ablation of Vegfa (Vegfaflox;Csf1r-Cre, n = 3) from data in B and D. Post-ANOVA comparisons with significant difference indicated (*, **). (F) Human breast cancer tumor sections stained for the presence of vascular junction proteins at TMEM macrophages. Tumor sections are stained for TMEM; Mena (red), CD68 (brown) and CD31 (blue), (RBC in aqua) by IHC and for VE-cadherin (green), Tie2 (gray) and VEGFA (red) stained by immunofluorescence in sequential sections. TMEM outlined in black box in IHC and white box in immunofluorescence. Scale bar, 15 μm. (G) Quantification of normalized average pixel intensity of VE-Cadherin staining in vasculature at Tie2Hi/VEGFAHi macrophages of TMEM or away from TMEM in (n = 23 at TMEM, n = 24 away from TMEM in 5 individual patient samples, ***, P = 0.0001). (H) Cartoon summarizing TMEM macrophage-mediated induction of blood vessel permeability promotes tumor cell intravasation. TMEM assemble with close association between the non-migratory TMEM TC (green, T1) and Tie2Hi/VEGFAHi macrophage (blue, M1) on blood vessels. VEGFA destabilizes vascular junctions resulting in vascular permeability and TC (T2) intravasation.

Comment in

References

    1. Yuan F, Dellian M, Fukumura D, Leunig M, Berk DA, Torchilin VP, et al. Vascular permeability in a human tumor xenograft: molecular size dependence and cutoff size. Cancer Res. 1995;55:3752–6. - PubMed
    1. Gerlowski LE, Jain RK. Microvascular permeability of normal and neoplastic tissues. Microvasc Res. 1986;31:288–305. - PubMed
    1. Huang Y, Goel S, Duda DG, Fukumura D, Jain RK. Vascular Normalization as an Emerging Strategy to Enhance Cancer Immunotherapy. Cancer Research. 2013;73:2943–8. - PMC - PubMed
    1. Dvorak HF, Dvorak AM, Manseau EJ, Wiberg L, Churchill WH. Fibrin gel investment associated with line 1 and line 10 solid tumor growth, angiogenesis, and fibroplasia in guinea pigs. Role of cellular immunity, myofibroblasts, microvascular damage, and infarction in line 1 tumor regression. Journal of the National Cancer Institute. 1979;62:1459–72. - PubMed
    1. Lin EY, Nguyen AV, Russell RG, Pollard JW. Colony-stimulating factor 1 promotes progression of mammary tumors to malignancy. J Exp Med. 2001;193:727–40. - PMC - PubMed

Publication types

MeSH terms

Substances