Review
. 2015 Oct;95(4):1111-55.
doi: 10.1152/physrev.00001.2015.

The Mitochondrial Permeability Transition Pore: Channel Formation by F-ATP Synthase, Integration in Signal Transduction, and Role in Pathophysiology

Affiliations
Review

The Mitochondrial Permeability Transition Pore: Channel Formation by F-ATP Synthase, Integration in Signal Transduction, and Role in Pathophysiology

Paolo Bernardi et al. Physiol Rev. 2015 Oct.

Abstract

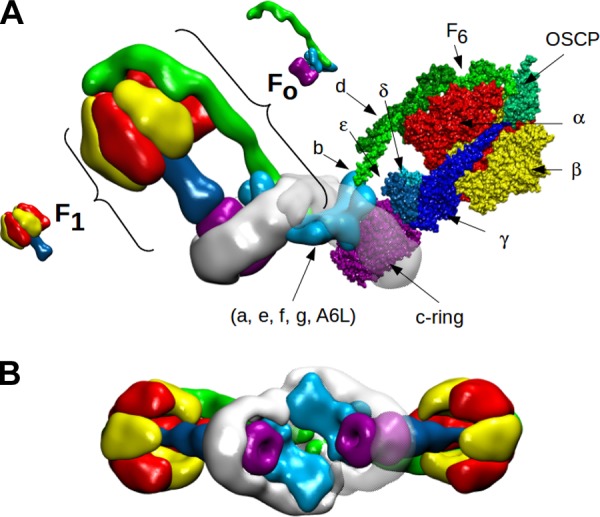
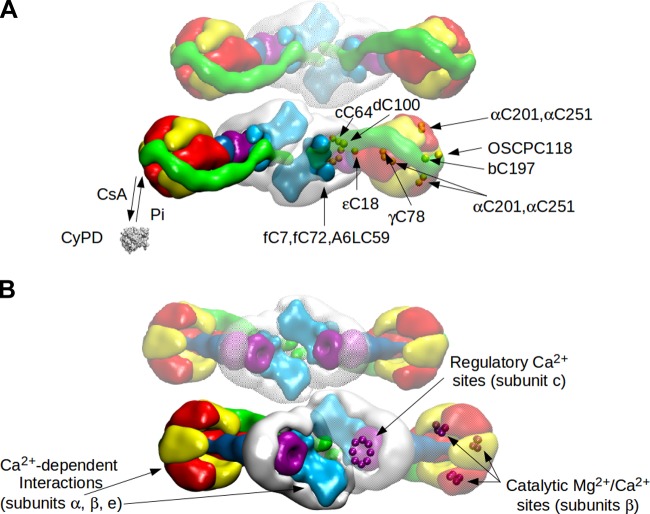
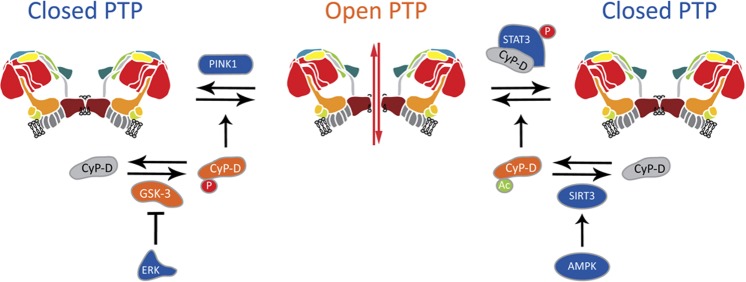
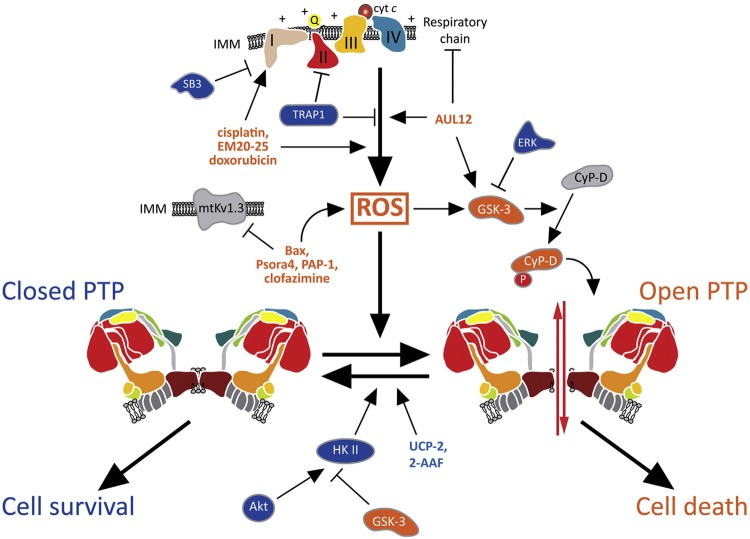
The mitochondrial permeability transition (PT) is a permeability increase of the inner mitochondrial membrane mediated by a channel, the permeability transition pore (PTP). After a brief historical introduction, we cover the key regulatory features of the PTP and provide a critical assessment of putative protein components that have been tested by genetic analysis. The discovery that under conditions of oxidative stress the F-ATP synthases of mammals, yeast, and Drosophila can be turned into Ca(2+)-dependent channels, whose electrophysiological properties match those of the corresponding PTPs, opens new perspectives to the field. We discuss structural and functional features of F-ATP synthases that may provide clues to its transition from an energy-conserving into an energy-dissipating device as well as recent advances on signal transduction to the PTP and on its role in cellular pathophysiology.


Figures

Figure 1.
Figure 1.
Model of F-ATP synthase dimer viewed from the lateral side (A) and from the intermembrane space (B). A: left monomer, the F1 and FO sectors are highlighted. Right monomer, the F1 and FO subunits are shown. In the F1 sector, the front α and β subunits have been removed to reveal the central stalk. The F1 α and β subunits are colored in red and yellow, respectively. The F1 γ, δ, and ε subunits are colored in shades of blue, the peripheral stalk subunits b, d, F6 and OSCP in shades of green, and the c-ring in purple. The remaining FO subunits a, e, f, g, and A6L are colored in light blue. The intramembrane FO is surrounded by detergent, shown in white. The image has been built starting from the yeast dimer molecular model (146) (PDB id. 4b2q) to which the cryoelectron microscopy (cryo-EM) map of bovine F-ATP synthase (29) (EMD id. EMD-2091) has been superimposed. The fit of molecular models to cryo-EM map was performed using the program ADP_EM (208). The molecular model for bovine F-ATP synthase was obtained by superimposing the 3D structure of the bovine F1-c-ring complex (PDB id. 2xnd) onto each corresponding monomer of the yeast dimer. The superposition was performed using the Swiss pdb viewer routine Iterative magic fit (237). The lateral stalk was taken from the yeast dimer (PDB id. 4b2q) which has been modeled using the bovine subunits. B: cryo-EM maps are rotated 180° to be viewed from the intermembrane space.
Figure 2.
Figure 2.
Model of F-ATP synthase dimer viewed from the matrix (A) and from the intermembrane space (B). A: the model (top view) was built and fitted to cryo-EM maps as described for Figure 1 to illustrate the region where the PTP could form between paired monomers. A second dimer is also depicted to illustrate another possible region for PTP formation in the area defined by two paired dimers. Left monomer: reversible binding of CyPD to F-ATP synthase is shown. Right monomer: the position of human Cys residues on the specified subunits (dots) is mapped onto the 3D structure of the bovine F1-c-ring complex and of the bovine lateral stalk (fC7 and A6LC59 are missing in the bovine complex). B: the same model shown in A is rotated 180° (view from the intermembrane space). Left monomer: the subunits involved in Ca2+-dependent interactions are highlighted, i.e., subunits α and β, which interact with the matrix protein S100A1 (62) (not shown in the picture), and the Fo region containing subunit e, which may interact with a hypothetical tropomyosin-like protein localized in the intermembrane space (17). Right monomer: Ca2+-regulatory sites located in the c-ring (23, 402) and the residues (T163, R189, E192, D256) of β subunits interacting with the catalytic metal ions are mapped onto the 3D structure of the bovine F1-c-ring complex. Numbering does not include the import sequences.
Figure 3.
Figure 3.
Regulation of PTP opening by posttranslational modifications of CyPD. CyPD is a molecular terminal of many signaling axes that regulate the PTP (inducers are indicated in orange, inhibitors in blue): 1) CyPD phosphorylation by GSK3β facilitates PTP opening, and GSK3β activity is abrogated by induction of the Ser/Thr kinase ERK; 2) phosphorylated STAT3 binds to CyPD and inhibits PTP opening; and 3) CyPD acetylation sensitizes the PTP to opening and is prevented by AMPK activation of the SIRT3 deacetylase. In addition, the Ser/Thr kinase PINK1 inhibits PTP opening through poorly defined mechanisms. [Modified from Rasola and Bernardi (490) with permission.]
Figure 4.
Figure 4.
Mechanisms of PTP regulation in tumor cells. A variety of factors control tumor cell viability by modulating PTP opening, mainly by modulating ROS levels. A ROS surge elicits PTP opening and cell death, whereas ROS inhibition keeps the pore locked and protects cells from noxious stimuli. PTP inducers are indicated in orange, PTP inhibitors in blue. I–IV, respiratory complexes; 2-AAF, 2-acetylaminofluorene; Q, coenzyme Q; cyt c, cytochrome c; HK II, hexokinase II; IMM, inner mitochondrial membrane; SB3, serpin B3; UCP-2, uncoupling protein 2. [From Rasola and Bernardi (494) with permission.]

References

    1. Abrahams JP, Buchanan SK, van Raaij MJ, Fearnley IM, Leslie AG, Walker JE. The structure of bovine F1-ATPase complexed with the peptide antibiotic efrapeptin. Proc Natl Acad Sci USA 93: 9420–9424, 1996. - PMC - PubMed
    1. Abrahams JP, Leslie AG, Lutter R, Walker JE. Structure at 2.8 Å resolution of F1-ATPase from bovine heart mitochondria. Nature 370: 621–628, 1994. - PubMed
    1. Abramov AY, Fraley C, Diao CT, Winkfein R, Colicos MA, Duchen MR, French RJ, Pavlov E. Targeted polyphosphatase expression alters mitochondrial metabolism and inhibits calcium-dependent cell death. Proc Natl Acad Sci USA 104: 18091–18096, 2007. - PMC - PubMed
    1. Acehan D, Malhotra A, Xu Y, Ren M, Stokes DL, Schlame M. Cardiolipin affects the supramolecular organization of ATP synthase in mitochondria. Biophys J 100: 2184–2192, 2011. - PMC - PubMed
    1. Acin-Pérez R, Carrascoso I, Baixauli F, Roche-Molina M, Latorre-Pellicer A, Fernández-Silva P, Mittelbrunn M, Sanchez-Madrid F, Pérez-Martos A, Lowell CA, Manfredi G, Enríquez JA. ROS-triggered phosphorylation of complex II by Fgr kinase regulates cellular adaptation to fuel use. Cell Metab 19: 1020–1033, 2014. - PMC - PubMed

Publication types

MeSH terms

Substances

LinkOut - more resources