. 2015 Oct 15;26(20):3561-9.
doi: 10.1091/mbc.E15-06-0359. Epub 2015 Aug 12.

A phosphoinositide-binding cluster in cavin1 acts as a molecular sensor for cavin1 degradation

Affiliations

A phosphoinositide-binding cluster in cavin1 acts as a molecular sensor for cavin1 degradation

Vikas A Tillu et al. Mol Biol Cell. .

Abstract

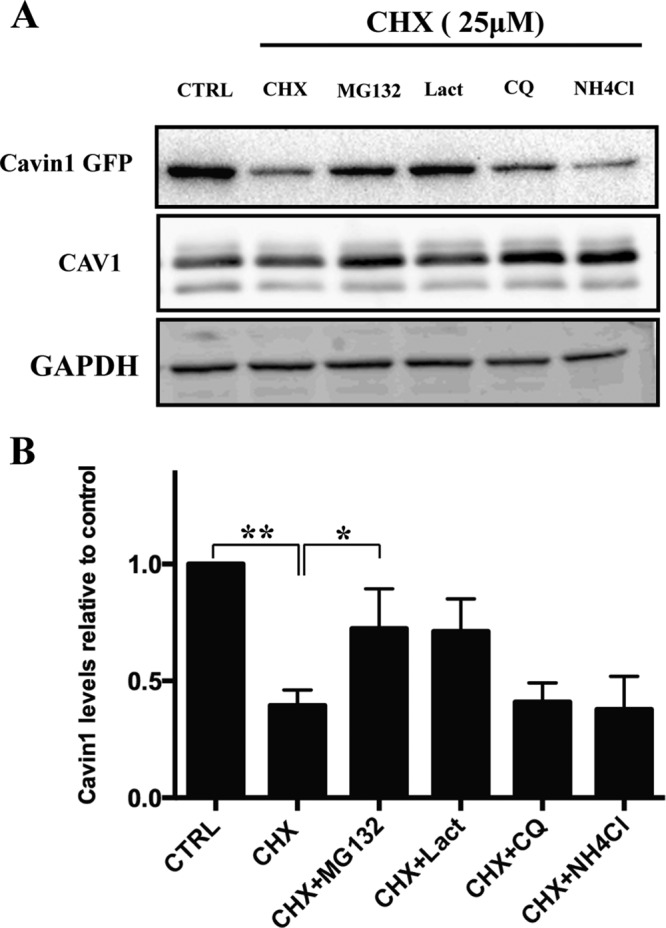
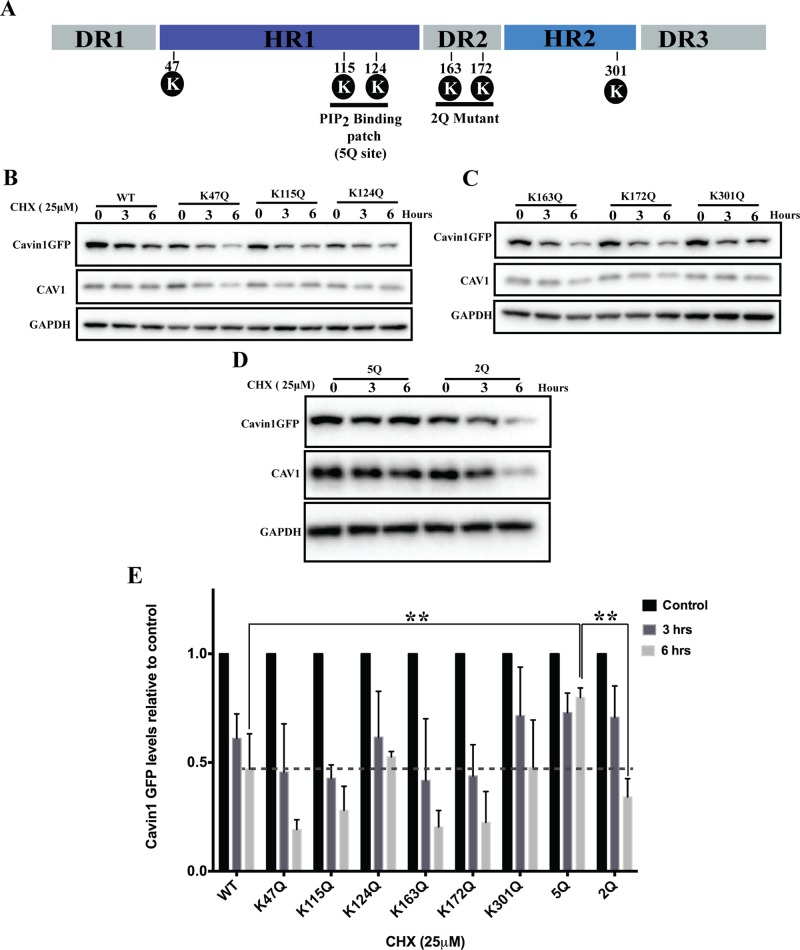
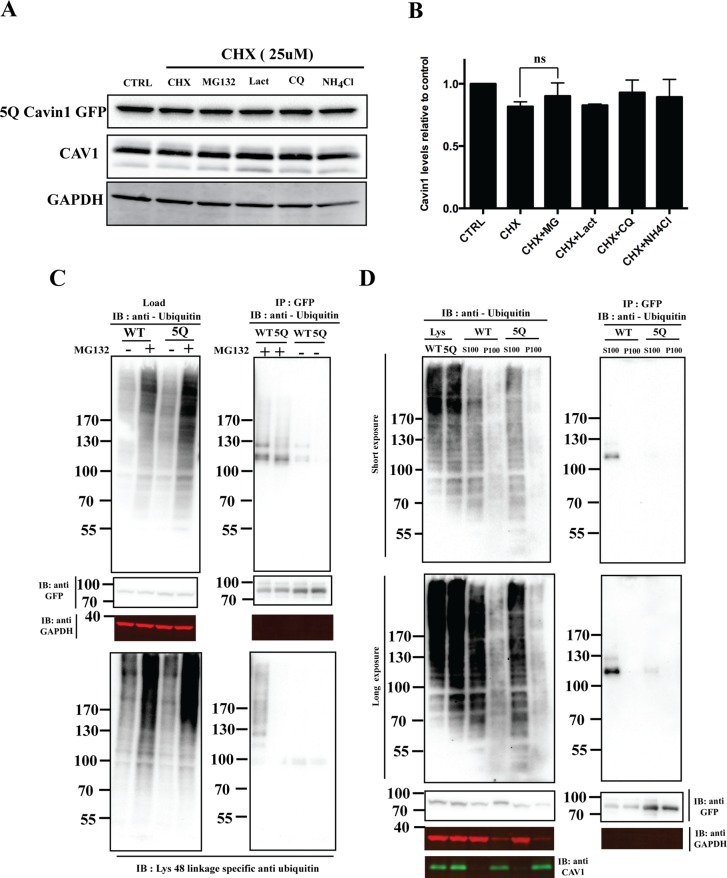
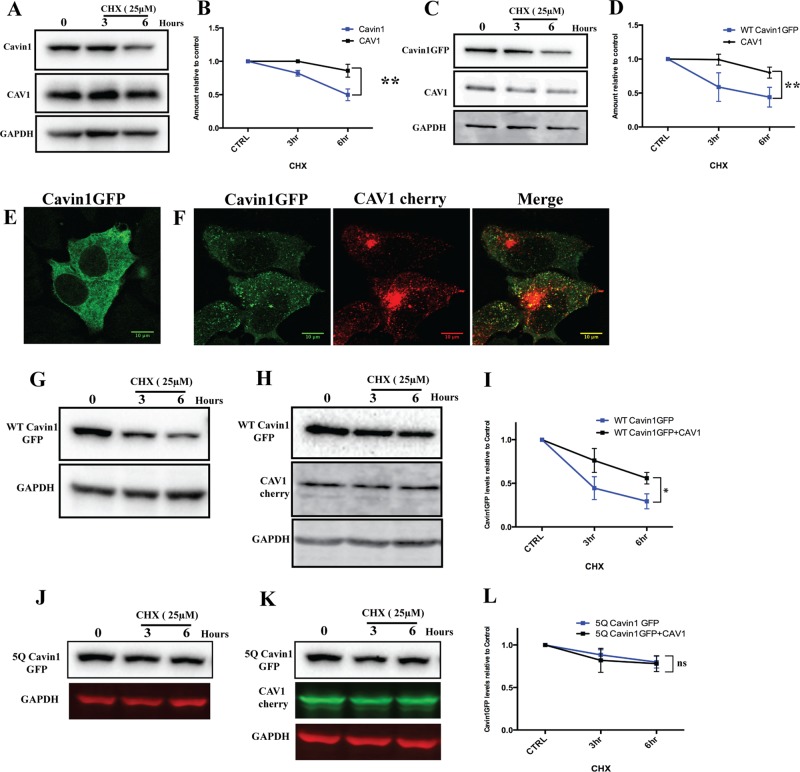
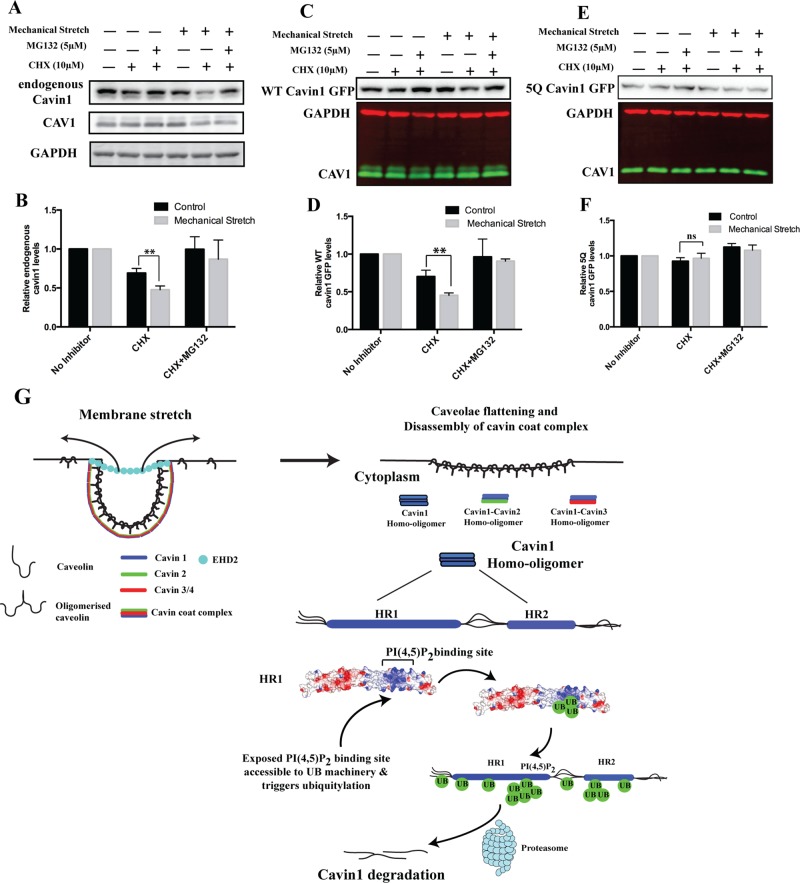
Caveolae are abundant surface organelles implicated in a range of cellular processes. Two classes of proteins work together to generate caveolae: integral membrane proteins termed caveolins and cytoplasmic coat proteins called cavins. Caveolae respond to membrane stress by releasing cavins into the cytosol. A crucial aspect of this model is tight regulation of cytosolic pools of cavin under resting conditions. We now show that a recently identified region of cavin1 that can bind phosphoinositide (PI) lipids is also a major site of ubiquitylation. Ubiquitylation of lysines within this site leads to rapid proteasomal degradation. In cells that lack caveolins and caveolae, cavin1 is cytosolic and rapidly degraded as compared with cells in which cavin1 is associated with caveolae. Membrane stretching causes caveolar disassembly, release of cavin complexes into the cytosol, and increased proteasomal degradation of wild-type cavin1 but not mutant cavin1 lacking the major ubiquitylation site. Release of cavin1 from caveolae thus leads to exposure of key lysine residues in the PI-binding region, acting as a trigger for cavin1 ubiquitylation and down-regulation. This mutually exclusive PI-binding/ubiquitylation mechanism may help maintain low levels of cytosolic cavin1 in resting cells, a prerequisite for cavins acting as signaling modules following release from caveolae.


Figures

FIGURE 1:
FIGURE 1:
Cavin1 turnover is mediated by the proteasome. (A) PC3 cells overexpressing WT cavin1-GFP were treated with 25 μM CHX in the presence or absence of MG132 (10 μM), Lact (10 μM), CQ (10 μM), or NH4Cl (10 mM) for 6 h and were subsequently immunoblotted for GFP, CAV1, and GAPDH as loading control. (B) Quantification of WT cavin1-GFP levels after inhibitor treatment normalized to untreated samples from three to four independent experiments. Error bars represent SD. *, p < 0.05; **, p < 0.01. Representative uncropped immunoblots are shown in Supplemental Figure S2.
FIGURE 2:
FIGURE 2:
Mapping the major ubiquitylation site in cavin1. (A) Schematic representation of cavin1 structural domains (Kovtun et al., 2014), PI(4,5)P2-binding site shown as 5Q, and the position of putative lysine residues chosen for protein turnover study encompassing the 5Q site. (B–D) CHX chase assay for cavin1 point mutants shown in A and respective immunoblot analysis for GFP, CAV1, and GAPDH. (E) Quantification of Western blots for cavin1-GFP levels from two (point mutants) or three to four (WT and 5Q cavin1-GFP) independent experiments normalized to control (untreated samples) for each mutant. Data are presented as mean ± SD. **, p < 0.01. Representative uncropped immunoblots are shown in Supplemental Figure S2. Western blot images shown in Figures 2B and 4C (WT cavin1-GFP turnover upon overexpression in PC3 line) originate from different replicates, but quantifications shown in Figures 2E and 4D are the same.
FIGURE 3:
FIGURE 3:
5Q mutation significantly reduces cavin1 ubiquitylation and is less sensitive to proteasomal inhibitors. (A) PC3 cells were transiently transfected with 5Q cavin1 mutant and were treated with 25 μM CHX in the presence or absence of MG132 (10 μM), Lact (10 μM), CQ (10 μM), or NH4Cl (10 mM) for 6 h and were subsequently immunoblotted for GFP, CAV1, and GAPDH. (B) Quantification of cavin1-GFP levels from immunoblot analysis of three independent experiments. Each bar represents mean and error bars represent SD. ns, no significant difference. (C) A431 cells were transiently transfected with WT cavin1-GFP or 5Q cavin1-GFP and treated with either MG132 or dimethyl sulfoxide. Cell lysates were immunoprecipitated for GFP with GFP nanobeads. Then lysates and immunoprecipitated samples were immunoblotted for GFP, GAPDH, and antiubiquitin antibody to detect total ubiquitylated proteins and Lys-48 linkage–specific antiubiquitin antibody to detect ubiquitylated species of cavin1 specifically attached by the Lys-48 residue of ubiquitin that marks target protein for proteasome degradation. (D) A431 cells were transiently transfected with WT cavin1-GFP or 5Q cavin1-GFP and treated with MG132 for 2 h. Subsequently cells were lysed in buffer C and subjected to ultracentrifugation to separate the membrane fraction as a pellet (P100) and supernatant (S100). Further, GFP immunoprecipitation was performed by dissolving the membrane fraction in buffer B and immunoblotting for GFP, GAPDH, CAV1, and with antiubiquitin to detect ubiquitylated species of cavin1. Representative uncropped immunoblots are shown in Supplemental Figure S2.
FIGURE 4:
FIGURE 4:
Analysis of cavin1 turnover in model cell lines. (A) A431 cells were treated with 25 μM CHX for the indicated time period following lysis and immunoblotting for cavin1, CAV1, and GAPDH. WT cavin1-GFP was exogenously expressed in PC3 (C), a CHX chase assay was performed as above, and immunoblotted for GFP, CAV1, and GAPDH. Quantification of protein levels by Western blots at various time points is indicated in B and D. Each point represents the mean of three to four independent experiments, and error bars indicate SD. **, p < 0.01. Subcellular distribution of cavin1-GFP (E) upon overexpression in MCF 7 cells and when coexpressed with CAV1-cherry (F). CHX chase assay upon overexpression of WT cavin1-GFP (G) and 5Q cavin1-GFP (J) in MCF7 cells and with coexpression of WT cavin1-GFP (H)/5Q cavin1-GFP (K) and CAV1-cherry. Quantification of total WT cavin1-GFP (I) and 5Q cavin1-GFP (L) levels at each time point normalized to untreated samples from three independent experiments. Data are presented as mean ± SD. *, p < 0.05; ns, no significant difference. Representative uncropped immunoblots are shown in Supplemental Figure S3. Western blot images shown in Figures 2B and 4C (WT cavin1-GFP turnover upon overexpression in PC3 line) originate from different replicates, but quantifications shown in Figures 2E and 4D are the same.
FIGURE 5:
FIGURE 5:
Mechanical stretch stimulates cavin1 turnover. (A) A431 cells expressing WT cavin1-GFP or 5Q cavin1-GFP were subjected to cyclical stretch or rest (control) in the presence or absence of specific inhibitors for 6 h (described in Materials and Methods). Subsequently cells were lysed in lysis buffer A and immunoblotted for endogenous cavin1, cavin1-GFP CAV1, and GAPDH. Quantification of total endogenous cavin1 (B), WT cavin1-GFP (D), and 5Q cavin1-GFP (F) levels was done by normalizing inhibitor-treated samples to untreated samples in respective resting or cyclical stretch conditions. Data are presented as mean ± SD from three independent experiments. **, p < 0.01; ns, no significant difference. Immunoblots for WT cavin1-GFP (C) and 5Q cavin1-GFP (E) levels upon cyclical stretch. Representative immunoblots for endogenous cavin1 and quantification of endogenous cavin1 protein levels from three independent experiments (see panel B) are shown from A431 cells transfected with WT cavin1-GFP. Representative uncropped immunoblots are shown in Supplemental Figure S3. (G) Model of caveolae disassembly and fate of cavins after release into the cytosol.

References

    1. Aboulaich N, Chui PC, Asara JM, Flier JS, Maratos-Flier E. Polymerase I and transcript release factor regulates lipolysis via a phosphorylation-dependent mechanism. Diabetes. 2011;60:757–765. - PMC - PubMed
    1. Bastiani M, Liu L, Hill MM, Jedrychowski MP, Nixon SJ, Lo HP, Abankwa D, Luetterforst R, Fernandez-Rojo M, Breen MR, et al. MURC/cavin-4 and cavin family members form tissue-specific caveolar complexes. J Cell Biol. 2009;185:1259–1273. - PMC - PubMed
    1. Briand N, Prado C, Mabilleau G, Lasnier F, Le Liepvre X, Covington JD, Ravussin E, Le Lay S, Dugail I. Caveolin-1 expression and cavin stability regulate caveolae dynamics in adipocyte lipid store fluctuation. Diabetes. 2014;63:4032–4044. - PMC - PubMed
    1. Gambin Y, Ariotti N, McMahon KA, Bastiani M, Sierecki E, Kovtun O, Polinkovsky ME, Magenau A, Jung W, Okano S, et al. Single-molecule analysis reveals self assembly and nanoscale segregation of two distinct cavin subcomplexes on caveolae. eLife. 2014;3:e01434. - PMC - PubMed
    1. Hansen CG, Bright NA, Howard G, Nichols BJ. SDPR induces membrane curvature and functions in the formation of caveolae. Nat Cell Biol. 2009;11:807–814. - PMC - PubMed

Publication types