. 2015 Jun 15;5(4):333-47.
eCollection 2015.

Biodistribution and pharmacokinetics of recombinant α1-microglobulin and its potential use in radioprotection of kidneys

Affiliations

Biodistribution and pharmacokinetics of recombinant α1-microglobulin and its potential use in radioprotection of kidneys

Jonas Ahlstedt et al. Am J Nucl Med Mol Imaging. .

Abstract

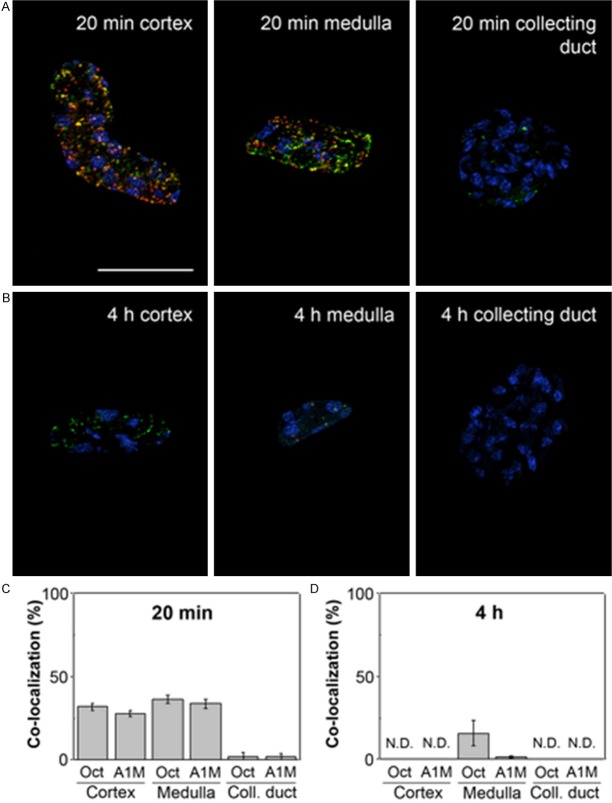
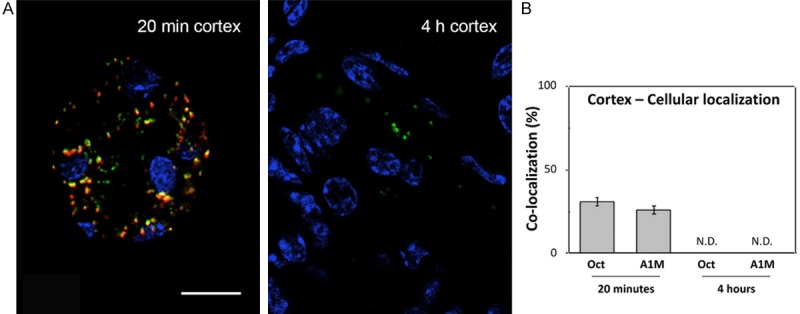
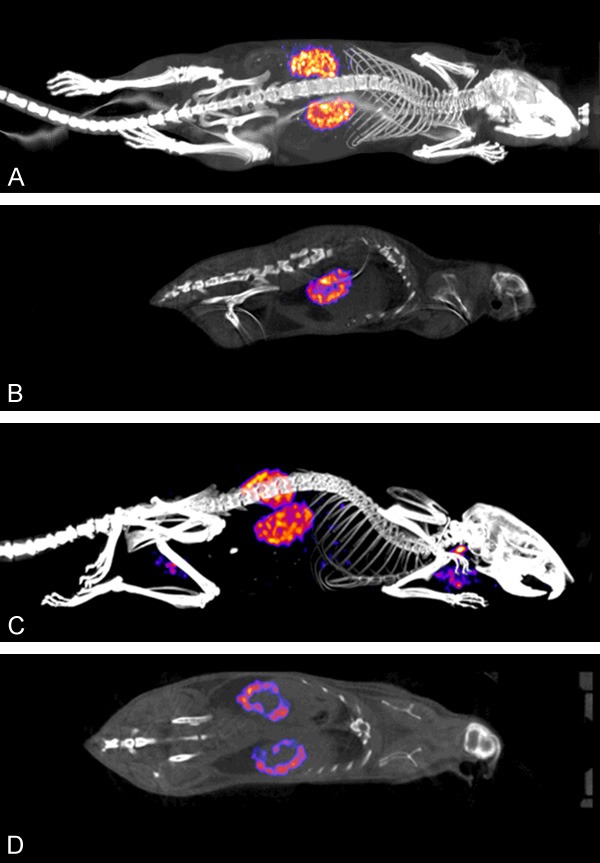
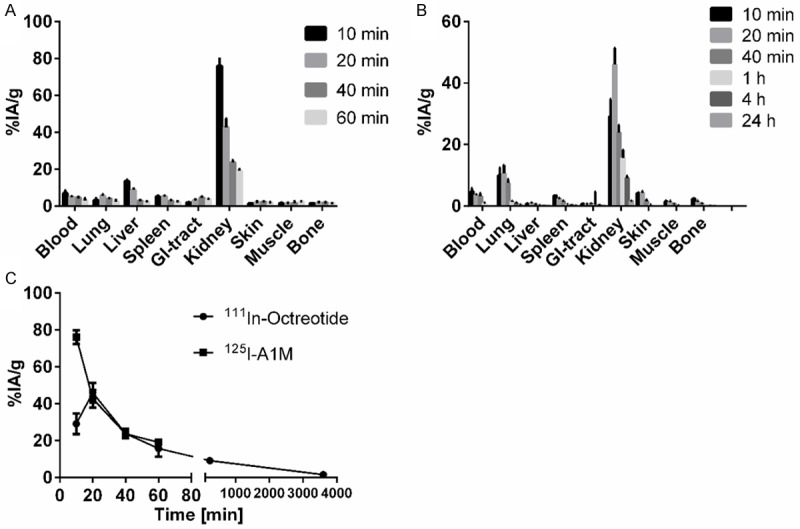
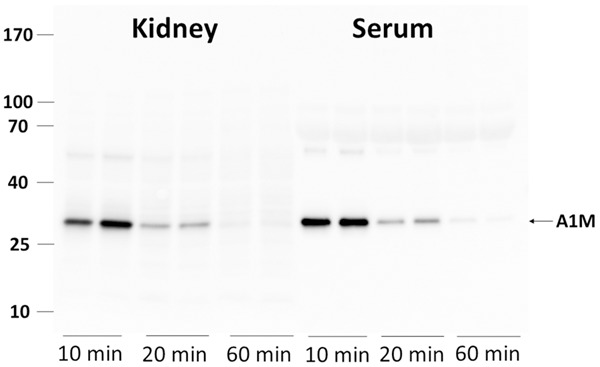
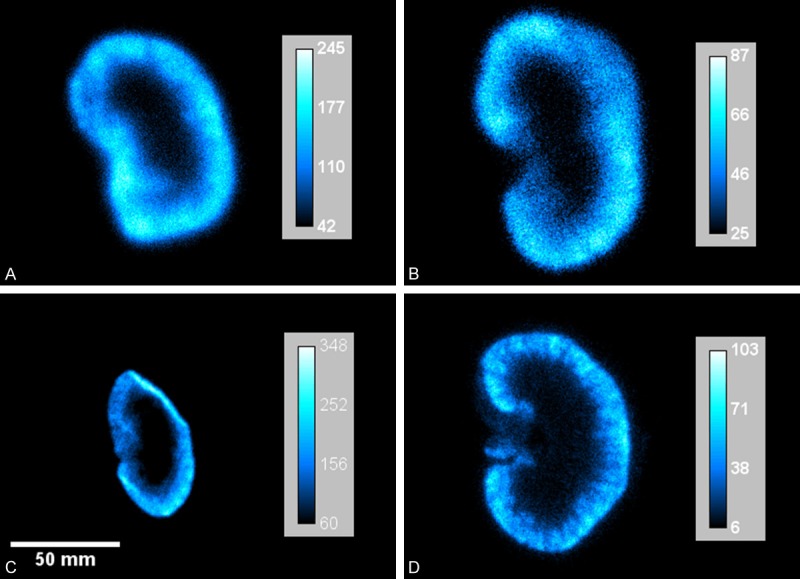
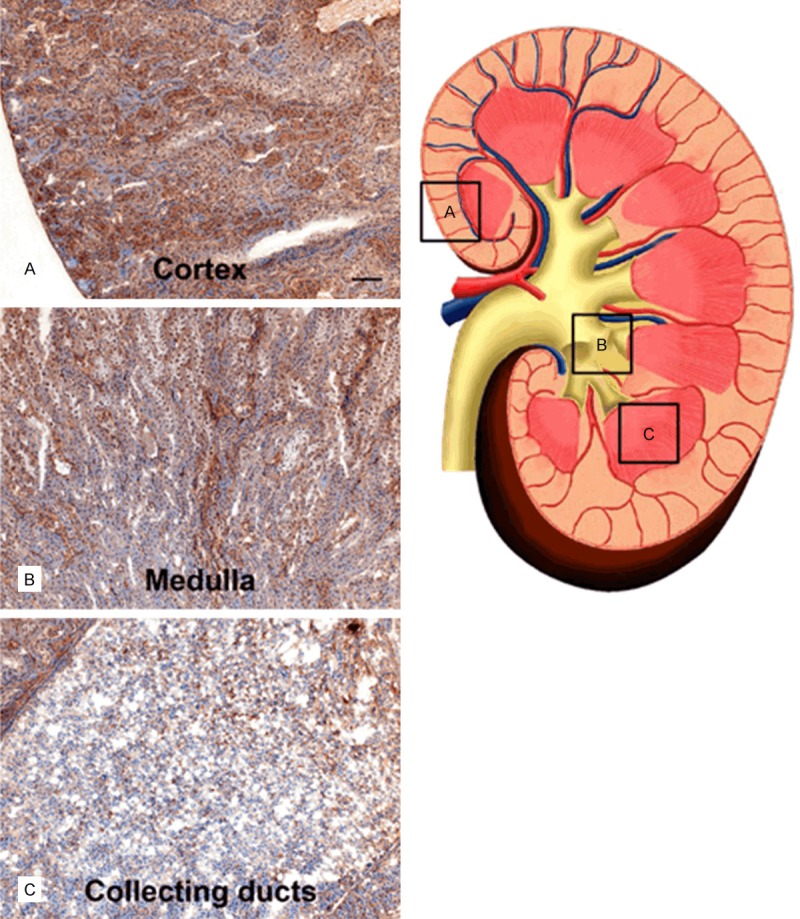
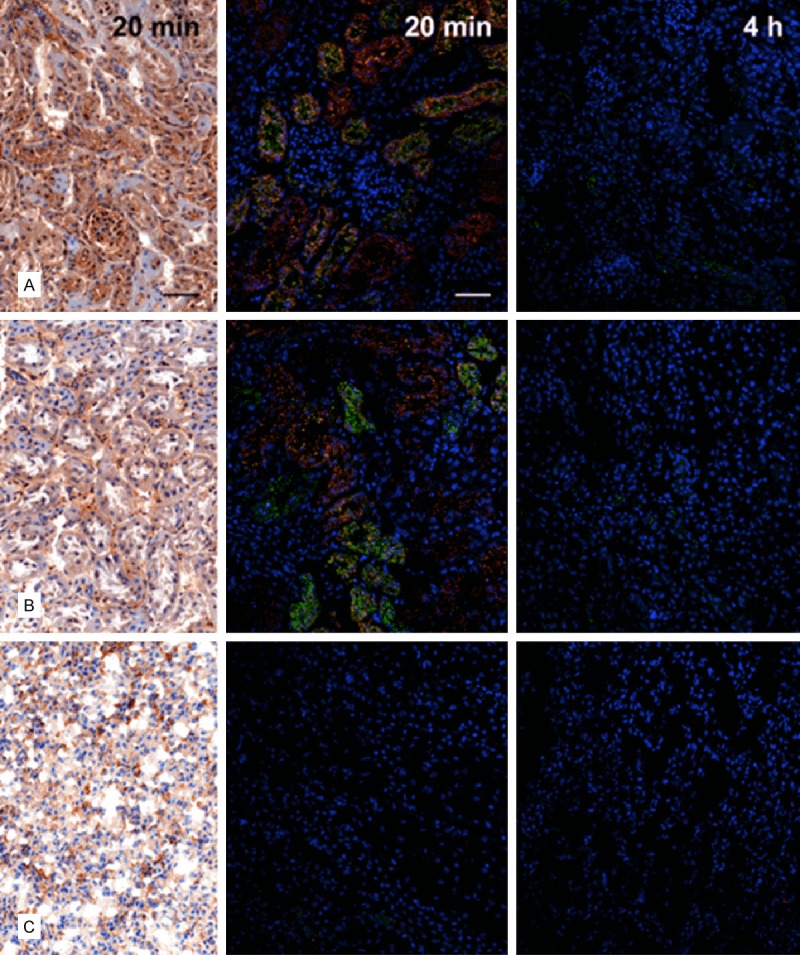
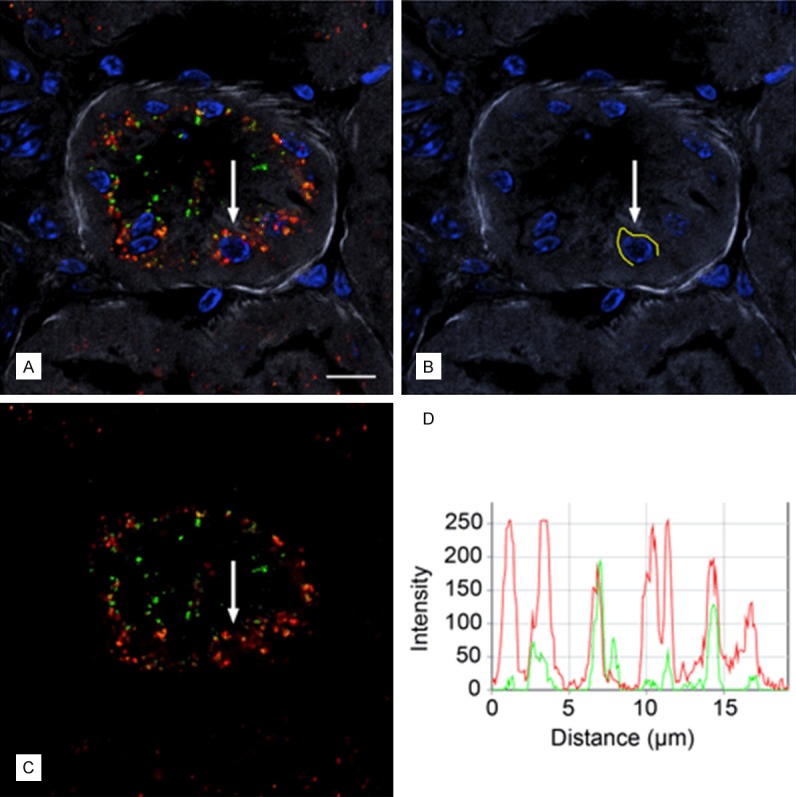
Peptide-receptor radionuclide therapy (PRRT) is a systemically administrated molecular targeted radiation therapy for treatment of neuroendocrine tumors. Fifteen years of clinical use show that renal toxicity, due to glomerular filtration of the peptides followed by local generation of highly reactive free radicals, is the main side-effect that limits the maximum activity that can be administrated for efficient therapy. α1-microglobulin (A1M) is an endogenous radical scavenger shown to prevent radiation-induced in vitro cell damage and protect non-irradiated surrounding cells. An important feature of A1M is that, following distribution to the blood, it is equilibrated to the extravascular compartments and filtrated in the kidneys. Aiming at developing renal protection against toxic side-effects of PRRT, we have characterized the pharmacokinetics and biodistribution of intravenously (i.v.) injected (125)I- and non-labelled recombinant human A1M and the (111)In- and fluorescence-labelled somatostatin analogue octreotide. Both molecules were predominantly localized to the kidneys, displaying a prevailing distribution in the cortex. A maximum of 76% of the injected A1M and 46% of the injected octreotide were present per gram kidney tissue at 10 to 20 minutes, respectively, after i.v. injection. Immunohistochemistry and fluorescence microscopy revealed a dominating co-existence of the two substances in proximal tubules, with a cellular co-localization in the epithelial cells. Importantly, analysis of kidney extracts displayed an intact, full-length A1M at least up to 60 minutes post-injection (p.i.). In summary, the results show a highly similar pharmacokinetics and biodistribution of A1M and octreotide, thus enabling the use of A1M to protect the kidneys tissue during PRRT.

Keywords: A1M; antioxidation; glomerulus; kidney; octreotide; oxidative stress; prrt; radioprotection; tubule.


Figures

Figure 8
Figure 8
Tubular localization of A1M and octreotide-A647 at different p.i. times. A1M and octreotide-A647 conjugate were injected i.v. and animals were terminated at 20 minutes (A, C) and 4 hours (B, D) following injection. The percentage of co-localized A1M (green) and octreotide-A647 (red) was calculated in selected tubular profiles in the cortex, medulla and collecting ducts, in confocal microscopic images (20×/0.8 objective). Cell nuclei were visualized using DAPI (blue). Representative profiles (A, B) show different degrees of co-localization (yellow), and the co-localization data from all investigated samples are presented as mean ± SEM of representative areas (C, D). Scale bar represents 50 µm.
Figure 9
Figure 9
Cellular co-localization of A1M and octreotide-A647 in cortex at high magnification. A1M and octreotide-A647 conjugate were injected i.v. and animals were terminated at 20 minutes and 4 hours p.i. The percentage of co-localized A1M (green) and octreotide-A647 (red) was calculated in selected tubular profiles in the cortex, in high-resolution confocal microscopic images (63×/1.4 objective). Cell nuclei were visualized using DAPI (blue). Representative profiles (A) show different degrees of intracellular co-localization (yellow), and the co-localization data from all investigated samples are presented as mean ± SEM of representative areas (B). Scale bar represents 20 µm.
Figure 1
Figure 1
SPECT/CT images of normal NMRI mice injected with 5 MBq 111In-octreotide (A and B) and 5 MBq 125I-A1M (C and D) and imaged for 40 minutes. Three-dimensional re-constructed whole body views (A and C) and planar sections through kidneys (B and D) are shown. Kidneys show high uptake and an accumulation can be seen in the kidney cortex for both molecules. For 125I-A1M, a slight uptake in the thyroids can be observed.
Figure 2
Figure 2
Biodistribution of 125I-A1M (A) and 111In-octreotide (B) in normal NMRI mice. (C) shows uptake over time for both molecules in the kidneys. Data are presented as % IA/g from 4 animals ± SEM.
Figure 3
Figure 3
Presence of full-length A1M in normal NMRI mice in kidneys and serum at 10, 20 and 60 minutes p.i. Animals were injected i.v. with 150 μg A1M and blood and kidneys collected at the indicated time-points. The blood was allowed to coagulate and serum separated by centrifugation. One kidney was homogenized in 1 ml PBS and centrifugated. One μl serum and 6 μl supernatant from the kidney homogenate were applied to SDS-PAGE, transferred to PVDF-membranes and blotted with anti-A1M. Each lane represents a separate mouse.
Figure 4
Figure 4
Digital autoradiography images of uptake of 111In-octreotide and 125I-A1M in kidneys of normal mice. A. 125I-A1M, 20 minutes p.i.; B. 125I-A1M, 1 hour p.i.; C. 111In-octreotide, 20 minutes p.i.; D. 111In-octreotide, 1 hour p.i. All images show localized uptake in the kidney cortex for both molecules. Note that the scale of each image has been adjusted to optimally illustrate the relative distribution of the radionuclides in each kidney section.
Figure 5
Figure 5
Distribution of A1M immunoreactivity in the kidney 20 min after i.v. injection. A1M immunoreactivity was detected with the K: 322 anti-A1M antibody, using IHC. The left panel shows representative areas with A1M-immunoreactivity in the cortex (A), medulla (B), and collecting ducts (C), the location of these areas is indicated with (A-C) and highlighted with boxes in the schematic drawing in the right panel. Scale bar represents 100 µm in (A-C).
Figure 6
Figure 6
Distribution of A1M immunoreactivity and octreotide-A647 in the kidney 20 minutes and 4 hours after i.v. injection. A1M immunoreactivity was detected with the K: 322 anti-A1M antibody, using IHC (left column; bright-field microscopy) or IF (middle and right columns; confocal microscopy) in cortex (A), medulla (B), and collecting ducts (C). Distribution of A1M IF (green) and octreotide-A647 (red), and their tubular co-localization (yellow), was investigated at 20 minutes (middle) and 4 hours (right) p.i. Cell nuclei were visualized using DAPI (blue). Scale bar represents 50 µm.
Figure 7
Figure 7
Cellular co-localization of A1M IF and octreotide-A647 following i.v. injections. A1M and octreotide-A647 conjugate were injected i.v. and animals were terminated at 20 minutes following injection. High-resolution (63×/1.4 objective) confocal microscopic image shows the intracellular distribution of A1M IF (green) and octreotide-A647 fluorescence (red). Cell nuclei were stained with DAPI (blue), and phalloidin-Texas Red labeling (grey) was used to delineate tubular profiles. Resolution of punctuate fluorescence in one cell (A; arrow) was shown by measuring fluorescence intensities along a profile in the cytoplasm just outside the nucleus (B; yellow line), giving the intensities along the profile in the red and green channels (C) as an intensity profile (D) with 8 bits (256 intensity levels) per channel. Scale bar represents 10 µm.

References

    1. Bodei L, Mueller-Brand J, Baum RP, Pavel ME, Horsch D, O’Dorisio MS, O’Dorisio TM, Howe JR, Cremonesi M, Kwekkeboom DJ, Zaknun JJ. The joint IAEA, EANM, and SNMMI practical guidance on peptide receptor radionuclide therapy (PRRNT) in neuroendocrine tumours. Eur J Nucl Med Mol Imaging. 2013;40:800–816. - PMC - PubMed
    1. Krenning EP, Bakker WH, Breeman WA, Koper JW, Kooij PP, Ausema L, Lameris JS, Reubi JC, Lamberts SW. Localisation of endocrine-related tumours with radioiodinated analogue of somatostatin. Lancet. 1989;1:242–244. - PubMed
    1. Svensson J, Berg G, Wangberg B, Larsson M, Forssell-Aronsson E, Bernhardt P. Renal function affects absorbed dose to the kidneys and haematological toxicity during Lu-DOTATATE treatment. Eur J Nucl Med Mol Imaging. 2015;42:947–55. - PMC - PubMed
    1. Bodei L, Cremonesi M, Ferrari M, Pacifici M, Grana CM, Bartolomei M, Baio SM, Sansovini M, Paganelli G. Long-term evaluation of renal toxicity after peptide receptor radionuclide therapy with 90Y-DOTATOC and 177Lu-DOTATATE: the role of associated risk factors. Eur J Nucl Med Mol Imaging. 2008;35:1847–1856. - PubMed
    1. de Jong M, Krenning E. New advances in peptide receptor radionuclide therapy. J Nucl Med. 2002;43:617–620. - PubMed

LinkOut - more resources