. 2015 Aug 12;18(2):147-56.
doi: 10.1016/j.chom.2015.07.002.

Chemodetection and Destruction of Host Urea Allows Helicobacter pylori to Locate the Epithelium

Affiliations

Chemodetection and Destruction of Host Urea Allows Helicobacter pylori to Locate the Epithelium

Julie Y Huang et al. Cell Host Microbe. .

Abstract

The gastric pathogen Helicobacter pylori interacts intimately with the gastric mucosa to avoid the microbicidal acid in the stomach lumen. The cues H. pylori senses to locate and colonize the gastric epithelium have not been well defined. We show that metabolites emanating from human gastric organoids rapidly attract H. pylori. This response is largely controlled by the bacterial chemoreceptor TlpB, and the main attractant emanating from epithelia is urea. Our previous structural analyses show that TlpB binds urea with high affinity. Here we demonstrate that this tight binding controls highly sensitive responses, allowing detection of urea concentrations as low as 50 nM. Attraction to urea requires that H. pylori urease simultaneously destroys the signal. We propose that H. pylori has evolved a sensitive urea chemodetection and destruction system that allows the bacterium to dynamically and locally modify the host environment to locate the epithelium.


Figures

Figure 1
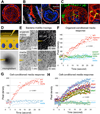
Figure 1. H. pylori is attracted to metabolites emanating from human gastric organoids and polarized epithelial cells
(A) Confocal reconstruction of a human gastric organoid in 3D culture stained for nuclei and the actin cytoskeleton. Scale bar, 10 μm. (B) Confocal immunofluorescence section through the surface epithelium of a human stomach sample (left) and an organoid (right) stained for surface mucus (MUC5AC). Scale bar, 10 μm. (C) Confocal 3D reconstruction of an organoid infected with H. pylori for 4 hours. Inset shows higher magnification of H. pylori adhered to epithelial junctions. Scale bar, 10 μm. (D) Top panel: Conditioned media was collected near the surface of gastric organoids and loaded into the micropipette. Bottom panel: Test substances form a microgradient at the micropipette tip as illustrated by injection of India ink in water. (E) Motility tracings of wild-type (WT) H. pylori’s response to a gradient of organoid-conditioned media (top panels) vs. non-conditioned media (bottom panels) at 1 second or 30 seconds post-injection. Motility tracings are obtained by combining 15 consecutive frames into a single image. (F) The concentration of bacteria (pixel density) within 60 μm of the micropipette tip is plotted over time. Each point represents the pixel density at a particular time in each of three independent movies. WT H. pylori’s response to organoid-conditioned media (red) or non-conditioned media (blue) and of ΔcheW to organoid-conditioned media (green) are compared. Zero second is defined as the moment the micropipette is introduced into the viewing field. (n = 3 movies per condition). (G) The responses of WT H. pylori to Caco-2 cell-conditioned media vs. non-conditioned media are plotted. Data are similarly displayed as in (F) (n = 3 movies per condition). (H) The responses of WT H. pylori vs. chemoreceptor mutants to Caco-2 cell-conditioned media are plotted. Data are similarly displayed as in (F) (n = 3 movies per condition). The responses of ΔtlpA, ΔtlpC, ΔtlpD are not significantly different from each other. p-values for scatter plots indicate significance of time by group interaction via a 2-way repeated measures ANOVA. See also Figures S1–S2 and Movies S1-S2.
Figure 2
Figure 2. TlpB senses urea released from the epithelium
(A) The concentration of bacteria (pixel density) within 60 μm of the micropipette tip was first determined from the scatter plots as those in Figure 1. WT H. pylori’s response at 4 seconds pre-injection and 15 seconds post-injection of organoid-conditioned media and Caco-2 cell-conditioned media before and after urease treatment are displayed in the bar graph (n = 3 movies per condition). (B) The responses of WT H. pylori, ΔtlpB, ΔtlpACD, ΔcheW to 1 mM urea microgradient as well as the response of WT H. pylori to 1 mM urea in urease-treated Caco-2 cell-conditioned media are plotted (n = 3 movies per condition). (C) The responses of WT SS1, WT 7.13, WT G27MA, ΔtlpB G27MA, and tlpB* G27MA to 1 mM urea microgradient are plotted. Bacterial density (pixel density) was quantified within a 60 μm radius from the micropipette tip and shown from 4 seconds pre-injection to 30 seconds post-injections. Each point represents the pixel density at a particular time in each of the movies. (n = 1 movie per strain). Bars represent the mean. Error bars represent s.d. NS indicates no statistical significance, *** P < 0.001, **** P < 0.0001 (2-way repeated measures ANOVA). p-value for scatter plot indicates significance of time by group interaction via a 2-way repeated measures ANOVA. See also Figure S3 and Movie S3.
Figure 3
Figure 3. TlpB detects urea and urea analogues directly with sensitivities that correlate with their binding affinities
(A) Crystal structures of urea and urea analogue orientations within the TlpB periplasmic domain. Orange dashed lines indicate hydrogen bonds. Yellow spheres represent water molecules. (B) Thermostability of TlpB measured in the presence of urea or urea analogues using a thermofluor assay. Center values represent the mean. Error bars represent s.d. (C) The minimal concentration of urea vs. urea analogues needed to elicit a WT H. pylori chemoattraction response defined as a bacterial swarm with a 60 μm radius from the micropipette tip at 15 seconds post-injection. (D) Motility tracings of WT H. pylori’s response to microgradients of 500 μM urea or urea analogues at 15 seconds post-injection. See also Figure S4 and Movie S4.
Figure 4
Figure 4. H pylori’s high affinity chemoreceptor TlpB detects nanomolar amounts of urea
(A) Dose response curve of WT H. pylori to varying concentrations of urea in the micropipette (10 μM to 1 mM). Each point represents the bacterial density (pixel density) within a 60μm radius from the micropipette tip at 15 seconds post-injection. Blue line is a log-log fit to the points. (B) Motility tracings of WT vs. ΔtlpB H. pylori’s response at 13 seconds after the initiation of a 50 nM urea pulse. (C) Quantification of the responses of WT H. pylori vs. ΔtlpB to a pulse of 50 nM urea. Each point represents the bacterial density (pixel density) at a particular time in the recorded movie. Zero second is defined as the moment the pulse was initiated (n = 3 movies per condition). p-value for scatter plot indicates significance of time by group interaction via a 2-way repeated measures ANOVA. See also Movie S5.
Figure 5
Figure 5. Urease degradation of urea facilitates urea sensing through TlpB
(A) The responses of WT H. pylori vs. ΔureAB to 1 mM urea. Each point represents the bacterial density (pixel density) at a particular time in the recorded movie. Zero second is defined as the moment the micropipette was introduced into the bacterial culture and a gradient was initiated (n = 2 movies for WT and 3 movies for ΔureAB). (B) Dose response curve of WT H. pylori to varying concentrations of urea in the micropipette (1 mM to 1 M). Each point represents the bacterial density (pixel density) within a 60μm radius from the micropipette tip at 15 seconds post-injection. Blue line is a log-log fit to the points. (C) The responses of WT H. pylori vs. ΔureAB in the presence or absence of exogenous Jack Bean urease to a microgradient formed by injecting 1 mM urea are plotted as in (A) (n = 2 movies for WT and 3 movies for ΔureAB+/− exogenous urease). p-values for scatter plots indicate significance of time by group interaction via a 2-way repeated measures ANOVA. See also Movie S6.

Comment in

References

    1. Aihara E, Closson C, Matthis AL, Schumacher MA, Engevik AC, Zavros Y, Ottemann KM, Montrose MH. Motility and chemotaxis mediate the preferential colonization of gastric injury sites by Helicobacter pylori. PLoS Pathog. 2014;10:1004275. - PMC - PubMed
    1. Amieva MR, Salama NR, Tompkins LS, Falkow S. Helicobacter pylori enter and survive within multivesicular vacuoles of epithelial cells. Cell Microbiol. 2002;4:677–690. - PubMed
    1. Andermann TM, Chen YT, Ottemann KM. Two predicted chemoreceptors of Helicobacter pylori promote stomach infection. Infect Immun. 2002;70:5877–5881. - PMC - PubMed
    1. Arnold IC, Lee JY, Amieva MR, Roers A, Flavell RA, Sparwasser T, Muller A. Tolerance rather than immunity protects from Helicobacter pylori-induced gastric preneoplasia. Gastroenterology. 2011;140:199–209. - PMC - PubMed
    1. Baker EN, Hubbard RE. Hydrogen bonding in globular proteins. Prog Biophys Mol Biol. 1984;44:97–179. - PubMed

Publication types

LinkOut - more resources