

High frequency of central memory regulatory T cells allows detection of liver recipients at risk of early acute rejection within the first month after transplantation
- PMID: 26270267
- PMCID: PMC4885217
- DOI: 10.1093/intimm/dxv048
High frequency of central memory regulatory T cells allows detection of liver recipients at risk of early acute rejection within the first month after transplantation
Abstract
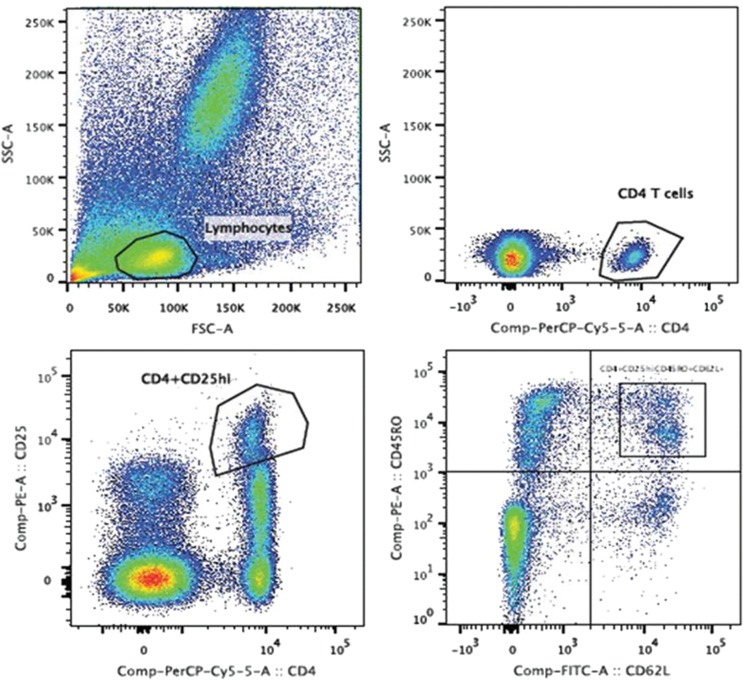
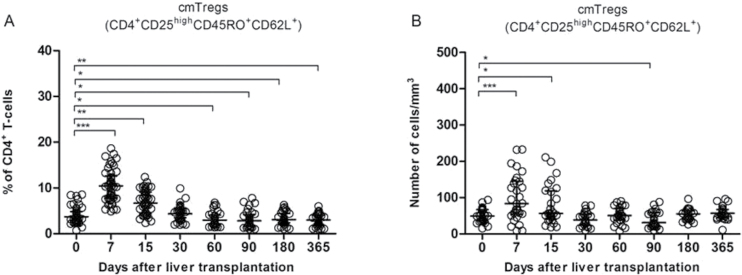
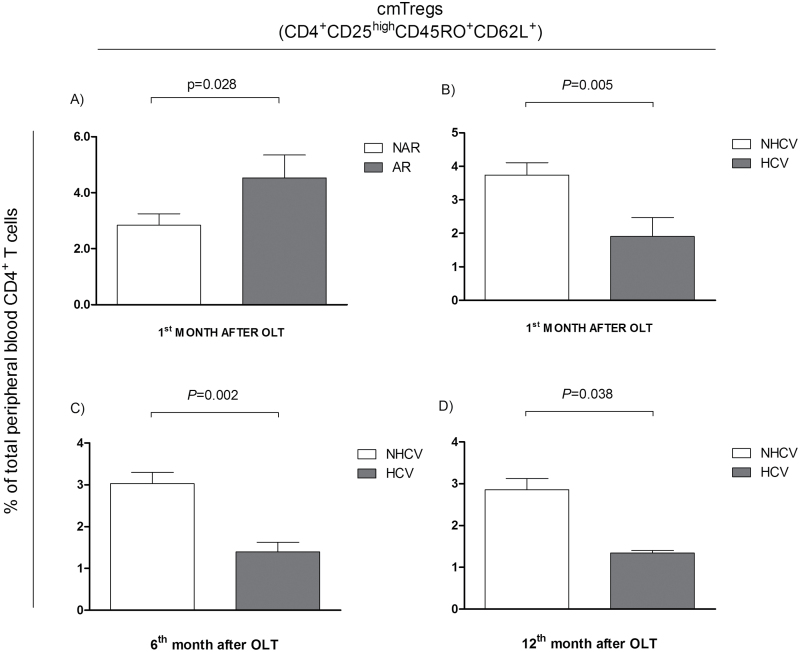
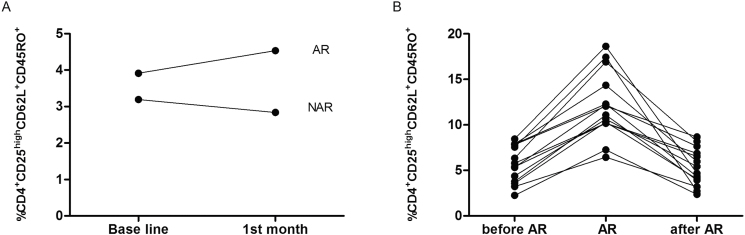
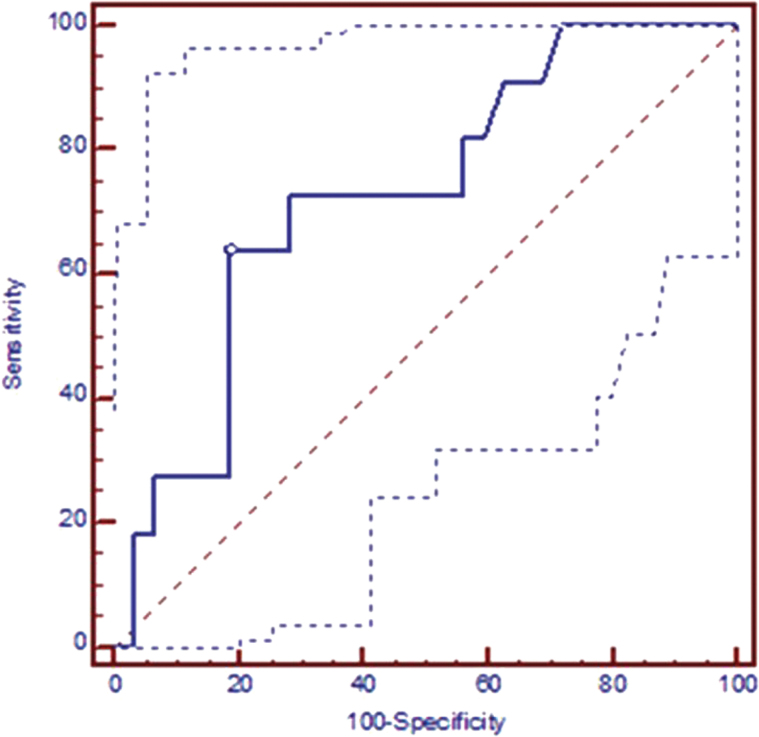
Several studies have analyzed the potential of T regulatory cells (Treg cells) as biomarkers of acute rejection (AR). The aim of the present multicenter study was to correlate the percentage of peripheral Treg cells in liver graft recipients drawn at baseline up to 12 months after transplantation with the presence of AR. The percentage of central memory (cm) Treg cells (CD4(+)CD25(high)CD45RO(+)CD62L(+)) was monitored at pre-transplant and at 1 and 2 weeks, and 1, 2, 3 and 6 months and 1 year post-transplantation. The same validation standard operating procedures were used in all participating centers. Fifteen patients developed AR (23.4%). Hepatitis C virus recurrence was observed in 16 recipients, who displayed low peripheral blood cmTreg levels compared with patients who did not. A steady increase of cmTregs was observed during the first month after transplantation with statistically significant differences between AR and non-AR patients. The high frequency of memory Treg cells allowed us to monitor rejection episodes during the first month post-transplantation. On the basis of these data, we developed a prediction model for assessing risk of AR that can provide clinicians with useful information for managing patients individually and customizing immunosuppressive therapies.
Keywords: Treg; acute rejection; liver transplantation; receiver operating characteristic curves.
© The Japanese Society for Immunology. 2015. All rights reserved. For permissions, please e-mail: journals.permissions@oup.com.
Figures
References
-
- Wiesner R. H., Demetris A. J., Belle S. H., et al. 1998. Acute hepatic allograft rejection: incidence, risk factors, and impact on outcome. Hepatology 28:638. - PubMed
-
- Asfar S., Metrakos P., Fryer J., et al. 1996. An analysis of late deaths after liver transplantation. Transplantation 61:1377. - PubMed
-
- König V., Bauditz J., Lobeck H., et al. 1992. Hepatitis C virus reinfection in allografts after orthotopic liver transplantation. Hepatology 16:1137. - PubMed
-
- Maloy K. J. and Powrie F. 2001. Regulatory T cells in the control of immune pathology. Nat. Immunol. 2:816. - PubMed
-
- Mason D. and Powrie F. 1998. Control of immune pathology by regulatory T cells. Curr. Opin. Immunol. 10:649. - PubMed
Publication types
MeSH terms
Substances
LinkOut - more resources
Full Text Sources
Other Literature Sources
Medical
Research Materials
