. 2015 Aug 13;10(8):e0135402.
doi: 10.1371/journal.pone.0135402. eCollection 2015.

Distribution, Numbers, and Diversity of ESBL-Producing E. coli in the Poultry Farm Environment

Affiliations

Distribution, Numbers, and Diversity of ESBL-Producing E. coli in the Poultry Farm Environment

Hetty Blaak et al. PLoS One. .

Abstract

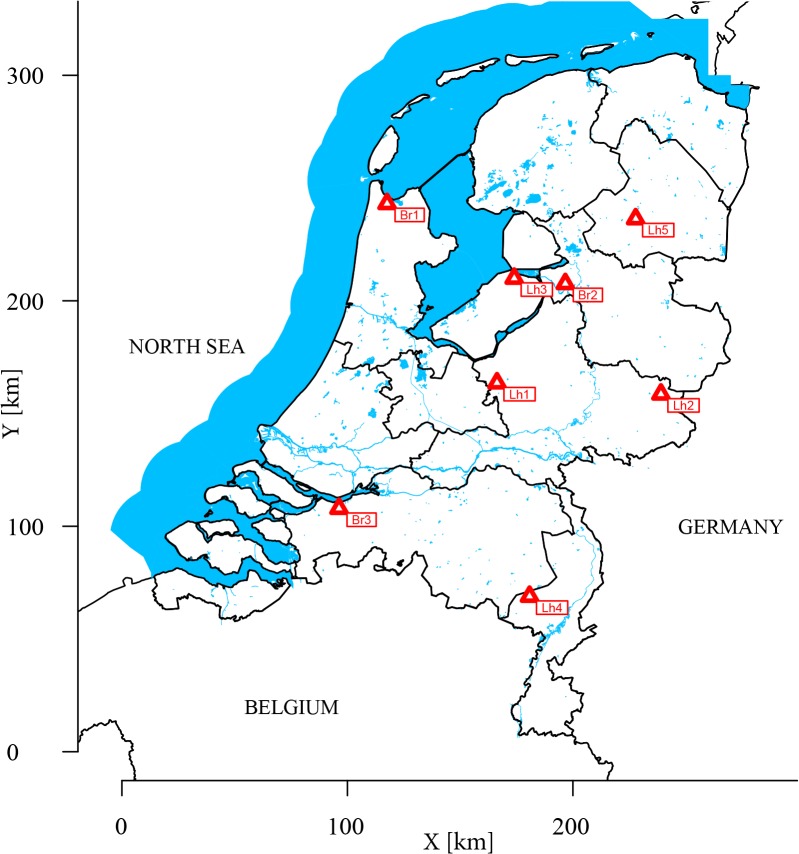
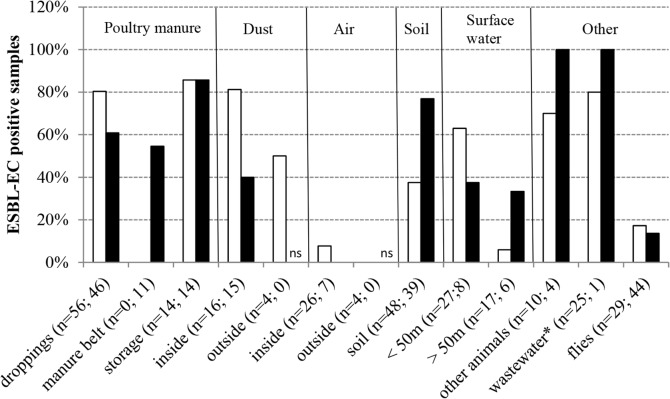
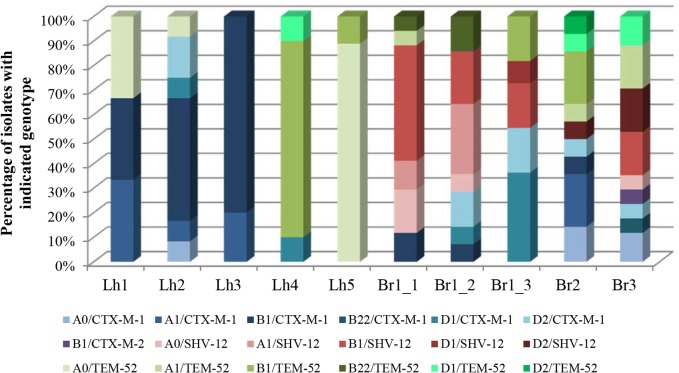
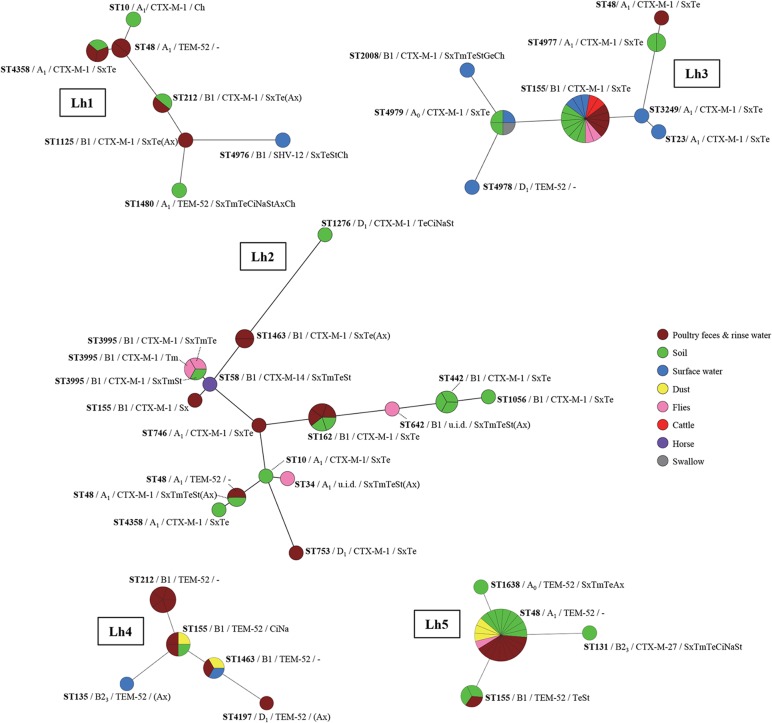
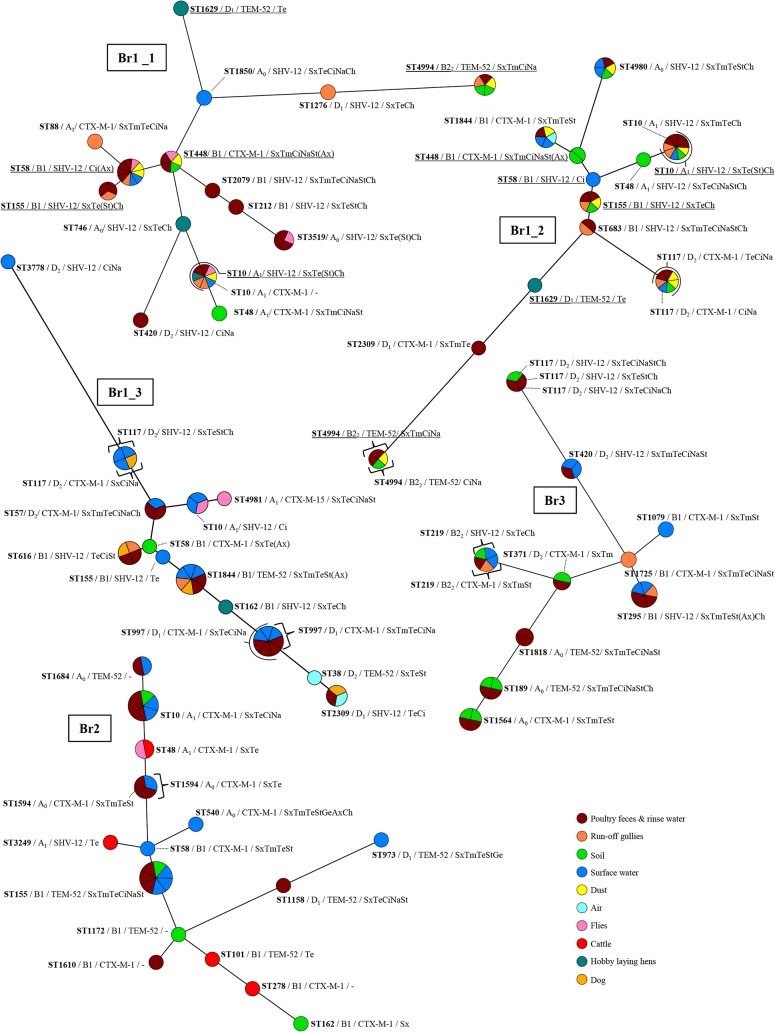
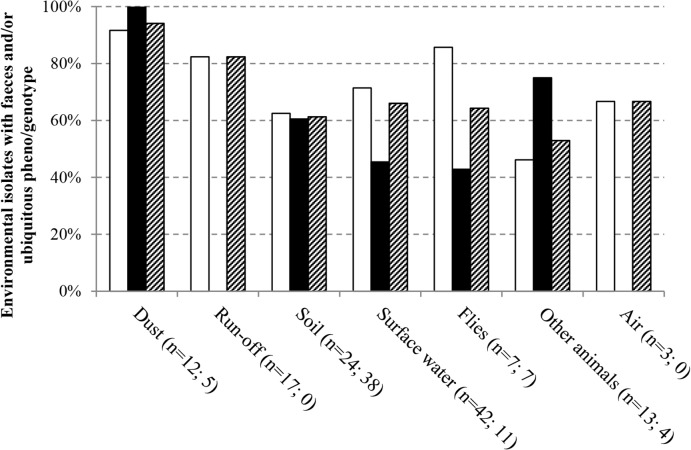
This study aimed to discern the contribution of poultry farms to the contamination of the environment with ESBL-producing Escherichia coli and therewith, potentially to the spread of these bacteria to humans and other animals. ESBL-producing E. coli were detected at all investigated laying hen farms (n = 5) and broiler farms (n = 3) in 65% (46/71) and 81% (57/70) of poultry faeces samples, respectively. They were detected in rinse water and run-off water (21/26; 81%), other farm animals (11/14; 79%), dust (21/35; 60%), surface water adjacent to farms (20/35; 57%), soil (48/87; 55%), on flies (11/73; 15%), and in barn air (2/33; 6%). The highest prevalence and concentrations in the outdoor environment were observed in soil of free-range areas at laying hen farms (100% of samples positive, geometric mean concentration 2.4×10(4) cfu/kg), and surface waters adjacent to broiler farms during, or shortly after, cleaning between production rounds (91% of samples positive, geometric mean concentration 1.9×10(2) cfu/l). The diversity of ESBL-producing E. coli variants with respect to sequence type, phylogenetic group, ESBL-genotype and antibiotic resistance profile was high, especially on broiler farms where on average 16 different variants were detected, and the average Simpson's Indices of diversity (SID; 1-D) were 0.93 and 0.94 among flock and environmental isolates respectively. At laying hen farms on average nine variants were detected, with SIDs of 0.63 (flock isolates) and 0.77 (environmental isolates). Sixty percent of environmental isolates were identical to flock isolates at the same farm. The highest proportions of 'flock variants' were observed in dust (94%), run-off gullies (82%), and barn air (67%), followed by surface water (57%), soil (56%), flies (50%) and other farm animals (35%).The introduction of ESBL-producing E. coli from poultry farms to the environment may pose a health risk if these bacteria reach places where people may become exposed.


Conflict of interest statement

Competing Interests: The authors have declared that no competing interests exist.

Figures

Fig 1
Fig 1. Map of the Netherlands showing locations of the sampled poultry farms.
Fig 2
Fig 2. Prevalence of ESBL-producing E. coli in poultry faeces and environmental samples at laying hen and broiler farms.
White bars represent broiler farms, black bars represent laying hen farms. In between brackets (n = a; b) are indicated the numbers of analysed samples at broiler (a) and laying hen farms (b) respectively; ns = not sampled; *includes water from pits and storage basins as well as run-off water and sediment from gullies.
Fig 3
Fig 3. Diversity among ESBL-producing E. coli variants in poultry faeces and barn rinse water.
Shown are the proportions of ESBL-producing isolates with the indicated phylogenetic group and ESBL-genotype combinations, among the isolates from poultry faeces and barn rinse water sampled from drains and pits. Lh = laying hen farms, Br = broiler farms.
Fig 4
Fig 4. ESBL-producing E. coli variants on laying hen farms.
Maximum parsimony trees constructed based on the concatenated sequences of the seven MLST alleles, using Bionumerics 7.1 software. Node sizes reflect the number of isolates per ST and node colours represent different matrices. Additionally indicated are the phylogenetic group, ESBL-genotype and ABR profiles of isolates in every node (i.e., ST). Note that per sample maximally one isolate of each variant was included, and that multiple isolates of a specific variant reflects detection in multiple samples. ABR profiles represent antibiotics to which resistance was observed additionally to 3rd generation cephalosporins. In between brackets are antibiotics with MICs just above and just below epidemiological cut-off values (i.e. with a maximal 2-fold difference) among isolates with the same ST and/or ESBL genotype. Sx = sulfamethoxazole, Tm = trimethoprim; Te = tetracycline, Ci = ciprofloxacin, Na = nalidixic acid, St = streptomycin, Ge = gentamycin, Ax = amoxicillin+clavulanic acid, Ch = chloramphenicol; u.i.d. = unidentified.
Fig 5
Fig 5. ESBL-producing E. coli variants on broiler farms.
Maximum parsimony trees constructed based on the concatenated sequences of the seven MLST alleles, using Bionumerics 7.1 software. Node sizes reflect the number of isolates per ST and node colours represent different matrices. Additionally indicated are the phylogenetic group, ESBL-genotype and ABR profiles of isolates in every node (i.e., ST). Note that per sample maximally one isolate of each variant was included, and that multiple isolates of a specific variant reflects detection in multiple samples. ABR profiles represent antibiotics to which resistance was observed additionally to 3rd generation cephalosporins. In between brackets are antibiotics with MICs just above and just below epidemiological cut-off values (i.e. with a maximal 2-fold difference) among isolates with the same ST and/or ESBL genotype. Sx = sulfamethoxazole, Tm = trimethoprim; Te = tetracycline, Ci = ciprofloxacin, Na = nalidixic acid, St = streptomycin, Ge = gentamycin, Ax = amoxicillin+clavulanic acid, Ch = chloramphenicol. Br1 was sampled during three production rounds: August/September 2011 (Br1_1), November 2011 (Br1_2), and August/September 2012 (Br1_3); underlined are variants that were detected at multiple time-points.
Fig 6
Fig 6. Relationship between ESBL-producing variants from different matrices.
Indicated are the proportions of isolates from the different environmental matrices, with identical counterparts in manure and rinse water and/or other environmental matrices at the same farm, based on phylogenetic group, ESBL-genotype, ABR profile and ST. White bars represent broiler farms, black bars represent laying hen farms, and hatched bars represent the results for all farms combined.

References

    1. Kümmerer K. Resistance in the environment. J Antimicrob Chemother. 2004;54: 311–320. - PubMed
    1. Wright GD. Antibiotic resistance in the environment: a link to the clinic? Curr Opin Microbiol. 2010;13: 589–594. 10.1016/j.mib.2010.08.005 - DOI - PubMed
    1. Zhang XX, Zhang T, Fang HHP. Antibiotic resistance genes in water environment. Appl Microbiol Biotechnol. 2009;82: 397–414. 10.1007/s00253-008-1829-z - DOI - PubMed
    1. Baquero F, Martínez JL, Cantón R. Antibiotics and antibiotic resistance in water environments. Curr Opin Biotechnol. 2008;19: 260–265. 10.1016/j.copbio.2008.05.006 - DOI - PubMed
    1. Cantón R, Novais A, Valverde A, Machado E, Peixe L, Baquero F, et al. Prevalence and spread of extended-spectrum ß-lactamase-producing Enterobacteriaceae in Europe. Clin Microbiol Infect. 2008;14 Suppl. 1: 144–153. - PubMed

Publication types

MeSH terms

LinkOut - more resources