

The tRNA methyltransferase Dnmt2 is required for accurate polypeptide synthesis during haematopoiesis
- PMID: 26271101
- PMCID: PMC4570521
- DOI: 10.15252/embj.201591382
The tRNA methyltransferase Dnmt2 is required for accurate polypeptide synthesis during haematopoiesis
Abstract
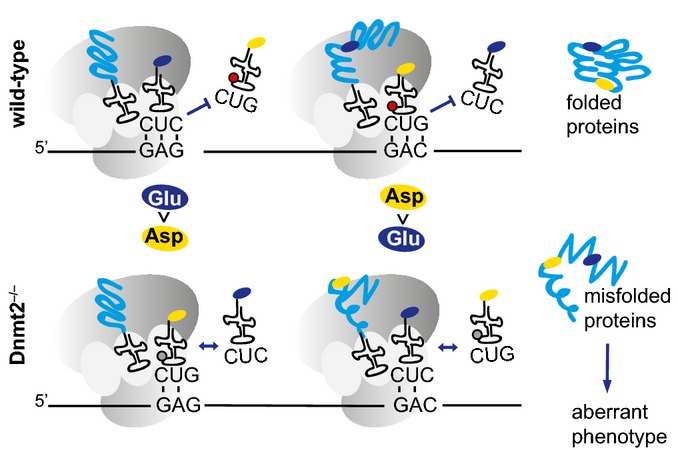
The Dnmt2 enzyme utilizes the catalytic mechanism of eukaryotic DNA methyltransferases to methylate several tRNAs at cytosine 38. Dnmt2 mutant mice, flies, and plants were reported to be viable and fertile, and the biological function of Dnmt2 has remained elusive. Here, we show that endochondral ossification is delayed in newborn Dnmt2-deficient mice, which is accompanied by a reduction of the haematopoietic stem and progenitor cell population and a cell-autonomous defect in their differentiation. RNA bisulfite sequencing revealed that Dnmt2 methylates C38 of tRNA Asp(GTC), Gly(GCC), and Val(AAC), thus preventing tRNA fragmentation. Proteomic analyses from primary bone marrow cells uncovered systematic differences in protein expression that are due to specific codon mistranslation by tRNAs lacking Dnmt2-dependent methylation. Our observations demonstrate that Dnmt2 plays an important role in haematopoiesis and define a novel function of C38 tRNA methylation in the discrimination of near-cognate codons, thereby ensuring accurate polypeptide synthesis.
Keywords: (cytosine‐5) tRNA methylation; Dnmt2; MSCs; haematopoiesis; translation fidelity.
© 2015 The Authors. Published under the terms of the CC BY NC ND 4.0 license.
Figures
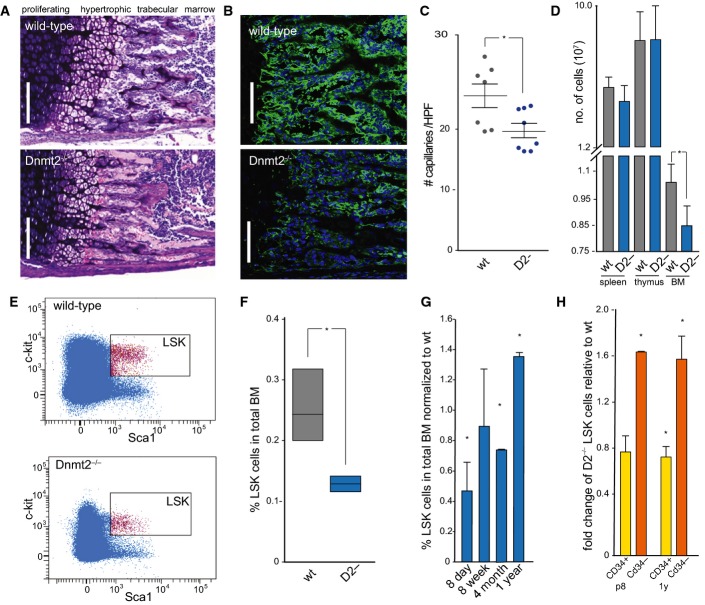
Giemsa staining of a femoral section from 8-day-old mice showing endochondral ossification defects. Scale bar: 100 μm.
Representative femur sections from 8-day-old wild-type and Dnmt2−/− mice. The staining of perivascular cells (GLS, green) is strongly reduced in Dnmt2−/− bone marrow. Nuclei are counterstained with DAPI. Scale bar: 100 μm.
Quantitative analysis of capillary numbers. GLS-positive capillaries were counted in wild-type (wt) and Dnmt2−/− (D2-) mice, in three independent high-power fields (HPF) per mouse (n = 7).
Quantification of cell numbers in haematopoietic tissues of 8-day-old mice (n = 8).
Representative FACS plots of wild-type and Dnmt2−/− BM stained for Lin− Sca1+ and cKit+ cells.
Quantification of bone marrow LSK cells in wild-type (three independent experiments, each with pooled BM samples from 4 to 6 mice) and Dnmt2−/− bone marrow (three independent experiments, each with pooled BM samples of 5–9 mice).
Restoration of the LSK cell population in adult Dnmt2−/− mice. Frequencies of LSK cells were normalized to the frequencies of LSK cells from the bone marrow of wild-type littermates at the indicated age (2–3 independent experiments, each with pooled bone marrow samples from 3 to 9 mice).
Increased LSK CD34− and reduced LSK CD34+ cell populations in 8-day- and 1-year-old Dnmt2−/− mice compared to wild-type (two independent experiments, each with pooled bone marrow samples from 3–9 mice).
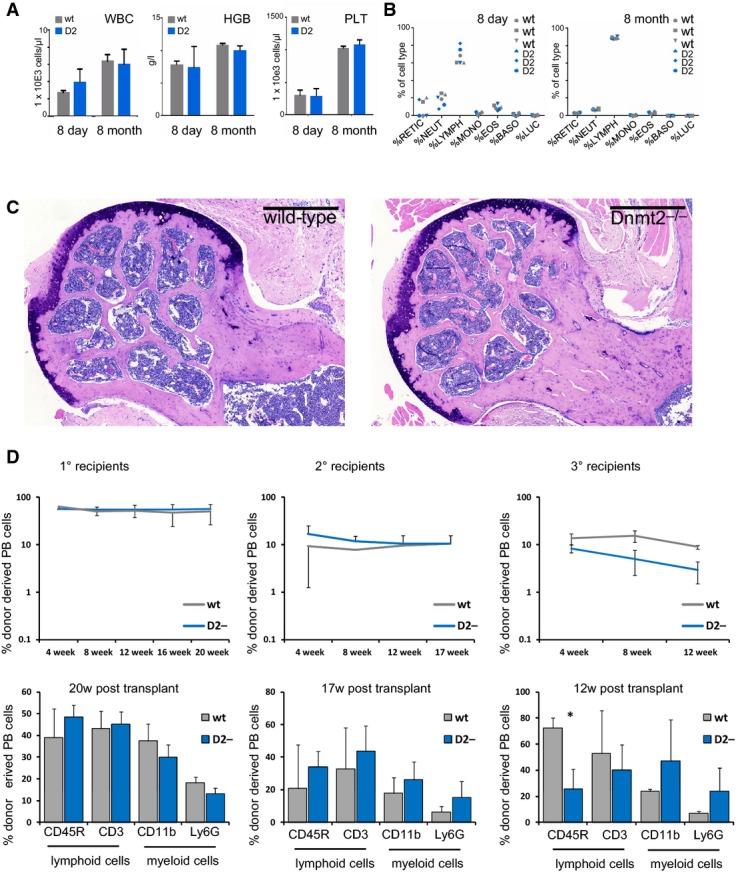
Total blood cell counts of wild-type and Dnmt2−/− mice showing no significant differences. Total white blood cell counts, hemoglobin concentration, and platelet cell counts of wild-type and Dnmt2−/− mice (n = 3 mice per group). WBC: white blood cell counts; HGB: hemoglobin; PLT: platelets.
Lineage distribution of peripheral blood analyzed by the ADVIA hematology analyzer system. RETIC: reticulocytes; NEUT: neutrophiles; LYMPH: lymphocytes; MONO: monocytes; EOS: eosinophiles; BASO: basophiles; LUC: large unstained cells.
Giemsa staining of a representative femoral section from 4-month-old mice showing restoration of ossification defects. Scale bar: 500 μm.
Stable engraftment (upper panels) and multi-lineage reconstitution (lower panels) in wild-type and Dnmt2−/− recipient mice. Donor chimerism is indicated by CD45.1 expression of peripheral blood (PB) cells using flow cytometry. Peripheral blood was collected monthly and analyzed for engraftment and lineage distribution (CD11b: macrophages; Ly6G: granulocytes; CD45R: B cells; CD3: T cells).
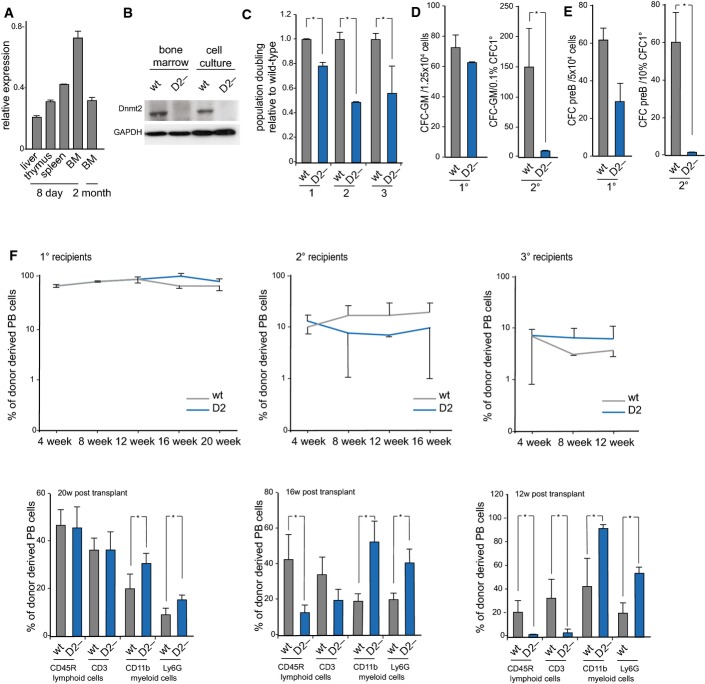
qPCR analysis of Dnmt2 mRNA expression in haematopoietic tissues, normalized to GAPDH.
Western blot analysis of Dnmt2 protein expression in haematopoietic tissues.
Proliferation analysis of primary bone marrow suspension cells. Primary bone marrow suspension cells isolated from the femurs of 8-day-old mice were grown together with the attached stromal cells. Dnmt2−/− population doubling levels of three biological replicates, each plated three times, were calculated relative to wild-type culture.
Reduced replating abilities of primary Dnmt2−/− bone marrow cells in a myeloid colony formation assay. For primary (1°) colony formation, 1.25 × 10⁴ total bone marrow cells were plated in semisolid medium allowing myeloid differentiation. For secondary (2°) colony formation, cells were harvested and 0.1% of primary colonies were replated into semisolid medium. Results are from two independent experiments analyzing 9 wild-type and 13 Dnmt2−/− mice in total.
Reduced secondary CFU-preB colony formation of Dnmt2−/− cells. Numbers of CFU-preB-cell colonies are indicated per 5 × 10⁴ wild-type or Dnmt2−/− total bone marrow cells. 10% of primary colonies were replated into secondary CFU-preB assays.
Stable engraftment (upper panel) and multi-lineage reconstitution (lower panel) of wild-type and Dnmt2−/− bone marrow transplants. CD11b: macrophages; Ly6G: granulocytes; CD45R: B cells; CD3: T cells.
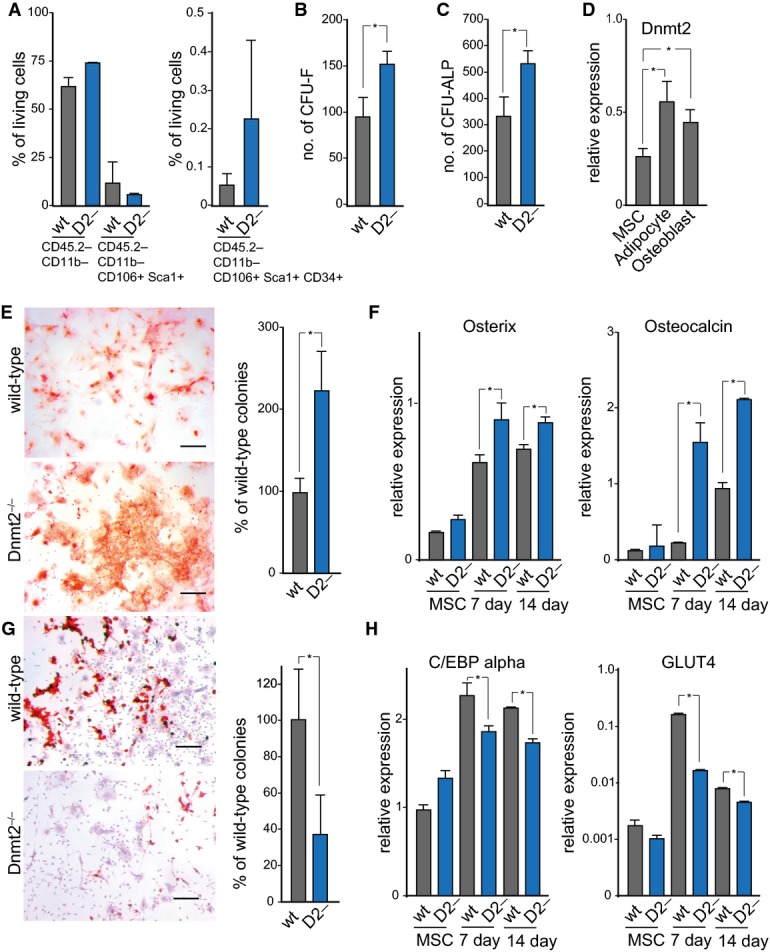
Flow cytometry analysis of bone marrow primary mesenchymal cells.
Quantification of fibroblast colony-forming units (CFU-F).
Quantification of alkaline phosphatase colony-forming units (CFU-ALP).
Dnmt2 expression after 3 days of mesenchymal cell differentiation.
Alizarin Red staining, indicating enhanced osteoblast differentiation of primary stromal cells from Dnmt2−/− mice. Scale bar: 50 μm. Quantification was performed with three biological replicates.
qPCR analysis of the osteoblast markers Osterix and Osteocalcin.
Oil Red O/hematoxylin staining, showing reduced adipocyte differentiation of primary stromal cells from Dnmt2−/− mice. Scale bar: 50 μm. Quantification was performed with three biological replicates.
qPCR analysis of the adipocyte markers CEBp alpha and Glut4.
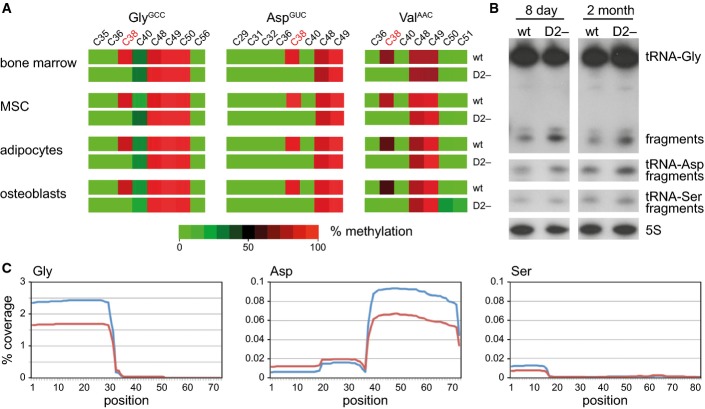
Bisulfite sequencing maps of 454 reads showing the average methylation status of individual cytosines (boxes) within tRNAs from bone marrow (BM), mesenchymal stromal cells (MSC), and in vitro differentiated adipocytes and osteoblasts. Methylation levels are indicated on a color scale from green (unmethylated) to red (completely methylated).
Representative Northern blot showing tRNA(Gly) and tRNA(Asp) fragmentation in bone marrow from 8-day-old and adult mice. tRNA(Ser) was included as a Dnmt2 non-substrate tRNA, and 5S rRNA was included as a loading control.
tRNA fragment coverage for the Dnmt2 substrates tRNA(Gly) and tRNA(Asp), and the non-substrate tRNA(Ser) in bone marrow, as determined by deep sequencing. Wild-type coverage is represented in red, and Dnmt2−/− coverage is indicated in blue. The plots illustrate the specific increase of 5′-halves from tRNA-Gly and 3′-halves from tRNA-Asp fragments in Dnmt2 mutants.
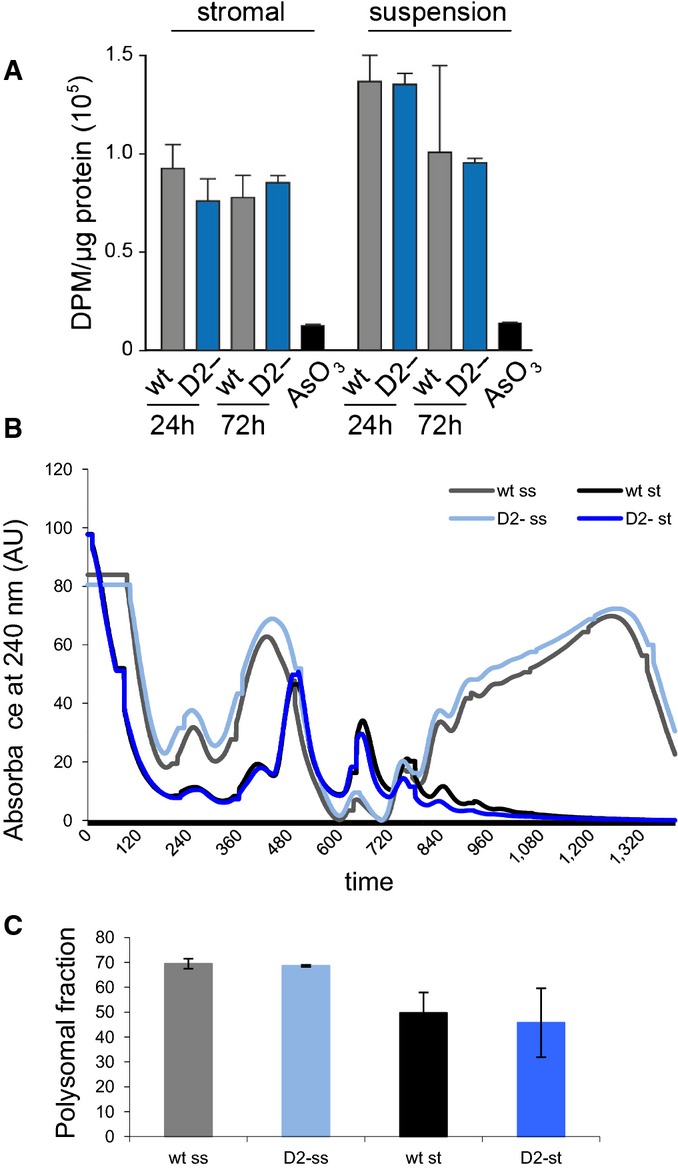
Analysis of total protein synthesis in primary bone marrow stromal and haematopoietic cells by pulse-labeling with 3H-Gly. As a negative control, protein synthesis was blocked in wild-type cells by treatment with 250 μM sodium arsenite (AsO3). Results were obtained from three independent experiments, and error bars represent standard deviations.
Representative polysome profiles from Dnmt2–/– and control primary bone marrow culture. Haematopoietic cells growing in suspension (ss) and attached stromal (st) cells were independently harvested and showed a higher proteins synthesis rate.
As a measure for the global rate of translation, the fraction of polysomal ribosomes was quantified from polysome profiles. Results are shown for two independent biological replicates, and error bars represent standard deviations.
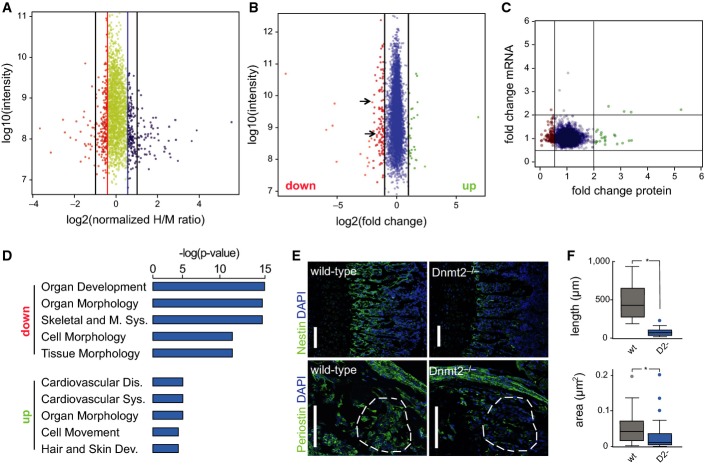
Analysis of protein synthesis by dynamic SILAC. The top 10% of proteins that are translated slower in Dnmt2−/− versus wild-type cells are indicated in orange. The top 10% of proteins that are translated faster in Dnmt2−/− versus wild-type cells are shown in blue. A change of > twofold is indicated by the black lines.
Dimethyl-labeling analysis of 8-day-old mouse bone marrow tissue. Proteins that were down-regulated (< twofold change) in Dnmt2-deficient cells are indicated in red, and up-regulated proteins (> twofold change) are shown in green. Nestin and periostin are marked with arrows.
Correlation between protein and mRNA expression for differentially expressed proteins. Proteins that were down-regulated (< twofold change) in Dnmt2-deficient cells are indicated in red, and up-regulated proteins (> twofold change) are shown in green. The Pearson correlation coefficient is −0.03.
Gene ontology analysis (top 5 categories) of mis-regulated proteins. The top 5 categories are presented.
Representative staining of nestin and periostin in femur sections from 8-day-old wild-type and Dnmt2−/− mice. The anti-periostin staining is comparable in the periosteum of wild-type and Dnmt2−/− mice, but is reduced in the bone marrow cells (compare the highlighted areas). Scale bar: 100 μm. Nuclei are counterstained with DAPI (blue).
Quantitative differences in the length of the nestin-positive trabecular zone (upper panel) between wild-type (30 measurements, three mice) and Dnmt2−/− (21 measurements, two mice) and in bone periostin-positive marrow areas (lower panel) between wild-type (26 measurements, three mice) and Dnmt2−/− (45 measurements, three mice) in femur sections from 8-day-old mice. Data are presented as mean ± SD.
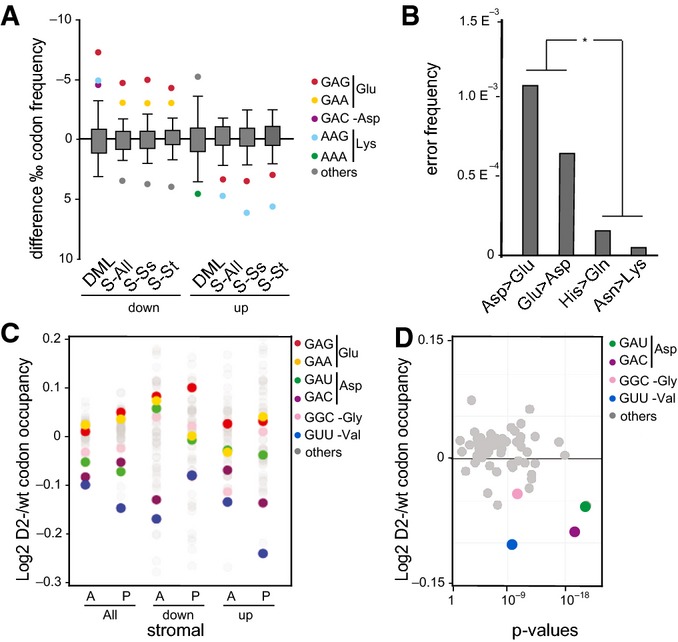
Boxplots with outlier calling showing the significant codon biases in Dnmt2 down-regulated and up-regulated proteins in the DML and dSILAC datasets. For the dSILAC (S-All) dataset, we display the plot for all identified proteins or stromal (S-St) and suspension (S-Ss) cells. A significant increase or decrease of a codon frequency in up- or down-regulated proteins relative to the average frequency of that codon in all identified proteins is displayed as a colored dot. Codons showing no deviation from average values are grouped together in the box.
Frequency of amino acid substitutions in the dSILAC dataset. Differences between Asp > Glu and Glu > Asp transitions versus Asn > Lys and His > Gln were found to be highly significant (P < 0.01, Fisher's exact test).
Changes in bulk codon occupancy in Dnmt2−/− bone marrow primary stromal cells, compared to wild-type cells. Dnmt2 target codons and Glu codons are highlighted with the indicated colors. The two biological replicates of each cell type were pooled. A: ribosomal A-site; P: ribosomal P-site.
Changes in bulk codon occupancy in Dnmt2−/− bone marrow primary stromal cells compared to wild-type cells in the A-site of ribosome were plotted against the P-values obtained in the Kolmogorov–Smirnov test. Dnmt2 target codons are highlighted with the indicated colors.
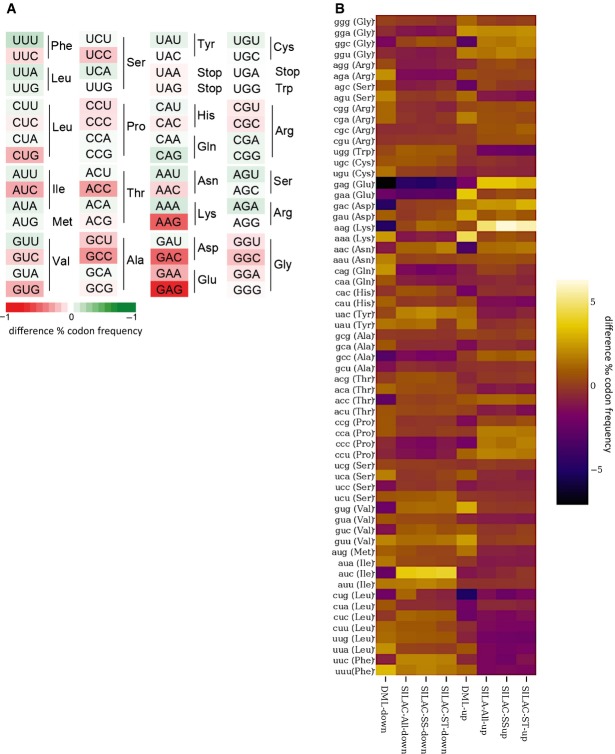
Heatmaps showing the significant codon biases in Dnmt2 down-regulated proteins in the DML dataset. An increase of a codon frequency relative to the average frequency of that codon in all identified proteins is displayed in red, whereas a reduction is depicted in green. Codons showing no deviation from average values are displayed in white according to the scale provided in the figure.
Heatmaps showing codon biases in all protein datasets. Changes of codon frequencies relative to the average frequency of the indicated codon are displayed according to the scale provided in the figure.
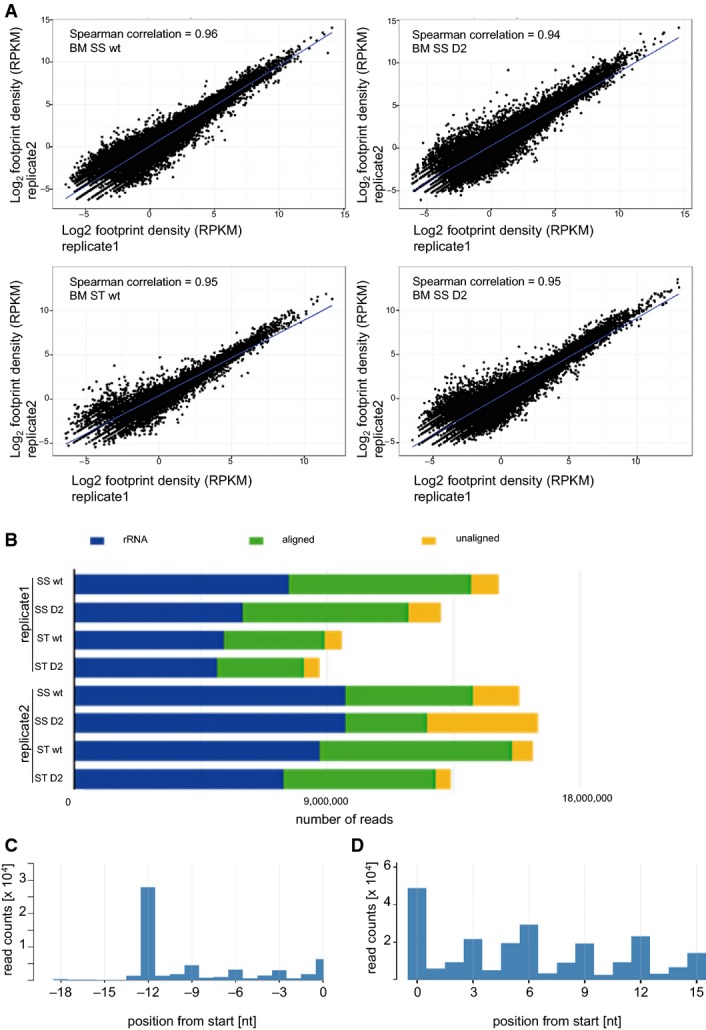
Correlation between ribosome profiling dataset replicates. Haematopoietic cells growing in suspension (ss) and attached stromal cells (st) were independently harvested.
Mapping results from the two independent ribosome profiling replicates.
Representative metaplot of wild-type haematopoietic (ss) cells. 28-mer ribosome footprint reads were summed across all start codons.
Representative in-frame 28-mer ribosome footprint abundance in wild-type haematopoietic (ss) cells showing the correct periodicity.
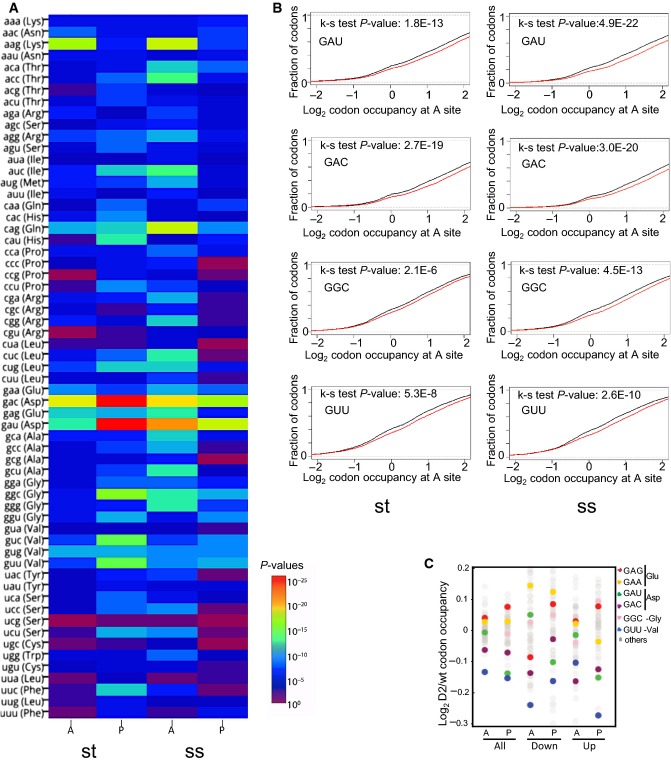
Heatmap of P-values (Kolmogorov–Smirnov test) for all sense codons in wild-type and Dnmt2−/− ribosome A and P sites. The two biological replicates of each cell type were pooled. A: ribosomal A-site; P: ribosomal P-site; st: stromal cells, ss: suspension cells.
Cumulative distributions of single-codon occupancy for select codons in wild-type and Dnmt2−/− stromal (st) and suspension (ss) cells.
Changes in bulk codon occupancy in Dnmt2−/− bone marrow suspension cells versus wild-type cells. Dnmt2 target codons and Glu codons are highlighted with the indicated colors. The two biological replicates of each cell type were pooled. A: ribosomal A-site; P: ribosomal P-site.
References
-
- Agris PF, Vendeix FA, Graham WD. tRNA's wobble decoding of the genome: 40 years of modification. J Mol Biol. 2007;366:1–13. - PubMed
Publication types
MeSH terms
Substances
Associated data
- Actions
LinkOut - more resources
Full Text Sources
Other Literature Sources
Medical
Molecular Biology Databases
