

Notch signaling regulates gastric antral LGR5 stem cell function
- PMID: 26271103
- PMCID: PMC4609184
- DOI: 10.15252/embj.201490583
Notch signaling regulates gastric antral LGR5 stem cell function
Abstract
The major signaling pathways regulating gastric stem cells are unknown. Here we report that Notch signaling is essential for homeostasis of LGR5(+) antral stem cells. Pathway inhibition reduced proliferation of gastric stem and progenitor cells, while activation increased proliferation. Notch dysregulation also altered differentiation, with inhibition inducing mucous and endocrine cell differentiation while activation reduced differentiation. Analysis of gastric organoids demonstrated that Notch signaling was intrinsic to the epithelium and regulated growth. Furthermore, in vivo Notch manipulation affected the efficiency of organoid initiation from glands and single Lgr5-GFP stem cells, suggesting regulation of stem cell function. Strikingly, constitutive Notch activation in LGR5(+) stem cells induced tissue expansion via antral gland fission. Lineage tracing using a multi-colored reporter demonstrated that Notch-activated stem cells rapidly generate monoclonal glands, suggesting a competitive advantage over unmanipulated stem cells. Notch activation was associated with increased mTOR signaling, and mTORC1 inhibition normalized NICD-induced increases in proliferation and gland fission. Chronic Notch activation induced undifferentiated, hyper-proliferative polyps, suggesting that aberrant activation of Notch in gastric stem cells may contribute to gastric tumorigenesis.
Keywords: gastric cancer; gastric organoids; gastric stem cells; gland fission; mTOR.
© 2015 The Authors.
Figures
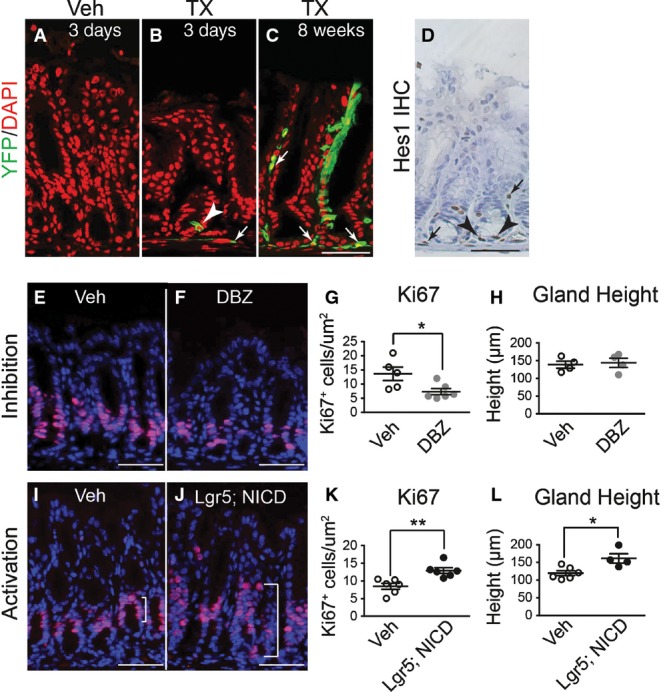
A–C Frozen tissue sections from the gastric antrum of vehicle- (A) or tamoxifen (TX)-treated (B and C) NIP1::CreERT2ROSAEYFP mice immunostained for YFP expression to evaluate lineage tracing 3 days (B) or 8 weeks (C) after treatment. Both epithelial (arrowhead) and mesenchymal (arrows) cells exhibit active Notch1 signaling (EYFP expression). DAPI (red) was used as a nuclear counterstain. Scale bar: 50 μm.
D Paraffin section immunostained for HES1 showing both epithelial (arrowheads) and mesenchymal (arrows) cell expression. Scale bar: 50 μm.
E–G Paraffin sections from (E) vehicle- (n = 5) or (F) DBZ-treated (n = 6) mice were immunostained for the proliferation marker Ki67 (red), and (G) the number of Ki67+ cells quantified (mean ± SE). DAPI (blue) was used as a nuclear counterstain. Scale bars: 50 μm. *P = 0.03 versus vehicle using Student's t-test.
H Analysis of antral gland height in vehicle- (n = 4) or DBZ-treated (n = 4) mice (mean ± SE).
I–K Paraffin sections from (I) vehicle- (n = 6) or (J) TX-treated (n = 6) Lgr5; ROSANICD mice were immunostained for the proliferation marker Ki67 (red), and (K) the number of Ki67+ cells quantified (mean ± SE). DAPI (blue) was used as a nuclear counterstain. Scale bars: 50 μm. **P = 0.004 versus vehicle using Student's t-test.
L Analysis of antral gland height in vehicle- (n = 6) or TX-treated (n = 4) Lgr5; ROSANICD mice (mean ± SE). *P = 0.016 versus vehicle using Student's t-test.
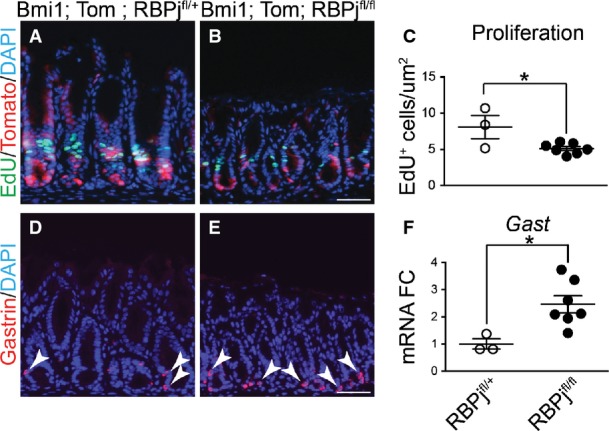
A–C Proliferation was measured in antral paraffin sections via EdU detection after incorporation for 2 h (mean ± SEM). *P = 0.023 versus RBPjfl/+ using Student's t-test.
D, E Cellular differentiation was measured by immunostaining for gastrin-expressing endocrine cells. Scale bars: 50 μm.
F Gastrin gene expression was measured by qRT–PCR analysis of antral RNA (mean ± SEM;n = 3–7 mice). *P = 0.02 versus RBPjfl/+ using Student's t-test.

A–D Gastric stem cell proliferation was measured by morphometric analysis of GFP/Ki67 cell numbers in Notch-inhibited or Notch-activated antral tissue, showing decreased LGR5-GFP stem cell proliferation after DBZ treatment (A, n = 5) and increased stem cell proliferation in Lgr5; ROSANICD mice (C, n = 4) 1 month post-TX treatment. *P = 0.046 and **P = 0.002 versus vehicle using Student's t-test. (B, D) Olfm4 gene expression was measured by qRT–PCR in antral RNA from vehicle (n = 10) versus DBZ (n = 9) (*P = 0.033 using Student's t-test) and vehicle (n = 3) versus Lgr5; ROSANICD mice (n = 3) (*P = 0.026 using Student's t-test) 1 month post-TX treatment. Data are expressed as mean ± SE.
E–H Antral organoids were established from gastric glands isolated from mice treated with vehicle or DBZ, or from control (Lgr5) or Lgr5; ROSANICD mice 1 week post-TX. Scale bars: 200 μm.
I–L Plating efficiency of antral organoids established from (I) vehicle (n = 3) or DBZ-treated (n = 3) mice (*P = 0.046 using Student's t-test) or (K) Lgr5 (n = 3) or Lgr5; ROSANICD mice (n = 3) 1 week post-TX (*P = 0.012 using Student's t-test). The number of organoids was counted 48 h post-plating, and normalized to the number of glands initially plated. (J, L) Organoid size was measured 4 days post-plating. (L) *P = 0.025 versus Lgr5 using Student's t-test. Data are expressed as mean ± SE.
M–O Single Lgr5-GFP stem cells were isolated by FACS from vehicle (n = 4) or DBZ-treated (n = 4) mice. See Appendix Fig S4 for FACS gating scheme. (O) Organoid establishment efficiency was quantified 3 days post-plating. *P = 0.014 versus vehicle using Student's t-test. Data are expressed as mean ± SE.
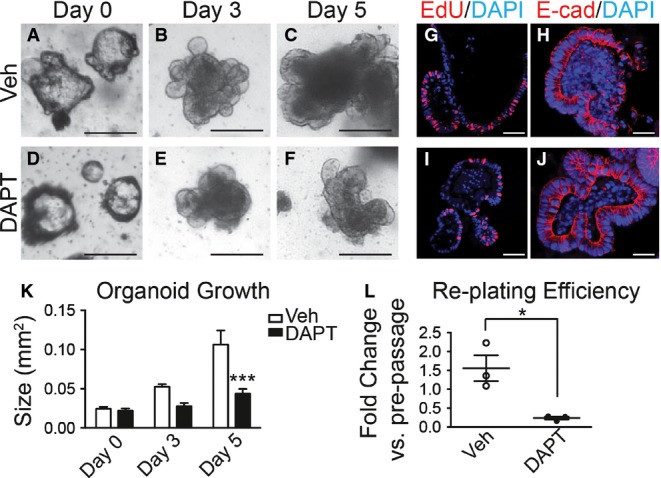
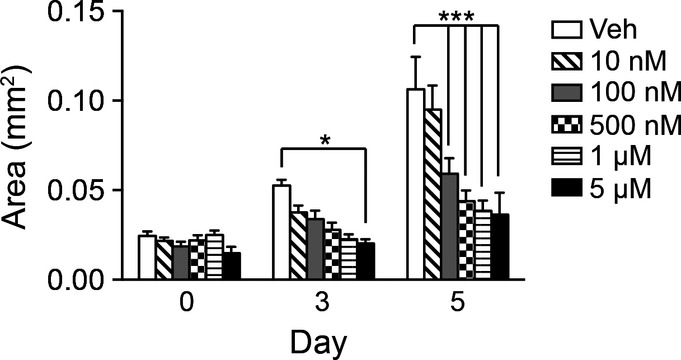
A–F Growth was measured in established antral organoids after Notch inhibition. Morphology of antral organoids prior to treatment (A, D, day 0), or after treatment with vehicle (B, C) or 500 nM DAPT (E, F) for 3 and 5 days. Scale bars: 200 μm.
G–J Frozen sections of vehicle- and DAPT-treated organoids stained for cellular proliferation by EdU incorporation (red) (G, I) and for cell morphology by immunostaining for E-cadherin (red) (H, J). Scale bars: 50 μm.
K Growth was determined in vehicle- or DAPT-treated organoids by measuring size (mean ± SEM;n = 16–30 organoids per group); ***P < 0.001 versus vehicle using two-way ANOVA.
L Efficiency of organoid re-establishment after 5 days of treatment with vehicle or DAPT (mean ± SEM;n = 3 wells per group); *P = 0.019 versus vehicle using Student's t-test.
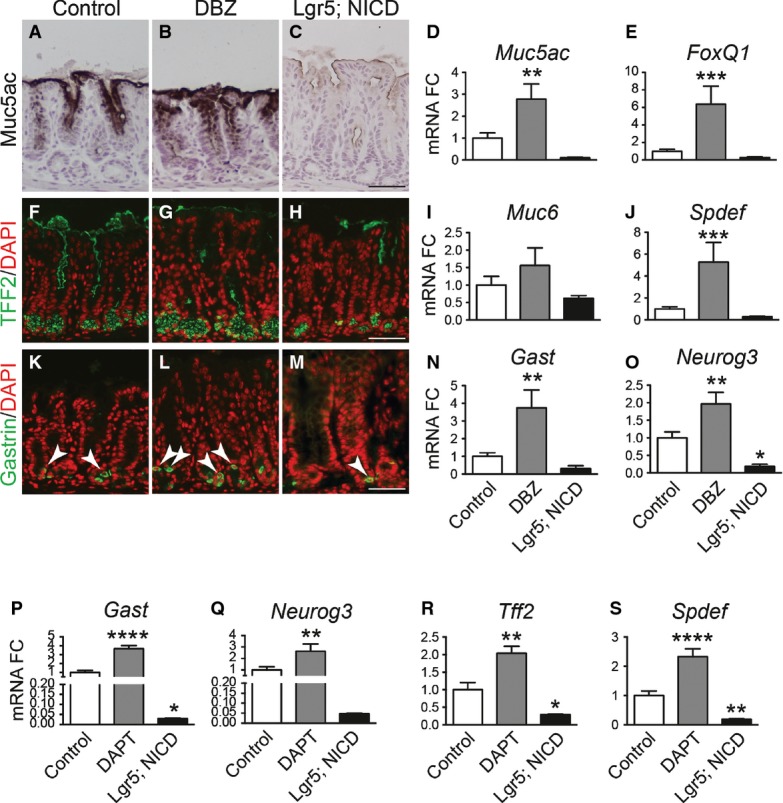
A–O Analysis of surface mucous cells (A–E), deep mucous cells (F-J) or endocrine cells (K-O) by immunohistochemical analysis of antral paraffin sections and qRT–PCR analysis of antral RNA in control, DBZ and Lgr5; ROSANICD 4 weeks post-TX (mean ± SEM;n = 3–18 mice). *P < 0.05, **P < 0.01, ***P < 0.001 versus control using one-way ANOVA. Scale bars: 50 μm.
P–S Analysis of endocrine and deep mucous cell lineages in control (n = 16), DAPT-treated (n = 8) and Lgr5; ROSANICD (n = 8) antral organoids (mean ± SEM). *P < 0.05, **P < 0.01, ****P < 0.0001 versus control using one-way ANOVA.
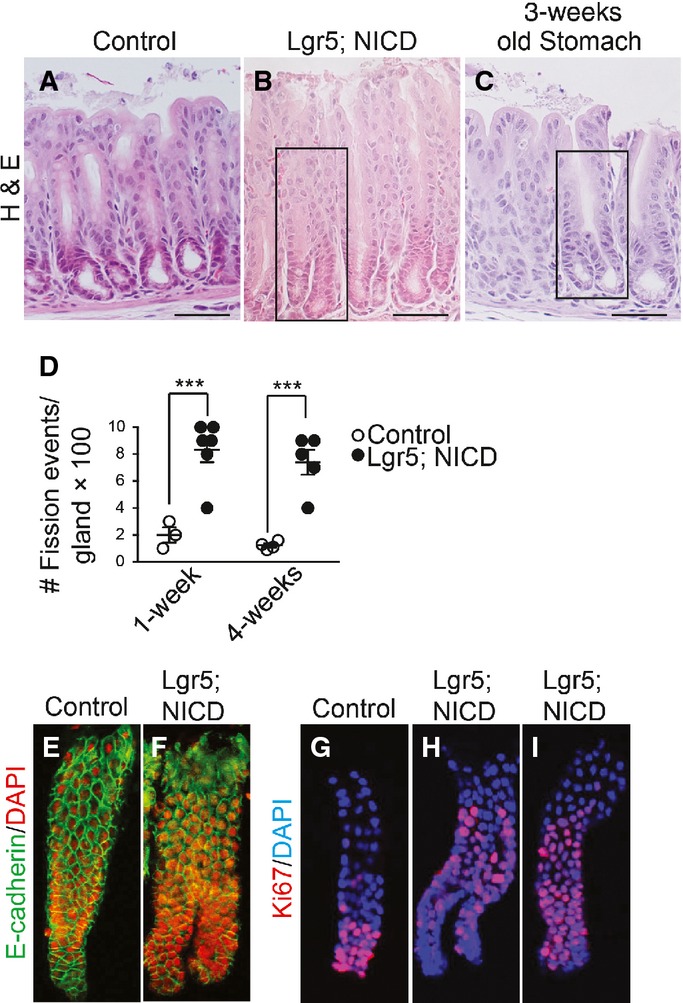
A–C H&E-stained paraffin sections from (A) control or (B) Lgr5; ROSANICD stomach 4 weeks post-vehicle or TX treatment, or from (C) 3-week-old wild-type mouse stomach. Scale bars: 50 μm. Black rectangles indicate antral glands undergoing fission.
D Quantification of gland fission events in control (Lgr5) and Lgr5; ROSANICD stomachs 1 or 4 weeks post-TX (mean ± SEM;n = 3–6 mice). ***P < 0.001 versus control using two-way ANOVA.
E–I Confocal microscopic analysis of isolated glands immunostained for E-cadherin (green) with DAPI (red), or Ki67 (red) with DAPI (blue).
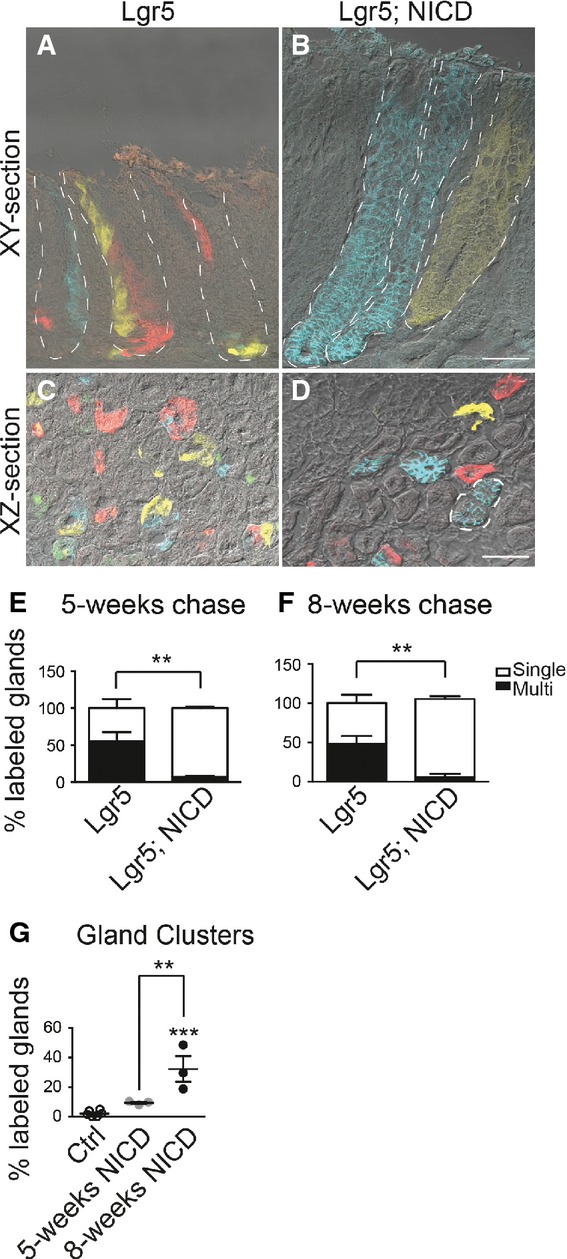
A–D Frozen tissue sections from Lgr5; ROSACon (Lgr5) (A, C) and Lgr5; ROSACon; ROSANICD mice (Lgr5; NICD) (B, D) imaged for native YFP (yellow), RFP (red), membrane-bound CFP (blue), and nuclear GFP (green) fluorescence using confocal microscopy. Tissue was analyzed 8 weeks post-TX. White dashed lines outline individual glands (A, B) or a gland cluster (D). Scale bars: 50 μm.
E, F Quantification of antral glands composed of multiple or single Confetti colors in Lgr5; ROSACon and Lgr5; ROSACon; ROSANICD mice (mean ± SEM;n = 3 mice) 5 or 8 weeks post-TX. **P < 0.01 versus control using two-way ANOVA.
G Quantification of single-colored clustered antral glands in Lgr5; ROSACon and Lgr5; ROSACon; ROSANICD mice (mean ± SEM;n = 3 mice) 5 or 8 weeks post-TX. Controls are pooled from both time points. ***P < 0.001 versus control, **P < 0.01 versus 5 weeks using one-way ANOVA.
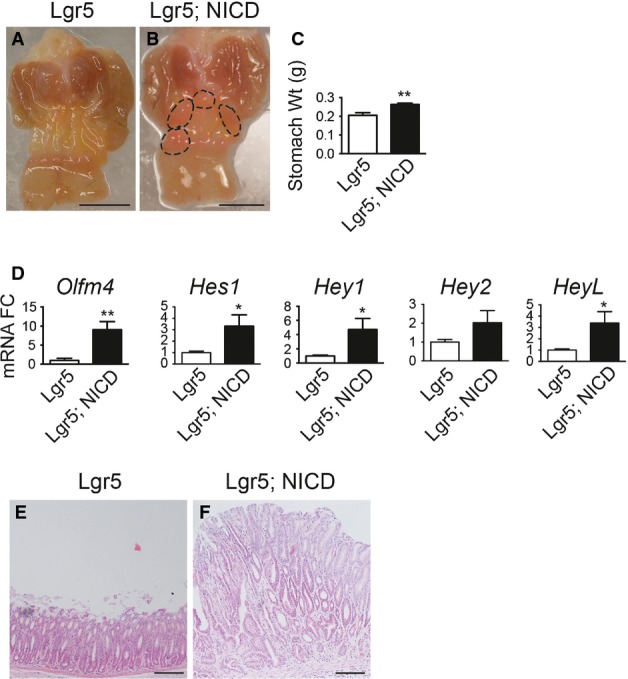
A, B Gross histology of (A) Lgr5 and (B) Lgr5; ROSANICD stomach 6 months post-TX. Circles outline polyp areas. Scale bars: 0.5 cm.
C Weight of control and Lgr5; ROSANICD stomach 6 months post-TX (mean ± SEM;n = 7 mice). **P = 0.003 versus control using Student's t-test.
D qRT–PCR analysis of Notch target gene expression (mean ± SEM;n = 7 mice). *P < 0.05 or **P < 0.01 versus control using Student's t-test.
E, F H&E-stained paraffin sections from (E) Lgr5 and (F) Lgr5; ROSANICD antrum revealed hypertrophic, disorganized glands after Notch activation. Scale bars: 100 μm.
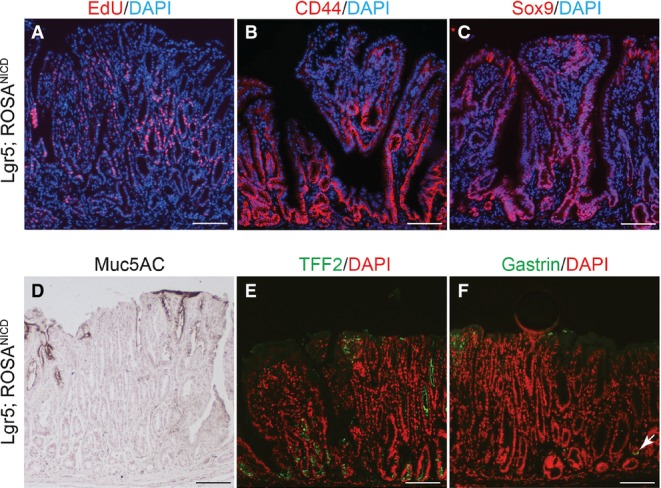
A–C Paraffin sections from Lgr5; ROSANICD stomach 6–12 months post-TX were stained for (A) proliferation by EdU incorporation (red) or immunostained for (B) CD44 or (C) Sox9. DAPI (blue) was used as a nuclear counterstain. Scale bars: 100 μm.
D–F Immunohistochemical analysis of (D) surface mucous cells (Muc5ac), (E) deep mucous cells (TFF2) and (F) endocrine cells (Gastrin) in Lgr5; ROSANICD mice 6–12 months post-TX. Compare Fig4 for normal tissue staining. Scale bars: 100 μm.
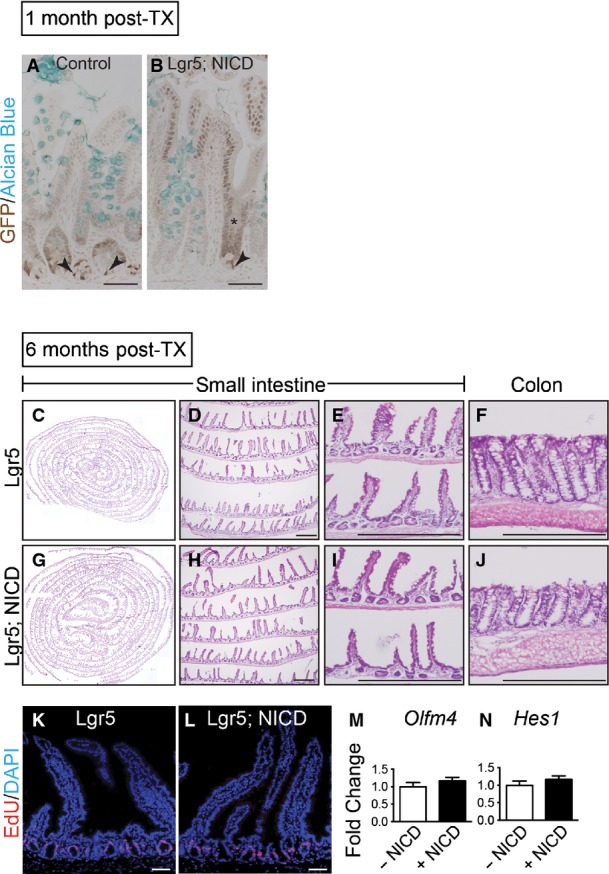
A, B Goblet cells in NICD+ ileal crypts were analyzed by co-staining for GFP (cytoplasmic, Lgr5; nuclear, NICD) and Alcian Blue in control (n = 3) or Lgr5; ROSANICD (n = 3) mice 1 month post-TX. Nuclear GFP was observed in a patchy pattern consistent with the known mosaic expression pattern of Lgr5-EGFP-IRES-CreERT2. Recombined crypts with NICD-GFP expression (asterisk) in Lgr5; ROSANICD mice exhibited a reduction in goblet cells, in accordance with the known effect of Notch signaling to block secretory cell differentiation. Arrowheads indicate LGR5-GFP+ intestinal stem cells at the base of the crypts. Scale bars: 50 μm.
C–J No polyps were observed in intestine 6 months after TX induction of NICD. H&E analysis of Lgr5 control (n = 7) (C–F) and Lgr5; ROSANICD (n = 7). (G–J) small intestine (C–E; G–I) and colon (F, J). Scale bars: 100 μm.
K, L Proliferation was measured by EdU incorporation and found to be unchanged in Lgr5; ROSANICD mice. Scale bars: 50 μm.
M, N qRT–PCR analysis of Olfm4 and Hes1 in Lgr5 and Lgr5; ROSANICD intestine revealed no change to stem cell marker or Notch target gene expression. Data are expressed as mean ± SEM (n = 7 mice per group).
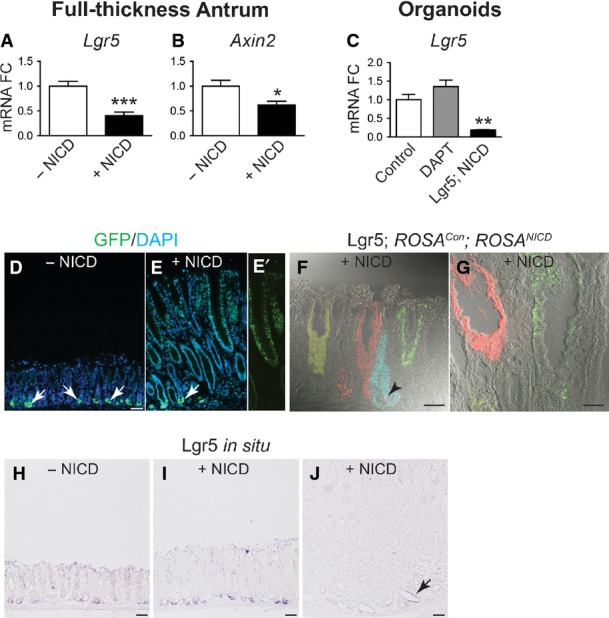
A–C qRT–PCR analysis for Wnt target genes Lgr5 (A) and Axin2 (B) in control (n = 7) and Lgr5; ROSANICD (n = 7) mice 1 year post-TX, or Lgr5 (C) in control, DAPT-treated and Lgr5; ROSANICD antral organoids (n = 8 per group) (mean ± SE). *P < 0.05 and ***P < 0.001 vs. −NICD using Student's t-test. **P < 0.01 vs. Control using one-way ANOVA.
D, E GFP immunostaining in control and Lgr5; ROSANICD mice 1 year post-TX. NICD activation showed lack of cytoplasmic Lgr5-GFP expression in hyperplastic polyps. Arrows indicate cytoplasmic Lgr5-GFP+ stem cells at the gland base. (E′) Prominent nuclear GFP resulting from NICD activation in Lgr5; ROSANICD antral polyp. Scale bars: 50 μm.
F, G Lgr5 re-tracing with the ROSACon reporter in Lgr5; ROSANICD mice. Re-tracing was observed in non-polyp tissue (F; arrowhead), but not in a polyp region (G). Scale bars: 50 μm.
H–J Lgr5 in situ hybridization in control and Lgr5; ROSANICD mice 1 year post-TX. Lgr5 expression (J; arrow) was markedly reduced in polyp areas. Scale bars: 50 μm.
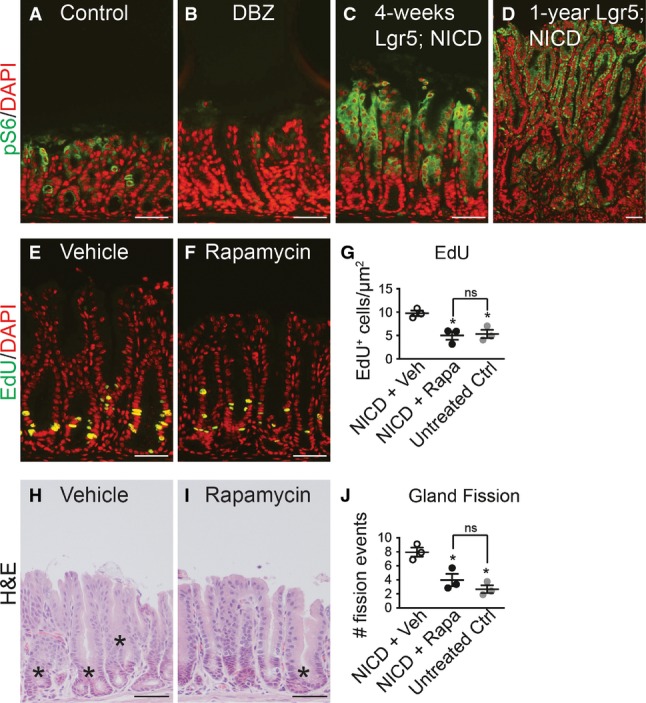
A–D Paraffin sections from (A) control, (B) DBZ-treated and Lgr5; ROSANICD stomachs either (C) 1 month or (D) 1 year post-TX immunostained for phospho-S6 (pS6, green). DAPI (red) was used as a nuclear counterstain. Scale bars: 50 μm.
E, F Proliferation was measured via EdU incorporation on paraffin sections from TX-treated Lgr5; ROSANICD stomachs after treatment with (E) vehicle or (F) 4 mg/kg rapamycin twice per week for 3 weeks. Scale bars: 50 μm.
G Quantification of proliferation in vehicle- (n = 3) and rapamycin-treated (n = 3) Lgr5; ROSANICD mice, or untreated C57BL/6 mice (n = 3) by morphometrics of EdU incorporation (mean ± SEM). *P < 0.05 versus vehicle-treated NICD using one-way ANOVA.
H, I H&E-stained paraffin sections from (H) vehicle- and (I) rapamycin-treated Lgr5; ROSANICD mice. Asterisks illustrate gland fission. Scale bars: 50 μm.
J Morphometric analysis of antral gland fission in vehicle (n = 3) and rapamycin-treated (n = 3) Lgr5; ROSANICD mice, or untreated C57BL/6 mice (n = 3) (mean ± SEM). *P < 0.05 versus vehicle-treated NICD using one-way ANOVA.
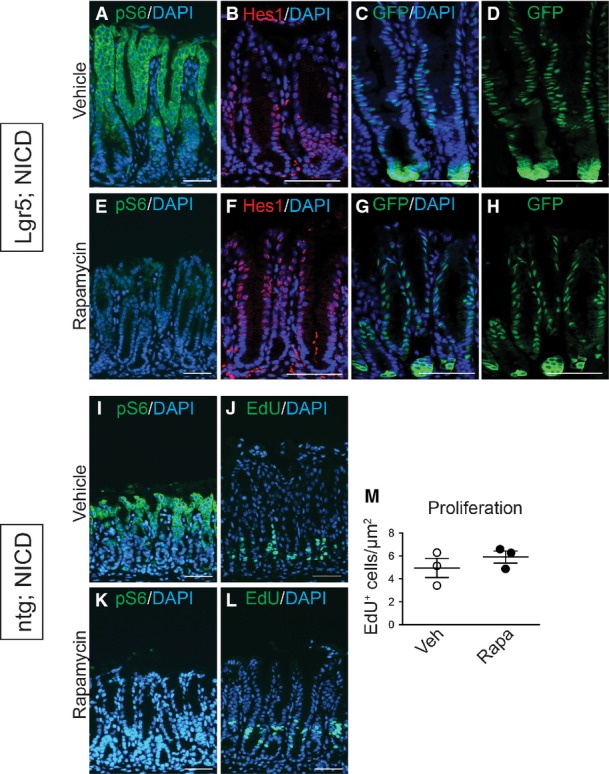
A–L pS6 expression in vehicle (A, I) and rapamycin-treated (E, K) Lgr5; ROSANICD or control (ntg; ROSANICD) mice shows effective blockade of mTORC1. Immunostaining for Hes1 (B, F) and NICD-GFP (C, D, G, H) revealed no change to Notch signaling or expression of the ROSANICD transgene (nuclear GFP) during rapamycin treatment of Lgr5; ROSANICD mice. (J, L) Cellular proliferation was measured via EdU incorporation in vehicle or rapamycin-treated control (ntg; ROSANICD) mice, and (M) numbers of EdU+ cells were quantified via morphometric analysis. Data are expressed as mean ± SEM (n = 4 mice per group). Scale bars: 5 0 μm.
Comment in
-
Stomaching Notch.EMBO J. 2015 Oct 14;34(20):2489-91. doi: 10.15252/embj.201592859. Epub 2015 Sep 10. EMBO J. 2015. PMID: 26358838 Free PMC article.
References
-
- Barker N, van Es JH, Kuipers J, Kujala P, van den Born M, Cozijnsen M, Haegebarth A, Korving J, Begthel H, Peters PJ, Clevers H. Identification of stem cells in small intestine and colon by marker gene Lgr5. Nature. 2007;449:1003–1007. - PubMed
-
- Barker N, Huch M, Kujala P, van de Wetering M, Snippert HJ, van Es JH, Sato T, Stange DE, Begthel H, van den Born M, Danenberg E, van den Brink S, Korving J, Abo A, Peters PJ, Wright N, Poulsom R, Clevers H. Lgr5(+ve) stem cells drive self-renewal in the stomach and build long-lived gastric units in vitro. Cell Stem Cell. 2010;6:25–36. - PubMed
-
- Bell SM, Schreiner CM, Wert SE, Mucenski ML, Scott WJ, Whitsett JA. R-spondin 2 is required for normal laryngeal-tracheal, lung and limb morphogenesis. Development. 2008;135:1049–1058. - PubMed
-
- Bellacosa A, Kumar CC, Di Cristofano A, Testa JR. Activation of AKT kinases in cancer: implications for therapeutic targeting. Adv Cancer Res. 2005;94:29–86. - PubMed
Publication types
MeSH terms
Substances
Grants and funding
- P01 DK062041/DK/NIDDK NIH HHS/United States
- F32-DK093349/DK/NIDDK NIH HHS/United States
- P30-CA6592/CA/NCI NIH HHS/United States
- T32-GM07863/GM/NIGMS NIH HHS/United States
- T32-HD007515/HD/NICHD NIH HHS/United States
- T32 HD007505/HD/NICHD NIH HHS/United States
- P50 CA130810/CA/NCI NIH HHS/United States
- T32 GM007863/GM/NIGMS NIH HHS/United States
- T32 GM008322/GM/NIGMS NIH HHS/United States
- R01 DK096972/DK/NIDDK NIH HHS/United States
- P30 DK034933/DK/NIDDK NIH HHS/United States
- F30 DK095517/DK/NIDDK NIH HHS/United States
- P50-CA130810/CA/NCI NIH HHS/United States
- P30-DK34933/DK/NIDDK NIH HHS/United States
- T32-GM008322/GM/NIGMS NIH HHS/United States
- F30-DK095517/DK/NIDDK NIH HHS/United States
- F32 DK093349/DK/NIDDK NIH HHS/United States
- T32-DK094775/DK/NIDDK NIH HHS/United States
- T32 DK094775/DK/NIDDK NIH HHS/United States
- P01-DK062041/DK/NIDDK NIH HHS/United States
LinkOut - more resources
Full Text Sources
Other Literature Sources
Medical
Molecular Biology Databases
Miscellaneous
