. 2015 Oct 15;126(16):1911-20.
doi: 10.1182/blood-2015-04-640912. Epub 2015 Aug 13.

DC-SIGN-expressing macrophages trigger activation of mannosylated IgM B-cell receptor in follicular lymphoma

Affiliations

DC-SIGN-expressing macrophages trigger activation of mannosylated IgM B-cell receptor in follicular lymphoma

Rada Amin et al. Blood. .

Abstract

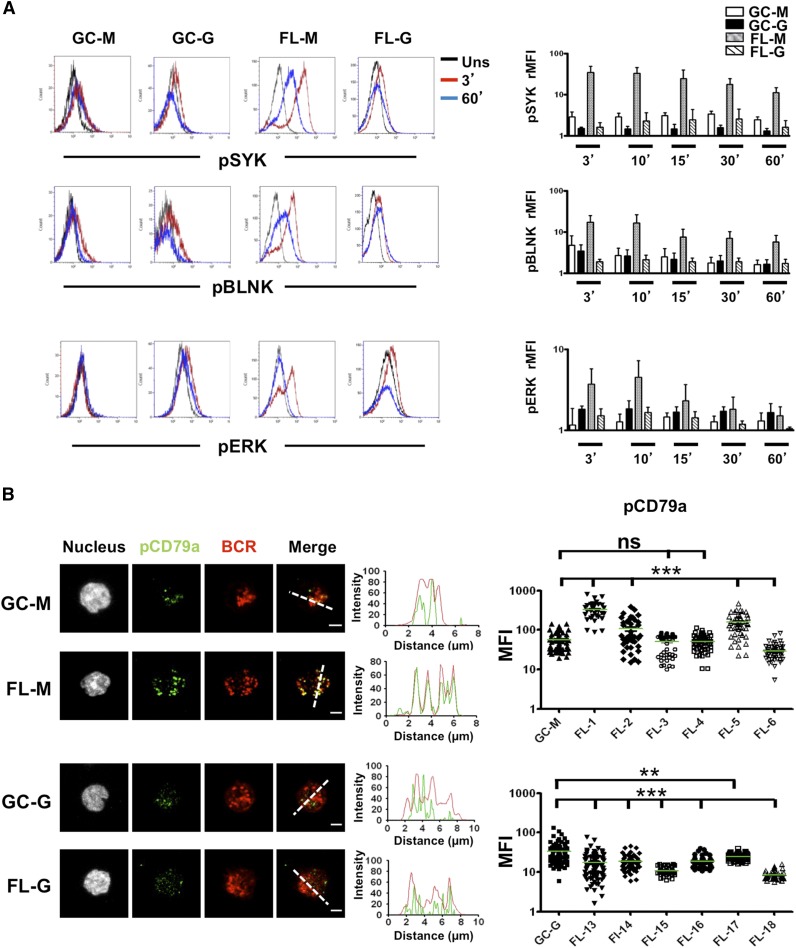
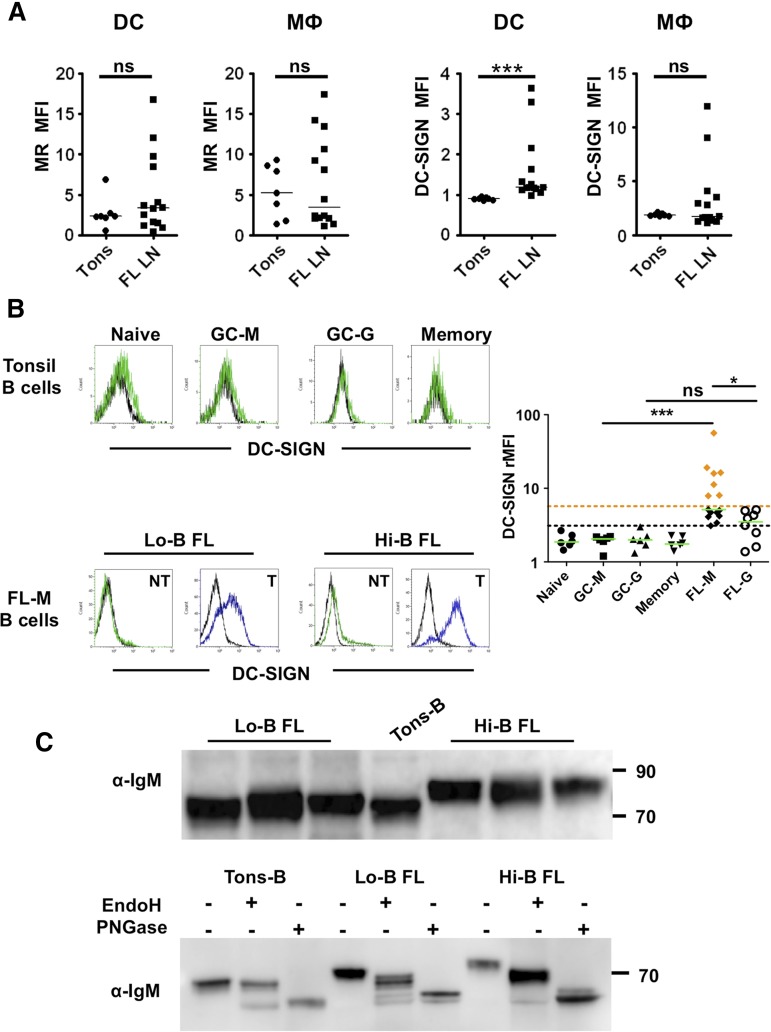
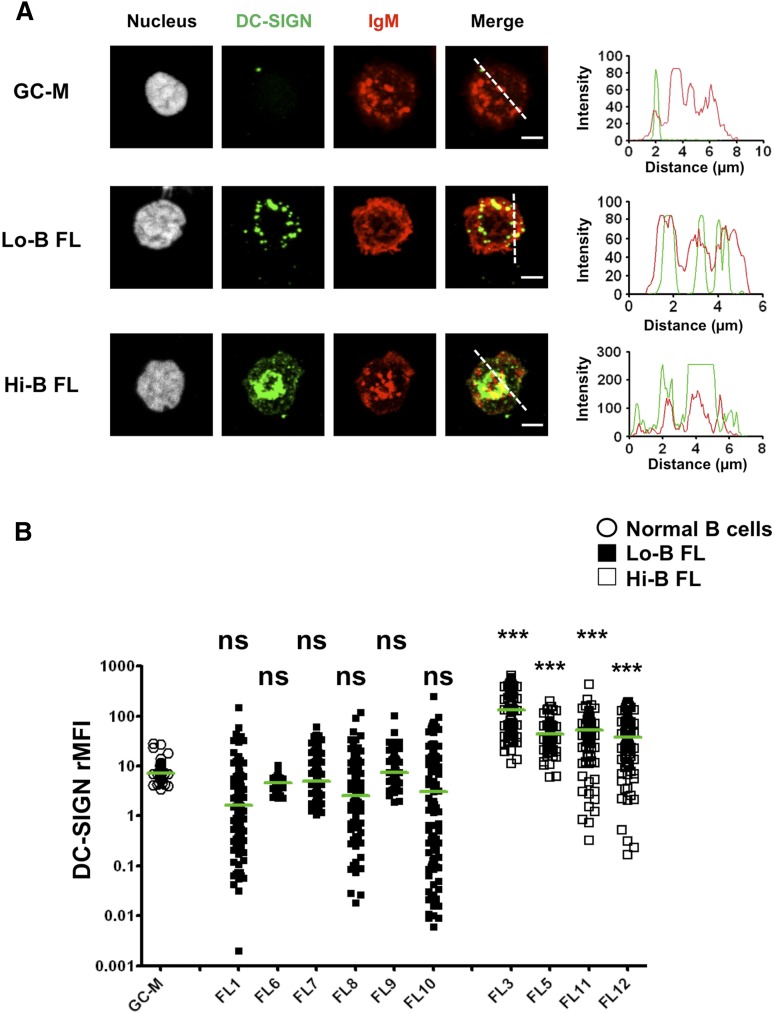
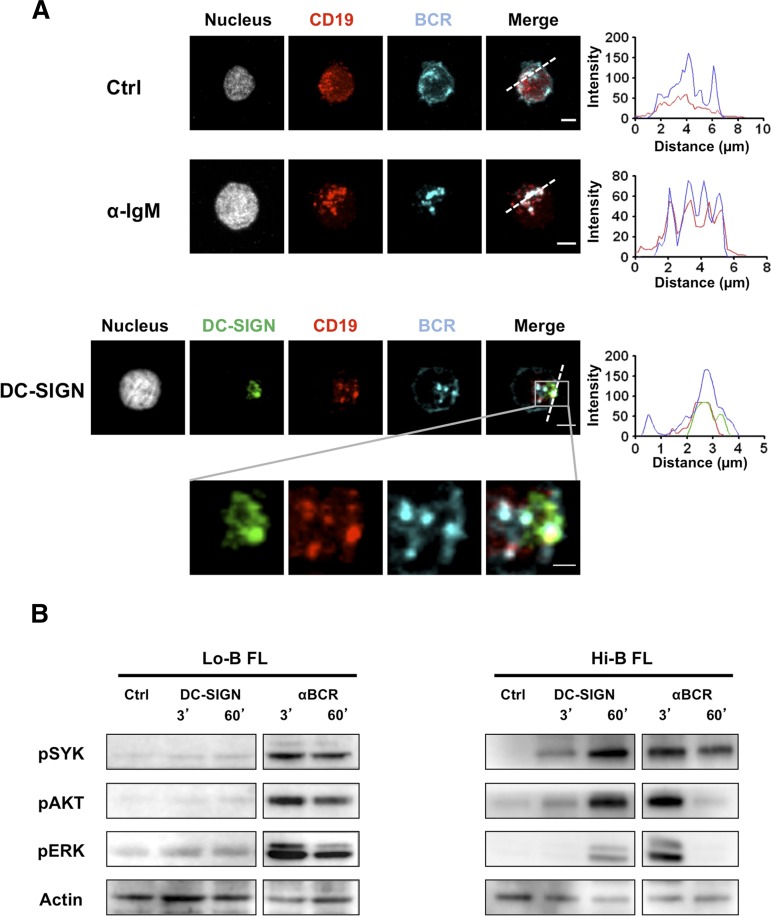
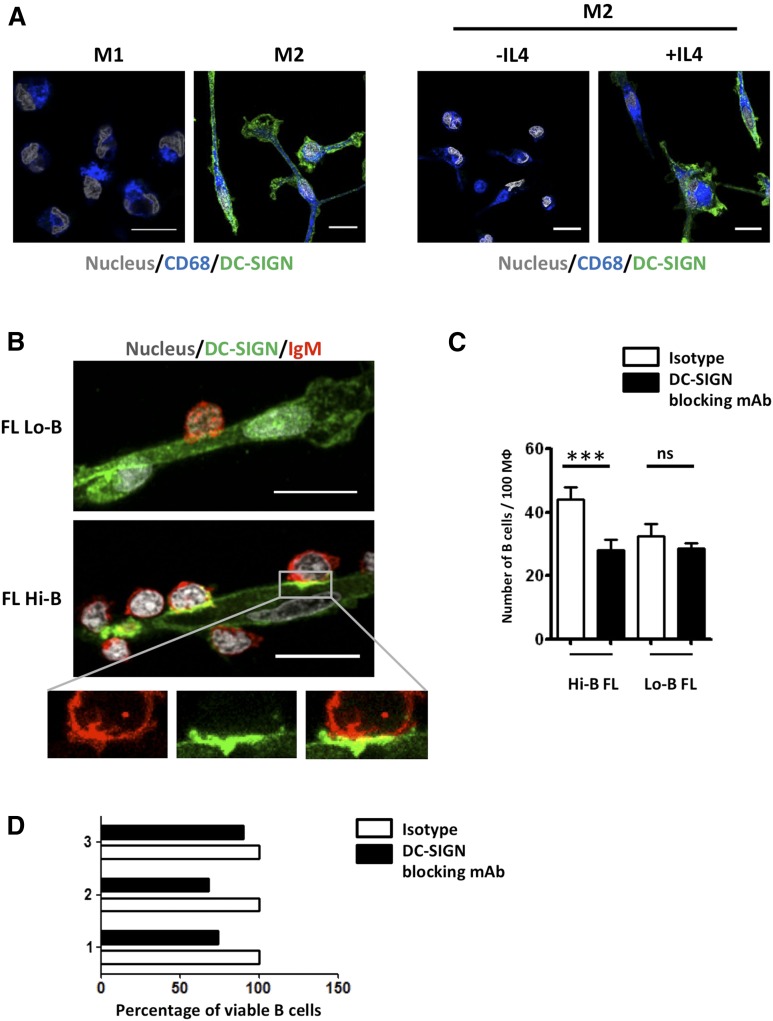
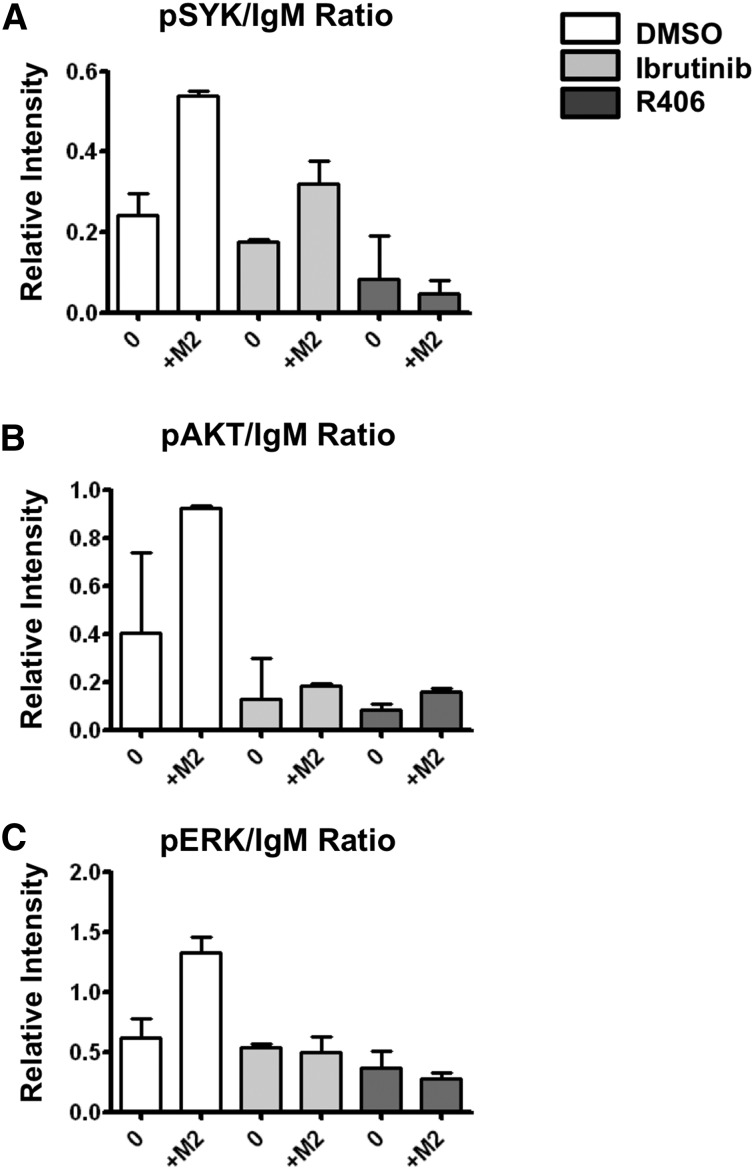
Follicular lymphoma (FL) results from the accumulation of malignant germinal center (GC) B cells leading to the development of an indolent and largely incurable disease. FL cells remain highly dependent on B-cell receptor (BCR) signaling and on a specific cell microenvironment, including T cells, macrophages, and stromal cells. Importantly, FL BCR is characterized by a selective pressure to retain surface immunoglobulin M (IgM) BCR despite an active class-switch recombination process, and by the introduction, in BCR variable regions, of N-glycosylation acceptor sites harboring unusual high-mannose oligosaccharides. However, the relevance of these 2 FL BCR features for lymphomagenesis remains unclear. In this study, we demonstrated that IgM(+) FL B cells activated a stronger BCR signaling network than IgG(+) FL B cells and normal GC B cells. BCR expression level and phosphatase activity could both contribute to such heterogeneity. Moreover, we underlined that a subset of IgM(+) FL samples, displaying highly mannosylated BCR, efficiently bound dendritic cell-specific intercellular adhesion molecule-3-grabbing nonintegrin (DC-SIGN), which could in turn trigger delayed but long-lasting BCR aggregation and activation. Interestingly, DC-SIGN was found within the FL cell niche in situ. Finally, M2 macrophages induced a DC-SIGN-dependent adhesion of highly mannosylated IgM(+) FL B cells and triggered BCR-associated kinase activation. Interestingly, pharmacologic BCR inhibitors abolished such crosstalk between macrophages and FL B cells. Altogether, our data support an important role for DC-SIGN-expressing infiltrating cells in the biology of FL and suggest that they could represent interesting therapeutic targets.


Figures

Figure 1
Figure 1
BCR activation in normal and malignant GC B cells. (A) B cells were purified from tonsils and FL samples and were stimulated with soluble goat anti-human IgM or IgG Abs for indicated time points. BCR activation was revealed using intracellular staining for pSYK, pBLNK, and pERK. GC B cells were gated based on CD38hi expression whereas IgM+ or IgG+ malignant FL B cells were further gated based on the expression of an appropriate tumor light chain (n = 5 for each subset). rMFI was obtained as the rMFI with/without BCR stimulation. Bars, mean ± SD. (B) GC B cells were sorted from purified tonsil B cells based on CD44IgD phenotype. Sorted GC B cells and purified FL B cells were stimulated for 10 minutes with coated mouse anti-human IgM or IgG mAbs before fixation, permeabilization, and staining with rabbit anti-pCD79a primary mAbs followed by A488-donkey anti-rabbit secondary Ab, and A549-goat anti-human IgM or A549-donkey anti-human IgG Abs. pCD79a MFI was obtained for 50 cells per sample (pool of 3 GC B-cell samples, 6 IgM FL samples, 6 IgG FL samples). Scale bar, 2.5 µm. **P < .01; ***P < .001; FL-G, IgG+ FL; FL-M, IgM+ FL; GC-G, IgM+ GC B cells; GC-M, IgM+ GC B cells; ns, not significant; Uns, unstimulated.
Figure 2
Figure 2
DC-SIGN binding by FL B cells. (A) Expression of MR and DC-SIGN on gated CD3/CD19/CD335CD11c+HLA-DR+CD14 dendritic cells (DCs) and CD3/CD19/CD335CD11c+HLA-DR+CD14+ macrophages (MΦ) in tonsils (n = 7) vs FL lymph nodes (FL LN) (n = 14). ***P < .001. (B) A488-conjugated rhDC-SIGN was used to stain normal tonsil B cell subsets (n = 6) and FL B cells (15 IgM+ and 8 IgG+ samples). CD38CD10IgM+ naive B cells (naive), CD38CD10IgM memory B cells (memory), CD38hiCD10+IgM+ GC B cells (GC-M), and CD38hiCD10+IgM GC B cells (GC-G) were compared. Within FL samples, tumoral B cells (T) and nontumoral B cells (NT) were segregated within CD20+ B cells through the expression of heavy and light chains. DC-SIGN binding was expressed as the rMFI obtained in the presence (green or blue line)/in the absence (black line) of Ca2+. IgM+ FL B cells with a DC-SIGN–binding capacity higher than IgG+ FL cells (Hi-B FL) were highlighted with orange diamonds; IgM+ FL B cells with a DC-SIGN–binding capacity similar to IgG+ FL cells (Lo-B FL) were highlighted with black diamonds. The black dotted line represents the maximum value of normal B cells; the orange dotted line, the maximum value of IgG+ FL B cells. *P < .05; ***P < .001. (C) Cell lysates from purified tonsil B cells and IgM+ FL B cells were immunoblotted with goat anti-human IgM Ab (top panel). When indicated, cell lysates were treated with EndoH or PNGase (bottom panel, shown is 1 representative experiment of 3).
Figure 3
Figure 3
Clustering of BCR and DC-SIGN in FL B cells. Sorted CD44IgD GC B cells and purified IgM+ FL B cells were incubated with unlabeled rhDC-SIGN before incubation on fibronectin-coated glass and fixation. DC-SIGN was revealed using mouse IgG2b anti-human DC-SIGN primary mAb and A488-donkey anti-mouse IgG2b secondary Ab whereas IgM+ cells were directly stained using A549-goat anti-IgM Ab. One example highlighting DC-SIGN/BCR colocalization is shown in panel A. Scale bar, 2.5 µM. The DC-SIGN:IgM rMFI was obtained for 100 cells per sample in 3 pooled GC B-cell samples, 6 IgM+ Lo-B FL samples (FL1, FL6-10), and 4 IgM+ Hi-B FL samples (FL3, FL5, FL11, FL12) (B). The Kruskal-Wallis nonparametric test followed by the Dunn posttest was used to compare FL samples with GC-M samples; ***P < .0001.
Figure 4
Figure 4
Induction of BCR signaling by DC-SIGN in FL B cells. (A) Purified Hi-B FL B cells were incubated with mouse IgG1 anti-human CD19 mAb alone (Ctrl) or before stimulation with mouse IgG3 anti-IgM mAb (αIgM) or rhDC-SIGN. After fixation, cells were stained with A594-goat anti-mouse IgG1 Ab, A647 goat anti-human IgM Ab, and, when appropriate, mouse IgG2b anti-DC-SIGN primary mAb and A488-donkey anti-mouse IgG2b secondary Ab. Shown is 1 experiment representative of 3. Scale bar, 2.5 µM. (B) Purified B cells from Lo-B FL and Hi-B FL samples were stimulated for the indicated time points with uncoated Dynabeads (Ctrl), mouse IgG3 anti-IgM mAb (BCR), or Dynabeads coated by rhDC-SIGN (DC-SIGN). Western blot revealed pSYK, pAKT, and pERK and were normalized using anti-β-actin. Shown is 1 experiment representative of 3.
Figure 5
Figure 5
M2 macrophages trigger DC-SIGN–dependent BCR activation in FL B cells. (A) Purified CD14+ monocytes were differentiated into M1 vs M2 macrophages before staining with SytoxBlue, mouse IgG1 anti-CD68 mAb, and mouse IgG2b anti-DC-SIGN mAb. When indicated, IL-4 was omitted from terminal M2 differentiation. (B) Purified Hi-B FL and Lo-B FL B cells were cultured with M2 macrophages for 1 hour before fixation, and staining of macrophages with mouse IgG2b anti-DC-SIGN followed by A488-donkey anti-mouse IgG2b, and B cells with A549-goat anti-human IgM. Nuclei were counterstained with SytoxBlue. (C) Quantification of adherent FL B cells per 100 macrophages in the presence of anti-DC-SIGN blocking mAb or mouse IgG2b isotype control (n = 6 for Hi-B FL and n = 3 for Lo-B FL). ***P < .001. Scale bar, 15 µM. (D) Purified Hi-B FL B cells were cocultured for 24 hours with M2 macrophages in the presence of anti-DC-SIGN blocking mAb or isotype control. The percentages of CD19+Topro-3 viable B cells were then evaluated and compared with that obtained in the presence of isotype control. Three different experiments were shown.
Figure 6
Figure 6
Btk and Syk inhibitors abrogate FL BCR activation induced by M2 macrophages. Purified Hi-B FL cells were pretreated with Ibrutinib, R406, or their solvent (DMSO) before coculture or not (0) with M2 macrophages (M2) for 1 hour. B cells were then collected and (A) pSYK, (B) pAKT, (C) pERK, and IgM expressions were studied by western blot. Bars represent mean ± SD from 2 experiments.

Comment in

References

    1. Amé-Thomas P, Tarte K. The yin and the yang of follicular lymphoma cell niches: role of microenvironment heterogeneity and plasticity. Semin Cancer Biol. 2014;24:23–32. - PubMed
    1. Scott DW, Gascoyne RD. The tumour microenvironment in B cell lymphomas. Nat Rev Cancer. 2014;14(8):517–534. - PubMed
    1. Zuckerman NS, McCann KJ, Ottensmeier CH, et al. Ig gene diversification and selection in follicular lymphoma, diffuse large B cell lymphoma and primary central nervous system lymphoma revealed by lineage tree and mutation analyses. Int Immunol. 2010;22(11):875–887. - PubMed
    1. Loeffler M, Kreuz M, Haake A, et al. HaematoSys-Project. Genomic and epigenomic co-evolution in follicular lymphomas. Leukemia. 2015;29(2):456–463. - PubMed
    1. Meeker T, Lowder J, Cleary ML, et al. Emergence of idiotype variants during treatment of B-cell lymphoma with anti-idiotype antibodies. N Engl J Med. 1985;312(26):1658–1665. - PubMed

Publication types