. 2015 Oct 2;290(40):24079-90.
doi: 10.1074/jbc.M115.648071. Epub 2015 Aug 13.

Catalysis of GTP hydrolysis by small GTPases at atomic detail by integration of X-ray crystallography, experimental, and theoretical IR spectroscopy

Affiliations

Catalysis of GTP hydrolysis by small GTPases at atomic detail by integration of X-ray crystallography, experimental, and theoretical IR spectroscopy

Till Rudack et al. J Biol Chem. .

Abstract

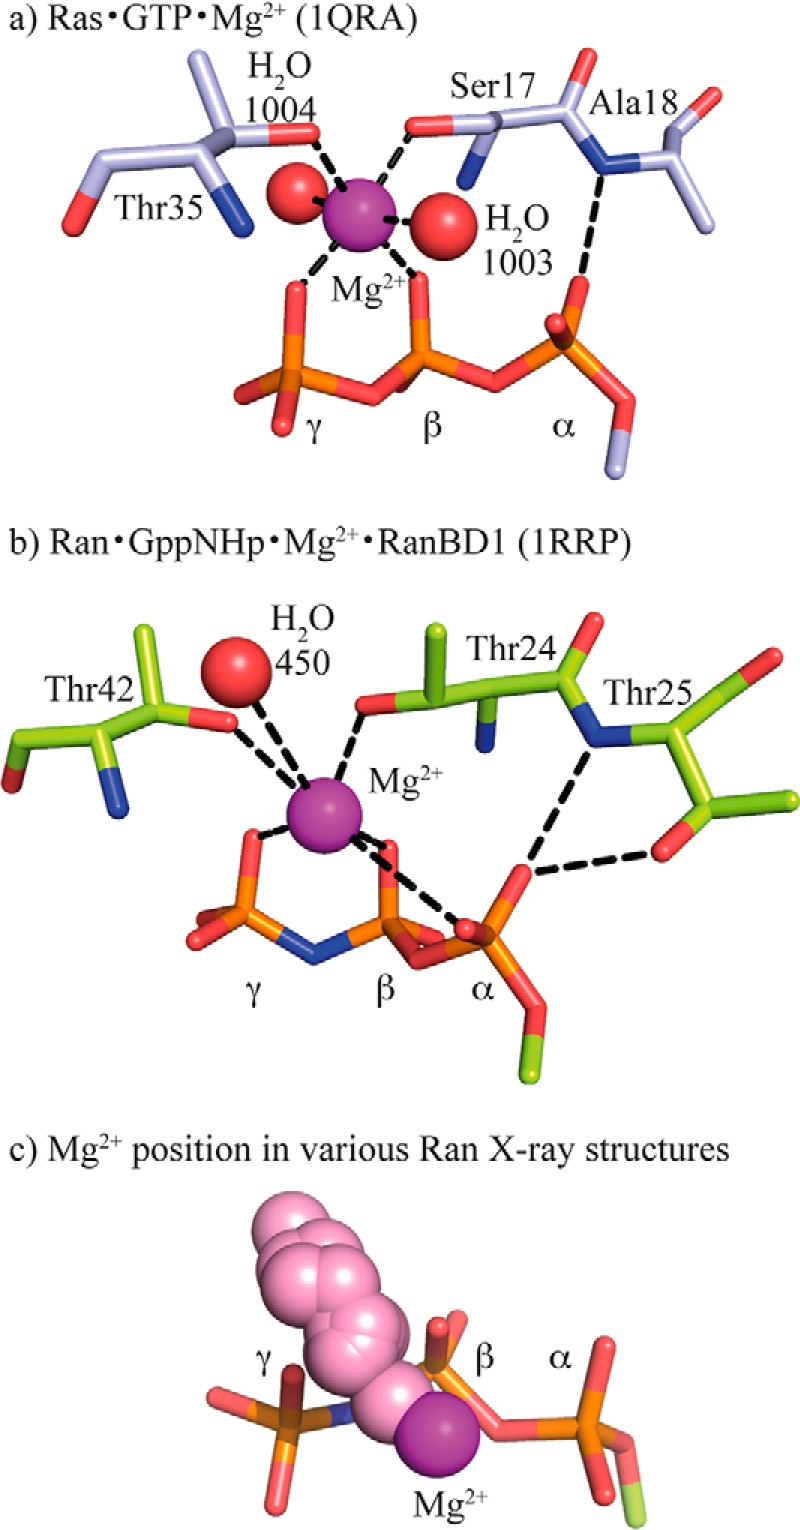
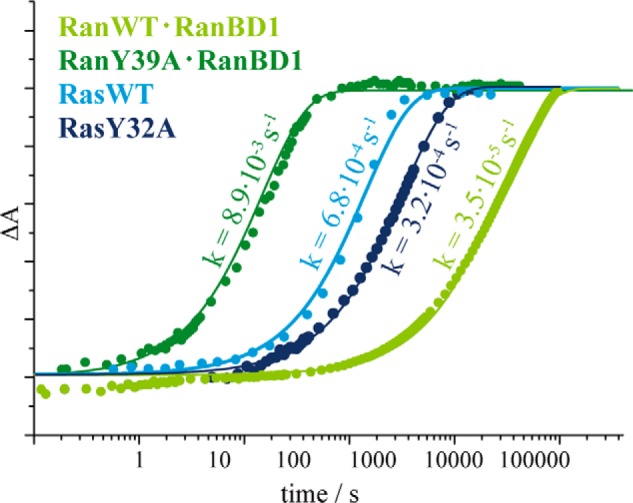
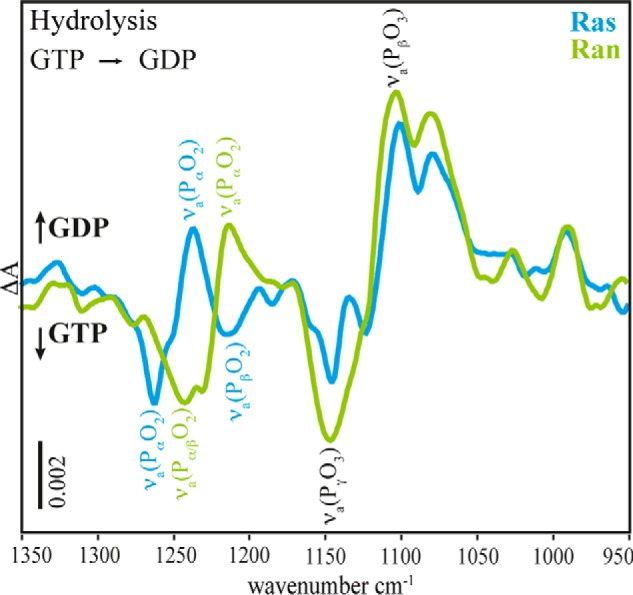
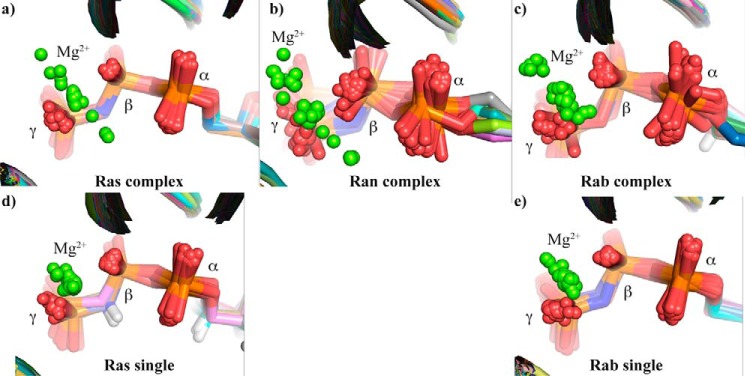
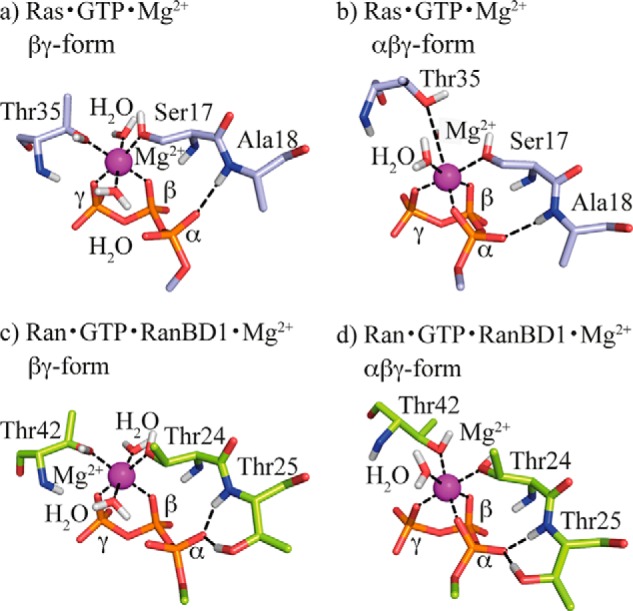
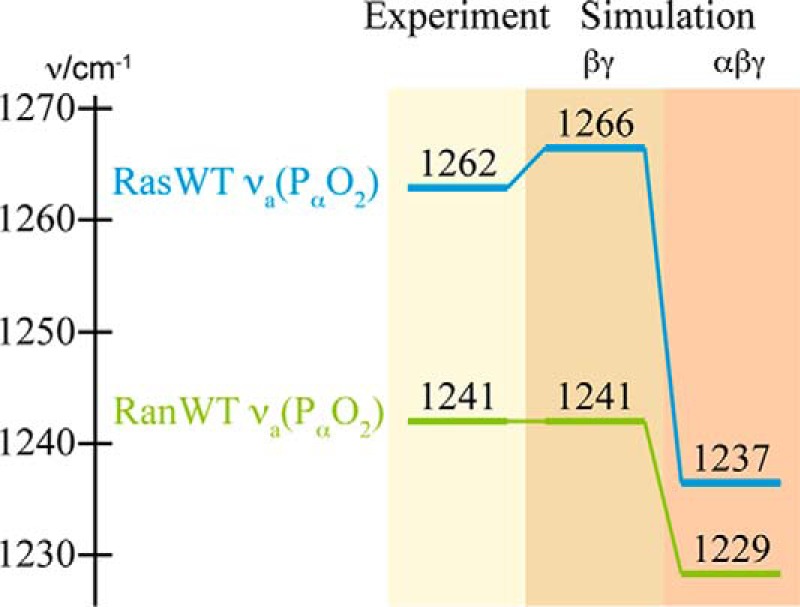
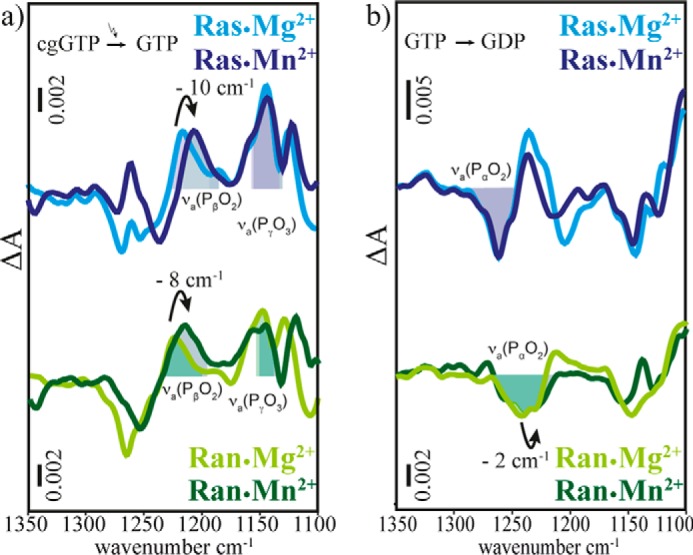
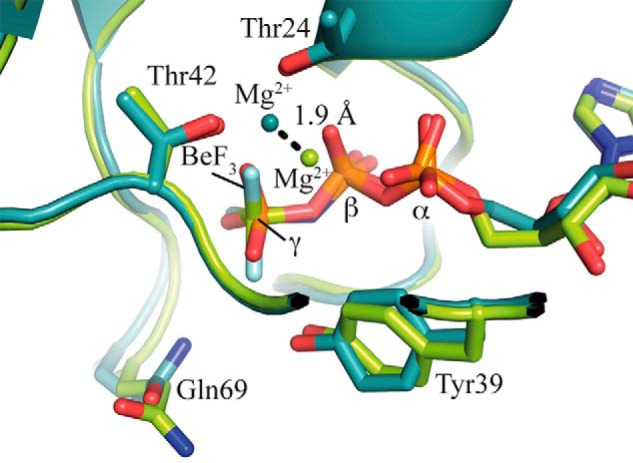
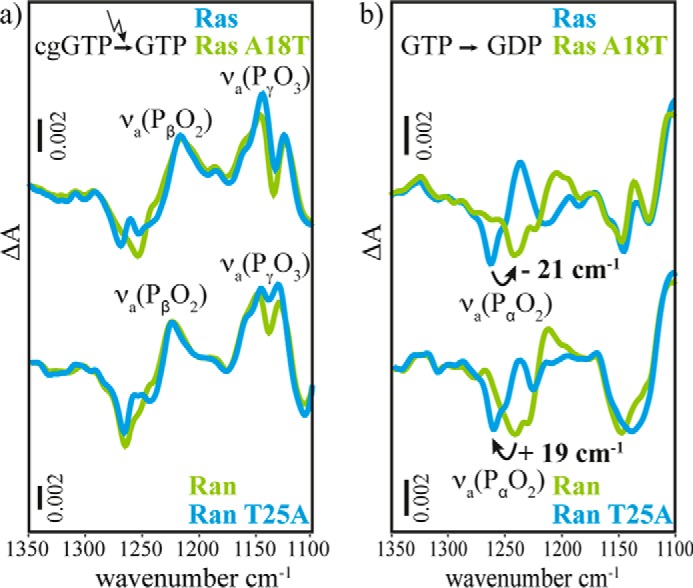
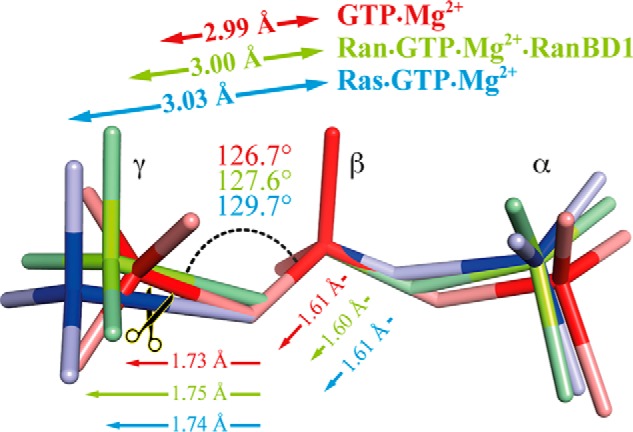
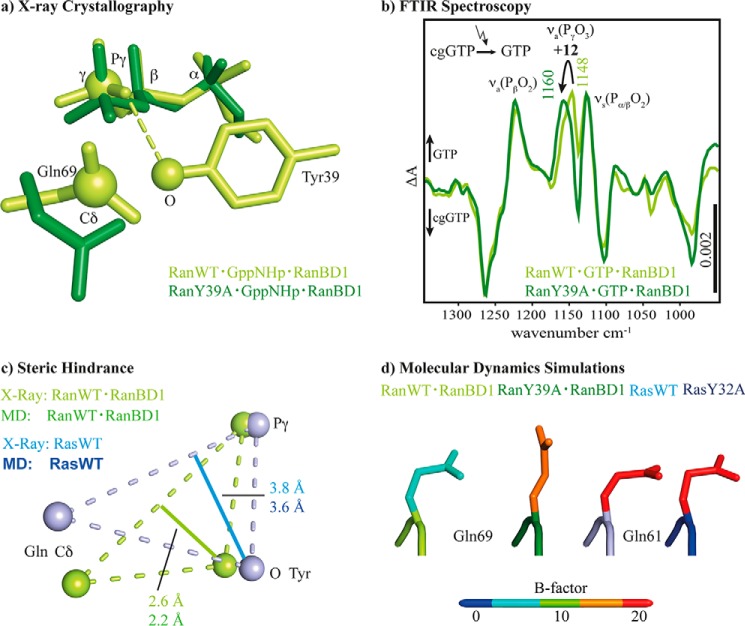
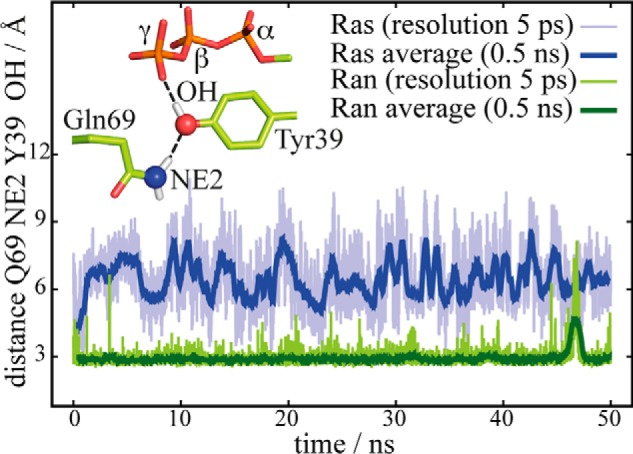
Small GTPases regulate key processes in cells. Malfunction of their GTPase reaction by mutations is involved in severe diseases. Here, we compare the GTPase reaction of the slower hydrolyzing GTPase Ran with Ras. By combination of time-resolved FTIR difference spectroscopy and QM/MM simulations we elucidate that the Mg(2+) coordination by the phosphate groups, which varies largely among the x-ray structures, is the same for Ran and Ras. A new x-ray structure of a Ran·RanBD1 complex with improved resolution confirmed this finding and revealed a general problem with the refinement of Mg(2+) in GTPases. The Mg(2+) coordination is not responsible for the much slower GTPase reaction of Ran. Instead, the location of the Tyr-39 side chain of Ran between the γ-phosphate and Gln-69 prevents the optimal positioning of the attacking water molecule by the Gln-69 relative to the γ-phosphate. This is confirmed in the RanY39A·RanBD1 crystal structure. The QM/MM simulations provide IR spectra of the catalytic center, which agree very nicely with the experimental ones. The combination of both methods can correlate spectra with structure at atomic detail. For example the FTIR difference spectra of RasA18T and RanT25A mutants show that spectral differences are mainly due to the hydrogen bond of Thr-25 to the α-phosphate in Ran. By integration of x-ray structure analysis, experimental, and theoretical IR spectroscopy the catalytic center of the x-ray structural models are further refined to sub-Å resolution, allowing an improved understanding of catalysis.

Keywords: Fourier transform IR (FTIR); QM/MM simulations; X-ray crystallography; computer modeling; crystal structure; infrared spectroscopy (IR spectroscopy); nuclear transport; reaction mechanism; small GTPase; spectroscopy.


Figures

FIGURE 1.
FIGURE 1.
Mg2+ positions in Ras and Ran x-ray structures. Comparison of the Mg2+ coordination in the x-ray structures of (a) Ras·GTP (PDB code 1QRA, light blue carbon atoms), (b) Ran·Gpp(NH)p·RanBD1 (PDB code 1RRP, light green carbon atoms), and (c) various available Ran x-ray structures with their nucleotides aligned to Gpp(NH)p of PDB code 1RRP (Ran·Gpp(NH)p·RanBD1, Mg2+ in magenta) and the Mg2+ ions shown as pink spheres. Both, the βγ- and αβγ-form are found. A similar distribution is found for Ras complexes (Fig. 4). The used x-ray structures in c can be found in supplemental Section S2.
FIGURE 2.
FIGURE 2.
Comparison of the kinetics of Ran·RanBD1, RanY39A·RanBD1, Ras, and RasY32A. The normalized absorbance differences of adjacent bands of the GTP and GDP state are shown as a measure for the progress of the hydrolysis. The fits to single exponential functions are shown as continuous lines.
FIGURE 3.
FIGURE 3.
Comparison of the FTIR difference spectra of the hydrolysis reaction ahyd of Ras (blue) and Ran·RanBD1 (green, scaled by factor 1.7). The main differences occur in the νa(PαO2)-vibrational modes, the remaining part of the phosphate region is very similar.
FIGURE 4.
FIGURE 4.
Mg2+ positions in small GTPases. Comparison of the Mg2+ coordination in the x-ray structures with bound GTP or GTP analogue of (a) H-Ras in complex with other proteins (averaged resolution over 14 structures: 2.4 ± 0.4 Å), (b) Ran in complex with other proteins (averaged resolution: 2.7 ± 0.5 Å), (c) Rab in complex with other proteins (averaged resolution over 21 structures: 2.3 ± 0.5 Å), (d) uncomplexed H-Ras (averaged resolution over 67 structures: 1.8 ± 0.4 Å), and (e) uncomplexed Rab (averaged resolution over 39 structures: 1.9 ± 0.4 Å). The used x-ray structures in this figure can be found in supplemental Section S3.
FIGURE 5.
FIGURE 5.
Structures from molecular dynamics simulations. Comparison of the averaged structures of the equilibrated last 25 ns of 50-ns molecular dynamics simulations of solvated Ras·GTP·Mg2+ (light blue carbon atoms) in the βγ-form (a) and αβγ-form (b) as well as Ran·GTP·Mg2+·RanBD1 (light green carbon atoms) in the βγ-form (c) and αβγ-form (d). In c the second water molecule HOHX does not exist in the x-ray structure of RanWT (PDB code 1RRP) and has been added referring to the Ras structure of the βγ-form. In all four 50-ns simulation trajectories of Ran and Ras the Mg2+ remained stably tridentately or bidentately coordinated by the triphosphate depending on the starting structure. Oxygen atoms are red, nitrogen atoms are blue, phosphate atoms are orange, hydrogen atoms are light gray, and the magnesium ion is purple.
FIGURE 6.
FIGURE 6.
Comparison of the asymmetrical α-phosphate stretching modes of GTP bound to Ras or Ran, respectively. The experimental values of the hydrolysis difference spectra of Ras and Ran are compared with the calculated ones with both βγ- and αβγ-coordination of the Mg2+. The corresponding IR difference spectra are shown in Fig. 7.
FIGURE 7.
FIGURE 7.
Scaled FTIR difference spectra of (a) photolysis aph and (b) hydrolysis ahyd of RasWT·GTP·Mg2+ (light blue), RasWT·GTP·Mn2+ (dark blue), RanWT·GTP·Mg2+·RanBD1 (light green), and RanWT·GTP·Mn2+·RanBD1 (dark green). The observed band shifts are summarized in Table 1.
FIGURE 8.
FIGURE 8.
Superimposition of Ran·Gpp(NH)p·RanBD1 (PDB code 1RRP, light green) and RanΔ191·GDP·BeF3·RanBD1 (this work, PDB code 5CLL, cyan). The side chains of Thr-24, Tyr-39, Thr-42, and Gln-69 and the nucleotides and BeF3 are shown as sticks, the magnesium atoms as spheres. The distance between the two magnesium positions is approximately 1.9 Å, and the light green magnesium ion of PDB code 1RRP occupies the position of a water molecule in RanΔ191·GDP·BeF3·RanBD1 (not shown for clarity).
FIGURE 9.
FIGURE 9.
FTIR difference spectra of photolysis aph (a) and hydrolysis ahyd (b) of RasWT·GTP·Mg2+, RasA18T·GTP·Mg2+, RanWT·GTP·Mg2+·RanBD1, and RanT25A·GTP·Mg2+·RanBD1. The intensities are scaled to the intensity of WT proteins by multiplication with factors between 1.3 and 3. The νa(PβO2) vibrational mode does not shift, as observed best in the photolysis spectrum aph. The νa(PαO2) vibrational mode is downshifted 21 cm−1 by the A18T mutation in Ras and upshifted 19 cm−1 by the T25A mutation in Ran, observed best in the hydrolysis spectrum ahyd. The spectrum of RasA18T is very similar to the one of RanWT·RanBD1 and the spectrum of RanT25A·RanBD1 is very similar to the one of RasWT. By these mutations the Ras spectra can be transduced into Ran-like spectra and vice versa. The main spectral difference between Ras and Ran·RanBD1 are due to the additional hydrogen bond of the hydroxyl group of Thr-25 in Ran. The spectra of the entire mid-infrared region are shown as supplemental Fig. S2 (Ras) and supplemental Fig. S3 (Ran).
FIGURE 10.
FIGURE 10.
Structural changes of the triphosphate in water, bound to Ran, and Ras. The educt states are destabilized by the elongation of the distance between the γ- and β-phosphorous atom. The educt state in Ran·RanBD1 is less destabilized than in Ras so the energy barrier for hydrolysis in Ran is higher than in Ras. The values are the average over six 2.5-ps QM/MM simulations. Changes are exaggerated for clarity. The triphosphate structures in water and Ras are obtained by Rudack et al. (12).
FIGURE 11.
FIGURE 11.
Summary of the main results from, x-ray crystallography, FTIR spectroscopy, and MD simulations. In a the comparison of the x-ray structures of RanWT·Gpp(NH)p·RanBD1 (PDB code 1RRP) (green) and RanY39A·Gpp(NH)p (this work, PDB code 5CIW, dark green) is depicted. In RanWT Tyr-39 is fixed between the γ-phosphate and Gln-69. b, FTIR difference spectra of photolysis aph of RanWT·GTP·Mg2+·RanBD1 (light green), and RanY39A·GTP·Mg2+·RanBD1 (dark green). The intensity of the WT measurement is scaled by the factor 1.3. The shift of 12 cm−1 of the γ-phosphate band reveals the hydrogen bond between Tyr-39 and γ-phosphate, which is absent in RanY39A. c, comparison of the key residues in Ras and Ran involved in the steric hindrance as obtained from x-ray structures and the MD simulations. In Ran the oxygen of the Tyr side chain is much closer to a line from the Gln Cδ atom to the phosphor atom of the γ-phosphate, leading to the hypothesis that the Tyr-39-OH hinders the Gln-69 side chain from assuming an optimum catalytic position close to the γ-phosphate. This could be one of the explanations why the hydrolysis rate of Ran is slower that the one of Ras. All distances and the list of averaged PDB structures used to calculate the shown atom positions are given in supplemental Fig. S4. In d the averaged structure of the catalytic glutamine of the last 25 of 50-ns MD simulations of RanWT·GTP·RanBD1, RanY39A·GTP·RanBD1, RasWT·GTP, and RasY32A·GTP are represented. The colors display the simulated B-factor averaged over the side chain and backbone atoms (supplemental Table S2). Note that the simulated B-factors are obtained from the fluctuation during the MD simulation and are not directly comparable with the crystallographic B-factors.
FIGURE 12.
FIGURE 12.
Fixation of Gln-69 in Ran. Depicted in green is the distance between the nitrogen atom of the Gln-69 and the oxygen atom of the Tyr-39 head group of Ran·RanBD1 compared with the distance between the nitrogen atom of the Gln-61 and the oxygen atom of the Tyr-32 head group of Ras. The side chain of Gln-69 of Ran is fixed in a hydrolytically unfavorable position by a stable hydrogen bond to the oxygen atom of the Tyr-39 head group, whereas the Gln-61 side chain in Ras is more flexible.

References

    1. Wittinghofer A., Vetter I. R. (2011) Structure-function relationships of the G domain, a canonical switch motif. Annu. Rev. Biochem. 80, 943–971 - PubMed
    1. Cherfils J., Zeghouf M. (2013) Regulation of Small GTPases by GEFs, GAPs, and GDIs. Physiol. Rev. 93, 269–309 - PubMed
    1. Ligeti E., Welti S., Scheffzek K. (2012) Inhibition and termination of physiological responses by GTPase activating proteins. Physiol. Rev. 92, 237–272 - PubMed
    1. Cox A. D., Der C. J. (2010) Ras history: the saga continues. Small GTPases 1, 2–27 - PMC - PubMed
    1. Stewart M. (2007) Molecular mechanism of the nuclear protein import cycle. Nat. Rev. Mol. Cell Biol. 8, 195–208 - PubMed

Publication types