. 2015 Sep 25;290(39):23656-69.
doi: 10.1074/jbc.M114.618801. Epub 2015 Aug 13.

Allosteric Activation of Bacterial Swi2/Snf2 (Switch/Sucrose Non-fermentable) Protein RapA by RNA Polymerase: BIOCHEMICAL AND STRUCTURAL STUDIES

Affiliations

Allosteric Activation of Bacterial Swi2/Snf2 (Switch/Sucrose Non-fermentable) Protein RapA by RNA Polymerase: BIOCHEMICAL AND STRUCTURAL STUDIES

Smita Kakar et al. J Biol Chem. .

Abstract

Members of the Swi2/Snf2 (switch/sucrose non-fermentable) family depend on their ATPase activity to mobilize nucleic acid-protein complexes for gene expression. In bacteria, RapA is an RNA polymerase (RNAP)-associated Swi2/Snf2 protein that mediates RNAP recycling during transcription. It is known that the ATPase activity of RapA is stimulated by its interaction with RNAP. It is not known, however, how the RapA-RNAP interaction activates the enzyme. Previously, we determined the crystal structure of RapA. The structure revealed the dynamic nature of its N-terminal domain (Ntd), which prompted us to elucidate the solution structure and activity of both the full-length protein and its Ntd-truncated mutant (RapAΔN). Here, we report the ATPase activity of RapA and RapAΔN in the absence or presence of RNAP and the solution structures of RapA and RapAΔN either ligand-free or in complex with RNAP. Determined by small-angle x-ray scattering, the solution structures reveal a new conformation of RapA, define the binding mode and binding site of RapA on RNAP, and show that the binding sites of RapA and σ(70) on the surface of RNAP largely overlap. We conclude that the ATPase activity of RapA is inhibited by its Ntd but stimulated by RNAP in an allosteric fashion and that the conformational changes of RapA and its interaction with RNAP are essential for RNAP recycling. These and previous findings outline the functional cycle of RapA, which increases our understanding of the mechanism and regulation of Swi2/Snf2 proteins in general and of RapA in particular. The new structural information also leads to a hypothetical model of RapA in complex with RNAP immobilized during transcription.

Keywords: ATPase; RNA polymerase; RNA polymerase recycling; RapA-RNA polymerase interaction; allosteric activation; bacterial Swi2/Snf2 protein RapA; bacterial transcription; small-angle x-ray scattering (SAXS); transcription factor.


Figures

FIGURE 1.
FIGURE 1.
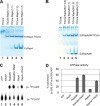
Formation of the RapA-Core complex and ATPase activity. A and B, binding of EcRapA and EcRapAΔN to TtCore by EMSA using 6% acrylamide gel. Lane 1 shows TtCore. Lanes 2–5 show EcRapA-TtCore or EcRapAΔN-TtCore complex with increasing amounts of EcRapA or EcRapAΔN as labeled. C, ATPase activity was measured for EcRapA, EcRapAΔN, and their complexes with their cognate EcCore by an in vitro ATPase assay (see “Experimental Procedures”). The scan shows the separation of ADP from ATP on a TLC poly(ethyleneimine)-cellulose plate. Lane 1 shows [α-32P]ATP, lanes 2–6 show results of incubation of [α-32P]ATP with RNAP (lane 2), EcRapAΔN (lane 3), EcRapAΔN-EcCore (lane 4), EcRapA (lane 5), and EcRapA-EcCore (lane 6). D, percent conversion of [α-32P]ATP to [α-32P]ADP quantified for the six samples of Fig. 1C. The graph shows data from three independent experiments.
FIGURE 2.
FIGURE 2.
Activation of TtRNAP recycling by EcRapA. The percentage of total radioactively labeled RNA is shown for time points from 5 min up to 8 h. The black arrow indicates the approximate time required for completion of a single-round transcription. The results for four samples from three experiments were normalized over the total radioactively labeled RNA of the control sample, TtHolo, at the 8-h time point, which was assumed a value of 50%. RNA degradation became apparent when the reactions were longer than 8 h.
FIGURE 3.
FIGURE 3.
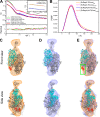
Structural analysis of EcRapA and EcRapAΔN by SAXS. A, top, Overlay of experimental scattering profiles with back-calculated scattering profiles for EcRapA and EcRapAΔN. The inset shows the Guinier analysis (30) for the experimental scattering curves of EcRapA and EcRapAΔN with qmax × Rg ≤ 1.3. Bottom, residual differences in the scattering curves between the back-calculated and experimental ones. B, overlay of the model (blue) with experimental (green) PDDFs for EcRapA and overlay of the model (cyan) with experimental (magenta) PDDFs for EcRapAΔN. The PDDFs were not normalized to their molecular masses. The PDDFs for the models were calculated using Xplor-NIH (22, 23); 100 models were calculated, out of which an ensemble of 20 with the lowest χ2 values was averaged to obtain the representative curve. C, shown in two views, the EcRapAΔN structure (in cyan, residues 108–962 from the crystal structure of RapA; PDB ID 3DMQ) was docked into the SAXS envelope (in magenta). D, the crystal structure of EcRapA (in cyan with Ntd highlighted in red; PDB ID 3DMQ) was docked into the SAXS envelope (in green). E, the best-fit rigid-body model of EcRapA (in cyan with Ntd highlighted in red; PDB ID 3DMQ) using Xplor-NIH was docked into the SAXS envelope (in green).
FIGURE 4.
FIGURE 4.
Flexibility analysis of EcRapA and EcRapAΔN by SAXS. A, the dimensionless Kratky plots for EcRapA and EcRapAΔN. B, the Porod-Debye plots (31) for EcRapA and EcRapAΔN. C, overlay of experimental scattering profile with that back-calculated for optimized ensemble with two conformers for EcRapA. The inset is the plot of fitting χ against the ensemble size. D, distribution of the optimized ensemble with two conformers and the initial pool of 10000 random conformers (gray area) as a function of Rg.
FIGURE 5.
FIGURE 5.
Structural analysis of TtHolo by SAXS. A, top, overlay of experimental scattering profile with back-calculated scattering profile (PDB ID 4G7H) for TtHolo. The inset shows the Guinier analysis for the experimental scattering curves of TtHolo with qmax × Rg ≤ 1.3. Bottom, residual differences in the experimental and back-calculated scattering curves. B, overlay of the PDDFs for the TtHolo model (cyan) with the experimental data (green). The PDDF for the model was calculated using Xplor-NIH (22, 23); 100 models were calculated, out of which an ensemble of twenty with lowest the χ2 values was averaged to obtain the representative curve. C, fitting the crystal structure of TtHolo with incomplete β′ subunit (PDB ID 1IW7) into the SAXS envelope of TtHolo. The head of the bowling-pin-shaped envelope (boxed) was attributed to the missing portion of the β′ subunit. D, the crystal structure of TtTIC (in blue with σ70 highlighted in red; PDB ID 4G7H) is superimposed with the SAXS envelope (green mesh).
FIGURE 6.
FIGURE 6.
Structural analysis of EcRapA-TtCore and EcRapAΔN-TtCore by SAXS. A, top, overlay of experimental scattering profiles with that back-calculated for the rigid-body models from CORAL and SASREFMX for EcRapA-TtCore and EcRapAΔN-TtCore. The starting models for rigid-body modeling using CORAL are the same as that using SASREFMX. The inset shows Guinier analysis (30) for the experimental scattering curves of EcRapA-TtCore and EcRapAΔN-TtCore with qmax × Rg ≤ 1.3. Bottom, residual differences in the scattering curves between the rigid-body models and experimental ones. B, overlay of the model (magenta) and experimental (orange) PDDFs for EcRapA-TtCore; also shown is the overlay of model (red) and experimental (blue) PDDFs for EcRapAΔN-TtCore. The PDDFs for the models were calculated using Xplor-NIH (22, 23); 100 models were calculated, out of which an ensemble of 20 with the lowest χ2 values was averaged to obtain the representative curve. C, the rigid-body docking model for the EcRapA-TtCore complex (EcRapA, in cyan with Ntd highlighted in red; this work; TtCore, in gray, PDB ID 4G7H) is superimposed with the SAXS envelope (orange mesh). D, the rigid-body docking model for the EcRapAΔN-TtCore complex (EcRapAΔN, in cyan; this work; TtCore, in gray, PDB ID 4G7H) is superimposed with the SAXS envelope (in light blue). E, superimposition of the envelopes of EcRapA-TtCore and EcRapAΔN-TtCore. The major difference highlighted with a box indicates the location of Ntd in the EcRapA-TtCore complex (shown as a schematic in gray for TtCore (PDB ID 4G7H)) and in cyan for EcRapA with Ntd in red; this work). Panels C and D show the common binding area of σ70 and RapA on the Core, whereas D and E define the binding site of Ntd.
FIGURE 7.
FIGURE 7.
The largely overlapped binding sites of RapA and σ70 on the Core enzyme of RNAP. A, superposition of the SAXS structure of EcRapA-TtCore (this work) with the crystal structure of TtTIC (PDB ID 4G7H). The EcRapA (in cyan with Ntd highlighted in red) and Ttσ70 (in yellow) are shown as ribbon diagrams (α-helices as cylinders, β-strands as arrows, and loops as tubes). The TtCore is shown as a molecular surface in white. B, the observed EcRapA-TtCore interface. Note that the view is different from that in panel A, optimized to expose the main contacting area of the interface. On the left, charge potential distribution (positive in blue, negative in red) of the EcRapA surface that contacts the TtCore. On the right, charge potential distribution of the TtCore surface that contacts the EcRapA. Ellipses indicate major contacting areas of the RapA-Core interface. C, surface view of TtCore showing the β′ and β subunits in yellow and cyan, respectively. The view is the same as that in panel B. The rest of the molecule is shown in light gray. D, cross-linking experiment; DSS was added to EcRapA, EcRapAΔN, TtCore, EcRapA-TtCore, and EcRapAΔN-TtCore to a final concentration of 0.025 (a), 0.05 (b), 0.1 (c), and 0.25 mm (d). The reaction mixtures were separated on a 4–12% Bis-Tris SDS-gel using MOPS SDS running buffer. The cross-linked product bands that were analyzed by in-gel digestion and mass spectrometry are indicated with numbers 1, 2, 1′, and 2′. The mobility of β′, β, EcRapA, EcRapAΔN, α, and cross-linked products is indicated with arrows on the right. The gels were run for 80 min to achieve better separation of the higher molecular weight cross-linked products. The ω subunit (∼10 kDa) ran out of the gel under these conditions. Ref1 is EcRapA-TtCore, and Ref 2 is EcRapAΔN-TtCore in the absence of DSS.
FIGURE 8.
FIGURE 8.
The functional cycle of RapA. A, the closed form of EcRapA (PDB ID 3DMQ) shows that the Ntd is packed against the ATPase module of RapA. B, the open form of EcRapA by SAXS shows that the Ntd is disengaged from the ATPase module. C, the SAXS structure of EcRapA-TtCore shows that the open form of EcRapA is consistent with its binding mode to the TtCore. Proteins are shown as transparent molecular surfaces except that Linker1 is shown as a ribbon diagram and colored in white except that the Ntd, 1A, 2A, 2B, and Linker1 of EcRapA are colored in red, cyan, yellow, orange, and black, respectively. D, crystal structure of TtHolo from the transcription initiation complex (TtTIC; PDB ID 4G7H) is illustrated as a molecular surface in white with σ70 highlighted in red. The promoter DNA is omitted from the structure. It also represents the SAXS solution structure of σ70-TtCore (TtHolo, Fig. 5D).
FIGURE 9.
FIGURE 9.
Hypothetical model of the RapA-PTC complex. The model is composed by using the SAXS structure of EcRapA-TtCore (this work, Fig. 8C), the dsDNA from the model of RapA-dsDNA (7), the non-coding DNA strand from the crystal structure of T. thermophilus transcription initiation complex (TtTIC, PDB ID 4G7H, Fig. 8D), and the coding DNA strand from the crystal structure of TtTEC (PDB ID 2PPB). Proteins are illustrated and colored as in Fig. 8. The nucleic acids are represented by tube-and-sticks, showing their polarity and colored in red for the coding or green for non-coding DNA strand. The dashed line represents a portion of the DNA coding strand for which structural information is not available.

References

    1. Hopfner K. P., Gerhold C. B., Lakomek K., Wollmann P. (2012) Swi2/Snf2 remodelers: hybrid views on hybrid molecular machines. Curr. Opin. Struct. Biol. 22, 225–233 - PMC - PubMed
    1. Jin D. J., Zhou Y. N., Shaw G., Ji X. (2011) Structure and function of RapA: a bacterial Swi2/Snf2 protein required for RNA polymerase recycling in transcription. Biochim. Biophys. Acta 1809, 470–475 - PMC - PubMed
    1. Muzzin O., Campbell E. A., Xia L., Severinova E., Darst S. A., Severinov K. (1998) Disruption of Escherichia coli hepA, an RNA polymerase-associated protein, causes UV sensitivity. J. Biol. Chem. 273, 15157–15161 - PubMed
    1. Sukhodolets M. V., Jin D. J. (1998) RapA, a novel RNA polymerase-associated protein, is a bacterial homolog of SWI2/SNF2. J. Biol. Chem. 273, 7018–7023 - PubMed
    1. Sukhodolets M. V., Jin D. J. (2000) Interaction between RNA polymerase and RapA, a bacterial homolog of the SWI/SNF protein family. J. Biol. Chem. 275, 22090–22097 - PubMed

Publication types

MeSH terms

Substances

LinkOut - more resources