. 2015 Aug 14:6:8026.
doi: 10.1038/ncomms9026.

Mechanical forces regulate the interactions of fibronectin and collagen I in extracellular matrix

Affiliations

Mechanical forces regulate the interactions of fibronectin and collagen I in extracellular matrix

Kristopher E Kubow et al. Nat Commun. .

Abstract

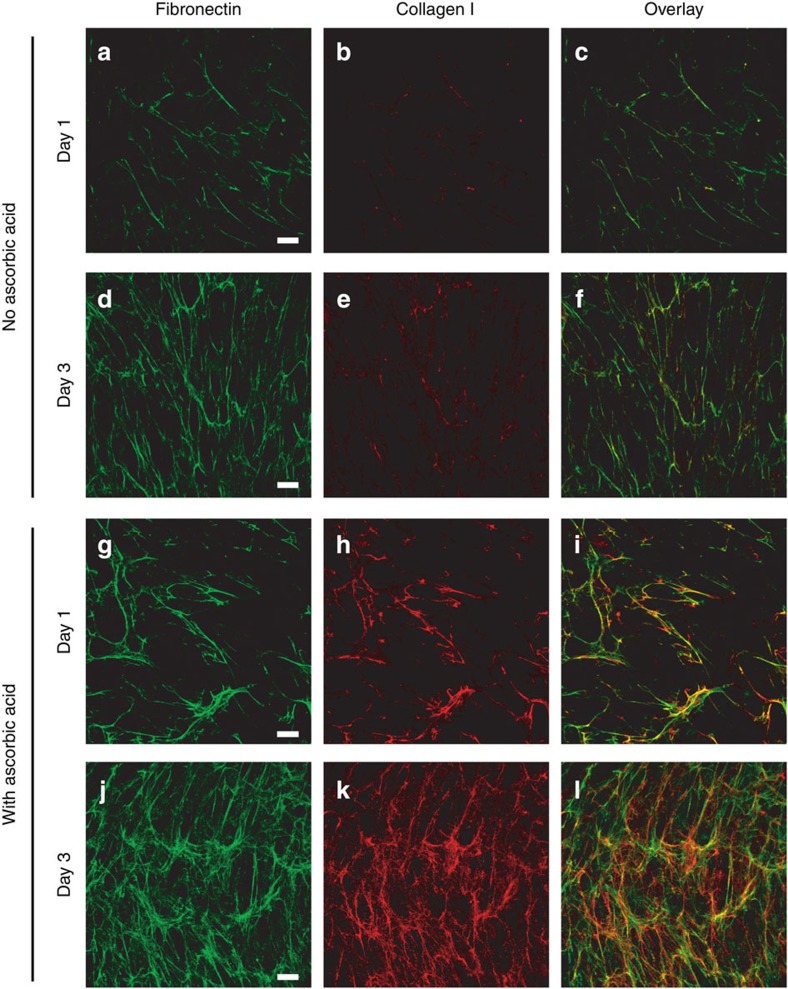
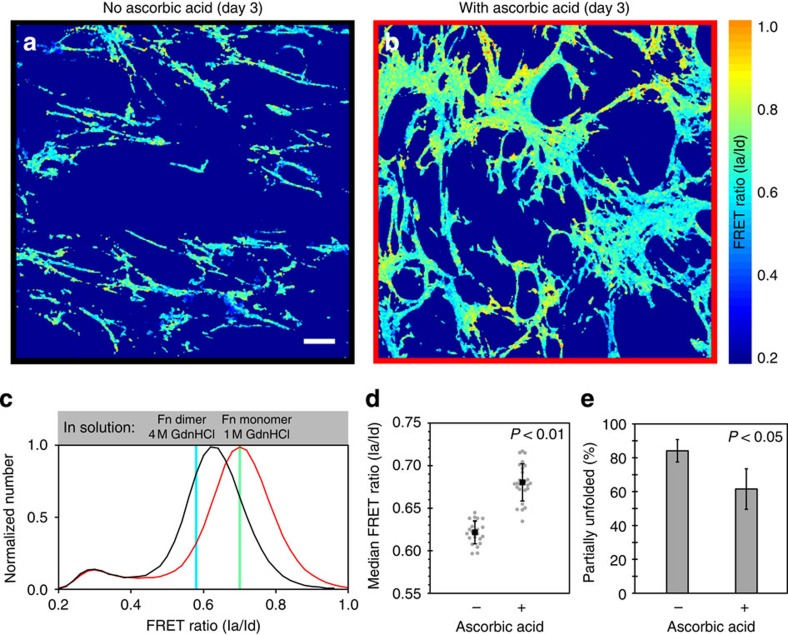
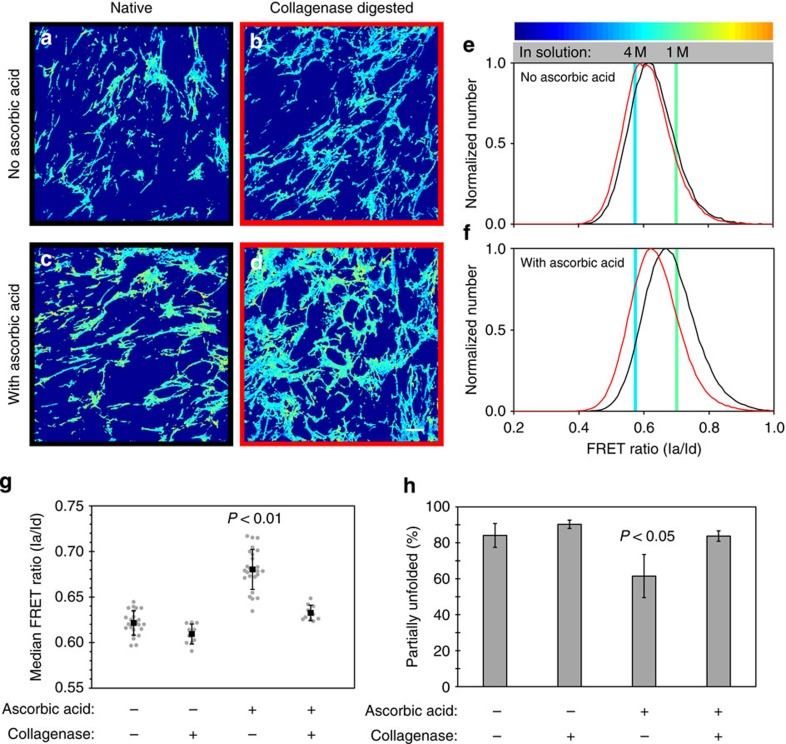
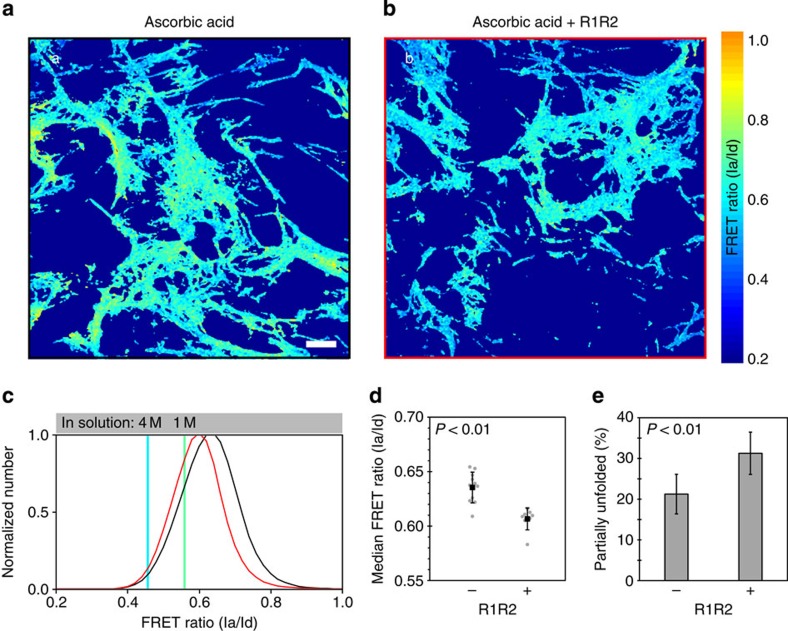
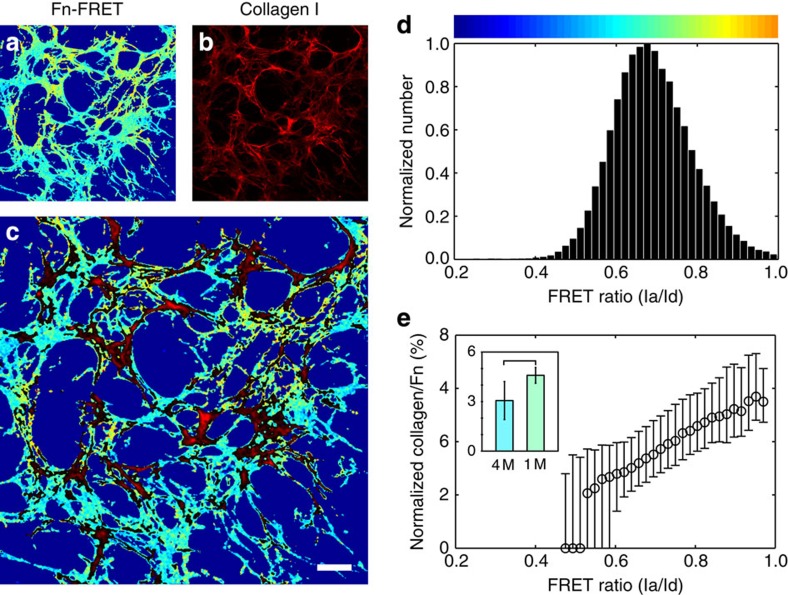
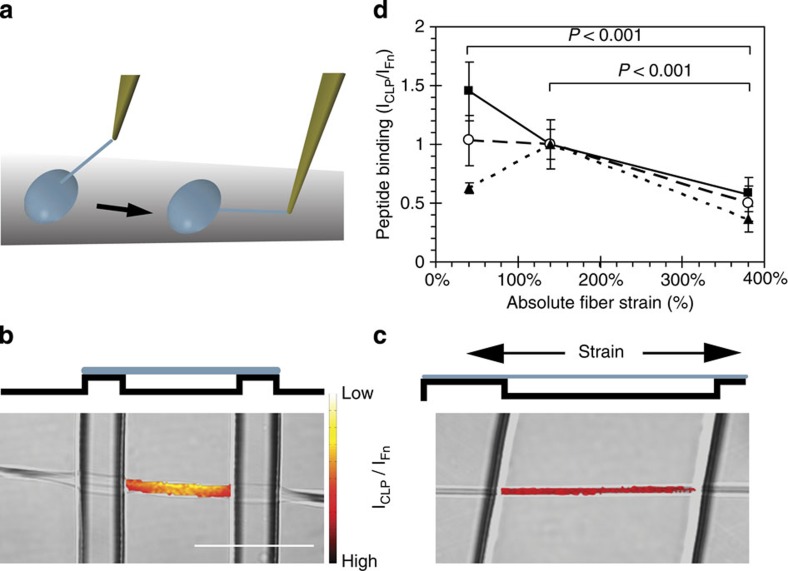
Despite the crucial role of extracellular matrix (ECM) in directing cell fate in healthy and diseased tissues--particularly in development, wound healing, tissue regeneration and cancer--the mechanisms that direct the assembly and regulate hierarchical architectures of ECM are poorly understood. Collagen I matrix assembly in vivo requires active fibronectin (Fn) fibrillogenesis by cells. Here we exploit Fn-FRET probes as mechanical strain sensors and demonstrate that collagen I fibres preferentially co-localize with more-relaxed Fn fibrils in the ECM of fibroblasts in cell culture. Fibre stretch-assay studies reveal that collagen I's Fn-binding domain is responsible for the mechano-regulated interaction. Furthermore, we show that Fn-collagen interactions are reciprocal: relaxed Fn fibrils act as multivalent templates for collagen assembly, but once assembled, collagen fibres shield Fn fibres from being stretched by cellular traction forces. Thus, in addition to the well-recognized, force-regulated, cell-matrix interactions, forces also tune the interactions between different structural ECM components.


Figures

Figure 1
Figure 1. Fn's major cell and ECM-protein binding sites.
Diagram of a monomer of plasma Fn showing selected binding and interaction sites (adapted from45). Fn exists as a dimer of two nearly identical monomers, linked at the C-terminus by disulfide bonds. The yellow circles show the 6 nm Forster energy transfer radius for the acceptor dyes that are located on modules FnIII7 and FnIII15 in FRET-labelled Fn. While the FRET radii are drawn roughly to scale to indicate which modules are covered, other aspects of the diagram are not necessarily to scale. The canonical collagen/gelatin-binding domain, the R1R2 bacterial-adhesin-derived peptide, and the two binding sites for a CLP encompassing the Fn-binding domain of the collagen I α1 chain are shown in bold.
Figure 2
Figure 2. Cells receiving supplemental ascorbic acid upregulate collagen matrix assembly.
NIH 3T3 fibroblasts were seeded on Fn-coated glass with medium containing fluorescently labelled Fn (Alexa 488) in the absence (af) or presence (gl) of 50 μg ml−1 ascorbic acid, and were cultured for 1 or 3 days, then fixed and immunostained for collagen type I. Collagen matrix production was greatly reduced in the absence of supplemental ascorbic acid. Images are z-projections of representative confocal z-stacks selected from five independent experiments. The third column of images shows the Fn (green) and collagen (red) images overlaid. Bar=20 μm.
Figure 3
Figure 3. Ascorbic-acid-treated cell cultures produce less-strained Fn matrix fibres.
NIH 3T3 fibroblasts were allowed to incorporate small amounts of Fn-FRET into their matrices for 3 days in the absence (a) or presence (b) of 50 μg ml−1 ascorbic acid. (ab) Single z-slice images from the specified sample, colour-coded to reflect the calculated FRET ratios (see colour bar on right). (c) Representative normalized histograms of the FRET ratio distributions compiled from eight measurements for each treatment from a single experiment (black, no ascorbic acid; red, with ascorbic acid). The Fn-FRET denaturation points for the Fn monomer in 1 M GdnHCl and for the Fn dimer in 4 M GdnHCl points (see Supplementary Table 1) are indicated with coloured, vertical lines. Fn fibres with FRET ratios less than at the 1 M GnHCl calibration point (for Fn in solution) indicate partial secondary/tertiary structure loss due to unfolding. (d) Median FRET ratios from four independent experiments. Grey points represent individual measurements (23 for samples without and 25 for samples with ascorbic acid); black squares represent means (error bars, s.d.). (e) The same data as in panel (d) plotted as the mean (±s.d.) per cent unfolding of each group. Per cent partial Fn unfolding is the percentage of pixels with FRET ratios less than that seen at the 1 M denaturation curve point. Samples with and without ascorbic acid had significantly different median FRET ratios (P<0.01) and mean per cent unfolding values (P<0.05) (ANOVA, followed by a Tukey–Kramer post-hoc test were used because these data were analysed with additional groups shown in Fig. 4). Bar=20 μm.
Figure 4
Figure 4. Selective digestion of collagen I fibres with collagenase increases Fn matrix strain in ECM produced by fibroblasts.
Live, Fn-FRET-labelled, 3-day samples that were cultured in the absence (a,b,e) or presence (c,d,f) of 50 μg ml−1 ascorbic acid were digested with collagenase for 3 h (b,d) or kept undigested (‘native', a,c). (ad) Single z-slices from the indicated matrix that have been colour-coded to visualize the different FRET ratios (see colour bar). (ef) Representative FRET ratio distributions of native (black) and digested (red) ECMs assembled by fibroblasts in the presence or absence of ascorbic acid in the medium, compiled from two independent experiments (data displayed as in Fig. 3). Note that native and collagenase-digested data were taken from separate samples. (g) Median FRET ratios compiled from multiple experiments (native samples, four experiments; digested samples, two experiments). Grey points represent individual measurements (from left to right, n=23, 10, 25 and 10); black squares represent means (error bars, s.d.). (h) The same data as in panel (g) plotted as the mean (±s.d.) per cent unfolding of each group. Samples supplemented with ascorbic acid, but not digested with collagenase had significantly different median FRET ratios (P<0.01) and mean partial unfolding percentages (P<0.05) than the other groups (ANOVA, Tukey–Kramer post hoc). Scale bar=20 μm.
Figure 5
Figure 5. Inhibition of Fn-collagen I interactions with the R1R2 peptide increases Fn matrix fibre strain.
Live, Fn-FRET-labelled, 3-day samples were cultured in the presence of 50 μg ml−1 ascorbic acid and with (b) or without (a) the inhibitory R1R2 peptide. (ab) Single z-slices from the indicated matrix that have been colour-coded to indicate the FRET ratios (see colour bar). (c) Representative normalized histograms of the FRET ratio distributions compiled from three z-stacks for each treatment from a single experiment (black, control; red, with R1R2). (d) Median FRET ratios compiled from three independent experiments. Grey points represent individual measurements (11 for group without and 8 for group with R1R2); black squares represent means (error bars, s.d.). (e) The same data as in panel (d) plotted as the mean (±s.d.) per cent unfolding of each group. Samples with and without R1R2 had significantly different median FRET ratios (P<0.01) and mean partial unfolding percentages (P<0.01; Student's t-test). R1R2 had no effect on FRET in the absence of collagen fibres in the ECM (see Supplementary Fig. 2). Scale bar=20 μm.
Figure 6
Figure 6. Collagen fibres in ECM preferentially co-localize with relaxed Fn fibres.
Fibroblasts were cultured for 3 days with trace amounts of Fn-FRET and 50 μg ml−1 ascorbic acid in the medium. (ac) Single z-slice images of the Fn-FRET (a; colour-coded as in Fig. 3), collagen I immunostaining (b, red) and overlay (c) are shown for a representative field-of-view. For clarity, the overlay image only shows collagen pixels (red) brighter than the median intensity. (d) Histogram of the FRET ratios from (a), presented as in Fig. 3. (e) Co-localization of collagen and Fn as a function of the FRET ratios. The ratio of collagen intensity to Fn-FRET ratio of each co-localized pixel in (c) was plotted as a function of the pixel's respective FRET ratio; the entire plot was normalized to the area under the curve and expressed as a per cent. Data points are medians and error bars are the 25th and 75th percentiles; data are only reported for bins containing more than 50 pixels. The inset shows mean (±s.d.) collagen/Fn values for FRET ratios at the 1 M and 4 M denaturation curve points, taken from 23 measurements across four experiments. The two groups are significantly different (P<0.01, Student's t-test). Bar=20 μm.
Figure 7
Figure 7. The Fn-binding synthetic collagen peptide (CLP) binds preferentially to relaxed Fn fibres in single Fn fibre stretch assays.
(a) Cartoon showing the fabrication of manually deposited fibres (adapted from ref. 19). A peptide tip is immersed slowly in a concentrated solution of Fn, removed to initiate Fn fibrillogenesis, and the resulting Fn fibres are then deposited over micro-fabricated PDMS trenches. The elastic PDMS substrate is stretched or relaxed using a uniaxial mechanical straining device (52). Fn fibres labelled with Fn-Alexa647 and under different strains were incubated with an Alexa488-labelled CLP (corresponds to the Fn-binding region of collagen I). (b,c) The intensity of the CLP bound to the fibre was normalized by dividing by the Fn-Alexa647 intensity (see Materials and Methods section). The images show a side-view schematic of relaxed (b) and stretched (c) fibres freely suspended over the PDMS trenches. A top–down view (differential interference contrast) of a fibre crossing a trench, is overlaid with the CLP signal, colour-coded by the CLP/Fn intensity ratio. Note that only the CLP signal in the area suspended over the trench was analysed although CLP bound to the entire fibre. (d) The average intensity ratio (±s.d.) of CLP to Fn intensity, normalized to the mean value at the 140% strain point, is plotted versus absolute strain. Each line represents an independent experiment and each point represents measurements from at least six fibres. All 380% strain points are significantly different (P<0.001) than the 40 and 140% strain points from the same experiment (ANOVA, Tukey–Kramer post hoc). Bar=50 μm.

References

    1. Rozario T. & DeSimone D. W. The extracellular matrix in development and morphogenesis: a dynamic view. Dev. Biol. 341, 126–140 (2010). - PMC - PubMed
    1. Cukierman E. & Bassi D. E. Physico-mechanical aspects of extracellular matrix influences on tumorigenic behaviors. Semin. Cancer Biol. 20, 139–145 (2010). - PMC - PubMed
    1. Egeblad M., Rasch M. G. & Weaver V. M. Dynamic interplay between the collagen scaffold and tumor evolution. Curr. Opin. Cell Biol. 22, 697–706 (2010). - PMC - PubMed
    1. Schedin P. & Keely P. J. Mammary gland ECM remodeling, stiffness, and mechanosignaling in normal development and tumor progression. Cold Spring Harb. Perspect Biol. 3, a003228 (2011). - PMC - PubMed
    1. Miles F. L. & Sikes R. A. Insidious changes in stromal matrix fuel cancer progression. Mol. Cancer Res. 12, 297–312 (2014). - PMC - PubMed

Publication types