. 2015 Aug 28;349(6251):993-7.
doi: 10.1126/science.aaa9420. Epub 2015 Aug 13.

MUCOSAL IMMUNOLOGY. Individual intestinal symbionts induce a distinct population of RORγ⁺ regulatory T cells

Affiliations

MUCOSAL IMMUNOLOGY. Individual intestinal symbionts induce a distinct population of RORγ⁺ regulatory T cells

Esen Sefik et al. Science. .

Abstract

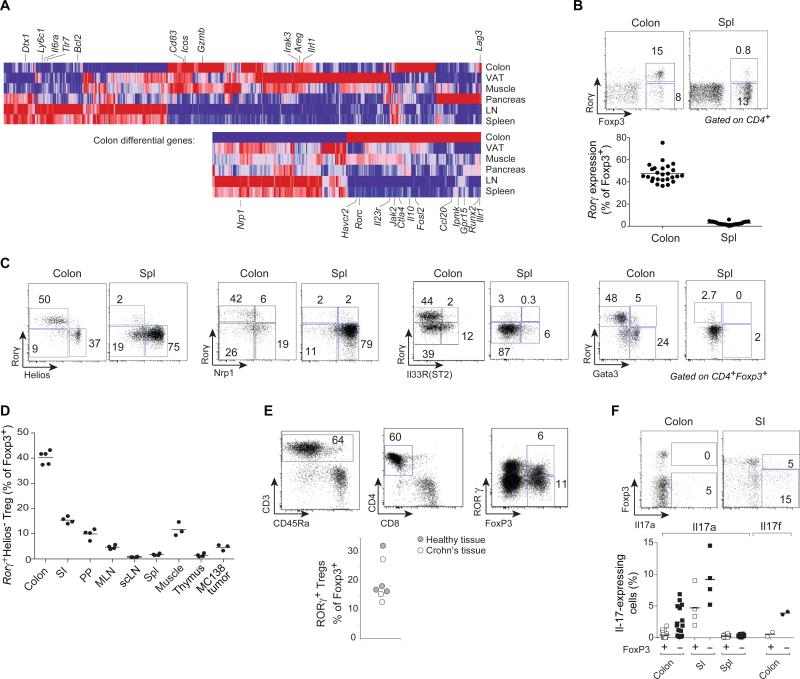
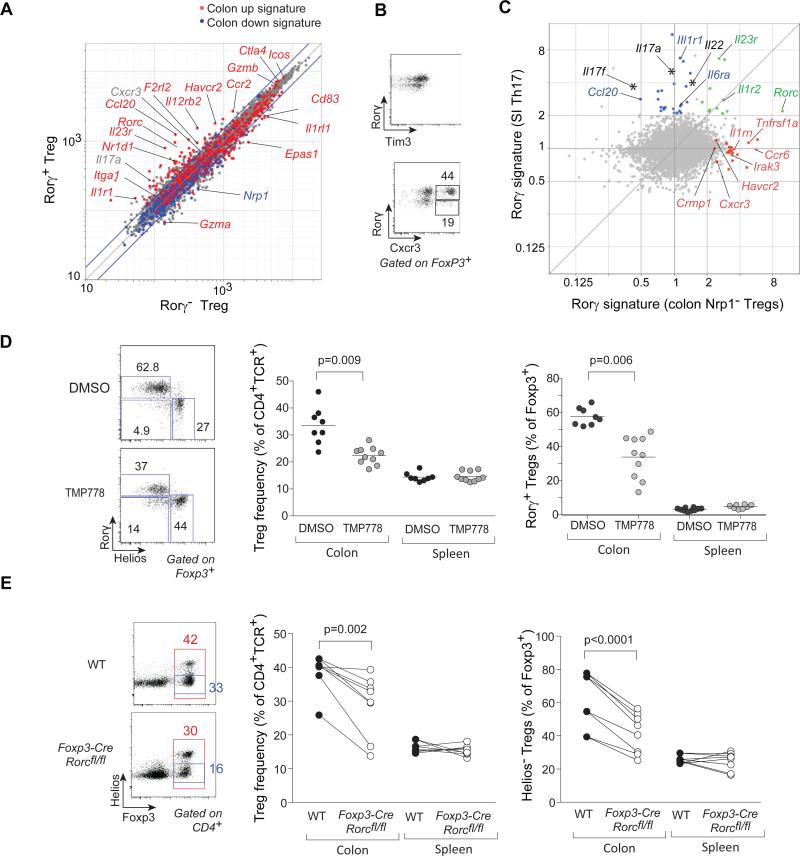
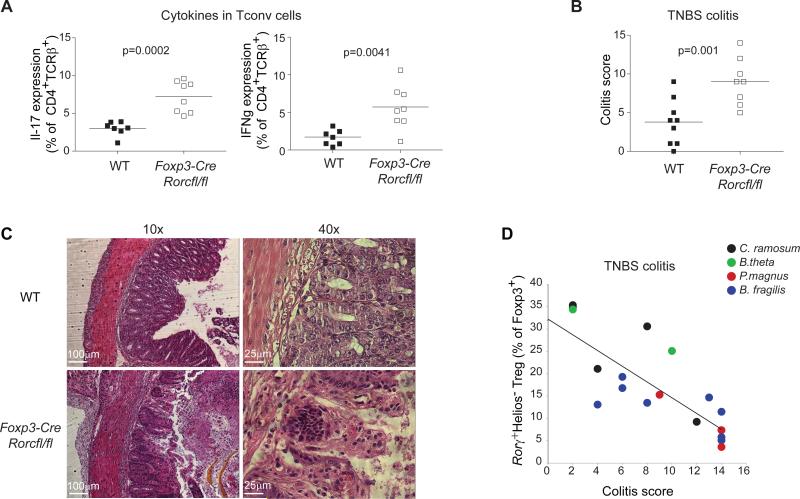
T regulatory cells that express the transcription factor Foxp3 (Foxp3(+) T(regs)) promote tissue homeostasis in several settings. We now report that symbiotic members of the human gut microbiota induce a distinct T(reg) population in the mouse colon, which constrains immuno-inflammatory responses. This induction—which we find to map to a broad, but specific, array of individual bacterial species—requires the transcription factor Rorγ, paradoxically, in that Rorγ is thought to antagonize FoxP3 and to promote T helper 17 (T(H)17) cell differentiation. Rorγ's transcriptional footprint differs in colonic T(regs) and T(H)17 cells and controls important effector molecules. Rorγ, and the T(regs) that express it, contribute substantially to regulating colonic T(H)1/T(H)17 inflammation. Thus, the marked context-specificity of Rorγ results in very different outcomes even in closely related cell types.


Figures

Figure 1
Figure 1. Rorγ, encoded by Rorc, is preferentially expressed in colonic Tregs
Gene expression profiles from purified Treg cells of various origins. A: Transcripts that are enriched in tissue and colonic Tregs. Top: transcripts differentially represented in tissue vs. splenic Tregs (at a FoldChange>2). Bottom: transcripts that are most biased in colonic Tregs (FoldChange>1.5 vs any other tissue Treg). Means of at least 2 duplicates. B: Transcription factors overrepresented in colonic Tregs vs other tissue and lymphoid organ Tregs. C: Representative flow cytometry plots of CD4+ T cells, and compilation of frequencies (right) of Rorγ+Helios Tregs within the FoxP3+CD4+TCRβ+ population. Each point is an individual mouse. Data representative of > 3 independent experiments. D: Representative Rorγ vs Helios, Nrp1, Il33R or Gata3 plots for colon or spleen Foxp3+CD4+TCRβ+ Tregs (see Fig. S2 for quantification). Each point is an individual mouse. Data representative of ≥ 3 independent experiments. E: Frequencies of Rorγ+Helios Tregs among FoxP3+CD4+TCRβ+ cells of different tissues (SI: small intestinal lamina propria; PP: Peyer's patches; MLN: mesenteric lymph nodes; scLN: subcutaneous lymph nodes). Each point is an individual mouse. Data pooled from at least 2 independent experiments. F: Flow cytometry analysis of human colon biopsies and frequencies of human RORγ+ Tregs within the FOXP3+CD4+CD8CD3+CD45+ population. Healthy tissue were endoscopically-determined normal areas from chronic constipation or irritable bowel syndrome patients; inflamed tissue from Crohn's lesions. Each point is an individual patient. Data pooled from 5 independent experiments). G: Il17a (PMA+ionomycin activation, intracellular staining) or Il17f (reporter in Il17frfp mice) expression among Foxp3+ Treg or FoxP3 Tconv Each point is an individual mouse. Data representative of independent 3 experiments.
Figure 2
Figure 2. Rorγ+Helios Tregs can be induced by several bacterial species
A: Frequency of Rorγ+Helios within colon FoxP3+CD4+TCRβ+ Tregs of SPF and germ free mice, p < 0.0001 as determined by Student's t test. Each point is an individual mouse. Data pooled from >3 experiments. B: Induction of Rorγ in colonic Tregs during post-natal development in SPF mice; left: Representative FACS plots; right: frequencies across ages of FoxP3+ Tregs within CD4+TCRβ+ cells, and Rorγ+Helios (red) and RorγHelios (black) cells within Tregs. Each point is an individual mouse. Data pooled from ≥ 4 experiments. C; SPF mice were treated with single (Neomycin, Vancomycin, Ampicillin, Metronidazole) or all four (VMNA) antibiotics for 4 weeks. Frequency of colonic Rorγ+Helios Tregs within the FoxP3+CD4+TCRβ+ population. p=0.0004, Bonferroni-corrected Student's t test. Each point is an individual mouse. Data pooled from 2 experiments. D: GF mice were colonized with single bacterial species and colonic Tregs analyzed after 2 weeks. Representative plots and frequencies of Rorγ+Helios within FoxP3+CD4+TCRβ+ Tregs, color-coded per phyla Each point is an individual mouse. Data representative 1-3 experiments for each microbe. *: Different from GF at an FDR<0.05.
Figure 3
Figure 3. Rorγ determines a specific signature and function in colonic Tregs
A: Rorγ+ or Rorγ Tregs were sorted from the colon of Foxp3thy1.1x Rorcgfp intercross male mice, and gene expression profiles determined. Expression values (triplicate averaged) are compared, highlighted according to the colon Treg signature of Fig. S1. B: Flow cytometric validation of some of the Rorγ+/Rorγ Tregs differential genes (Havcr2 which encodes TIM3, Cxcr3) (represent 2 experiments). C: Comparison by gene expression profiling of the Rorγ signature in different contexts (all mean of triplicates). X-axis: FoldChange between colonic Nrp1 Tregs from WT or Foxp3-cre x Rorcfl/fl mice; Y-axis: FoldChange between SI CD4+ T cells sorted from GF monocolonized with Th17-inducing SFB or from unmanipulated GF. Shared or specific signature genes are color-coded. D: SPF mice were treated with Rorγ antagonist TMP778 or control DMSO for 3 weeks. Representative cytometry plots of colonic Tregs (left) or compiled frequencies of FoxP3+ Tregs (middle) and of Rorγ+Helios (right) within FoxP3+CD4+TCRβ+ Tregs (right); ); p=0.009 as determined by Student's t test . Each point is an individual mouse. Data representative of ≥ 2 independent experiments. E: Analysis of Rorγ–deficient Tregs from Foxp3-cre x Rorcfl/fl mice or control (Foxp3-creRorc+/+) littermates. Cytometry plots of colonic Tregs (left) or compiled frequencies of FoxP3+ Tregs (middle) and of Rorγ+Helios (right) within FoxP3+CD4+TCRβ+ Tregs (right); p=0.002 (middle) and p< 0.0001 (right) as determined by paired Student's t test Each point is an individual mouse. Data representative of > 3 independent experiments.
Figure 4
Figure 4. Rorγ+ Tregs control gut inflammation
A: Frequency of Il17a and IFNγ expression in Foxp3CD4+ Tconv cells from Foxp3-cre x Rorcfl/fl mice and control Foxp3-cre x Rorc+/+ littermates at steady state; p=0.0002 and p=0.0041, paired Student's t test . Each point is an individual mouse. Data representative of ≥ 3 independent experiments. B/C: Colitis score (B) and histology (C) of Foxp3-cre x Rorcfl/fl mice and control Foxp3-cre x Rorc+/+ littermates challenged with TNBS, calculated based on weight loss, histologic score and other physical parameters; p=0.001 as determined by paired Student's t test . Each point is an individual mouse. Data representative of >3 independent experiments. D: Correlation between TNBS-colitis score (x-axis) with frequency of Rorγ+Helios within colonic Tregs in GF mice monocolonized for 2 weeks with bacteria that elicit different levels of Rorγ+Helios Tregs prior to TNBS colitis induction. Pearson r= 0.82, p<0.0001. Each point is an individual mouse. Data pooled from 4 experiments.

Comment in

References

    1. Josefowicz SZ, Lu LF, Rudensky AY. Regulatory T cells: mechanisms of differentiation and function. Annu. Rev. Immunol. 2012;30:531. - PMC - PubMed
    1. Feuerer M, et al. Lean, but not obese, fat is enriched for a unique population of regulatory T cells that affect metabolic parameters. Nat Med. 2009;15:930. - PMC - PubMed
    1. Cipolletta D, et al. PPAR-gamma is a major driver of the accumulation and phenotype of adipose tissue Treg cells. Nature. 2012;486:549. - PMC - PubMed
    1. Burzyn D, et al. A special population of regulatory T cells potentiates muscle repair. Cell. 2013;155:1282. - PMC - PubMed
    1. Ai TL, Solomon BD, Hsieh CS. T-cell selection and intestinal homeostasis. Immunol. Rev. 2014;259:60. - PMC - PubMed

Publication types

MeSH terms

Substances

Associated data