Comparative Study
. 2015 Aug 14;10(8):e0134572.
doi: 10.1371/journal.pone.0134572. eCollection 2015.

Comprehensive Analysis of the 16p11.2 Deletion and Null Cntnap2 Mouse Models of Autism Spectrum Disorder

Affiliations
Comparative Study

Comprehensive Analysis of the 16p11.2 Deletion and Null Cntnap2 Mouse Models of Autism Spectrum Disorder

Daniela Brunner et al. PLoS One. .

Abstract

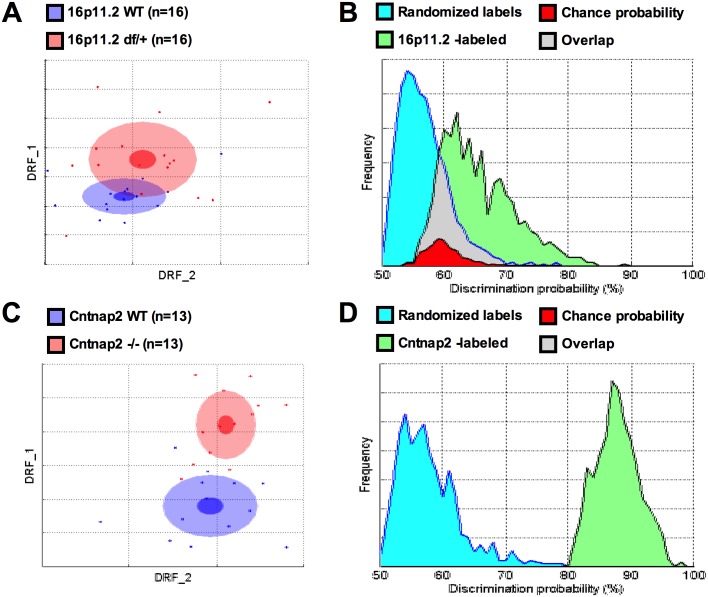
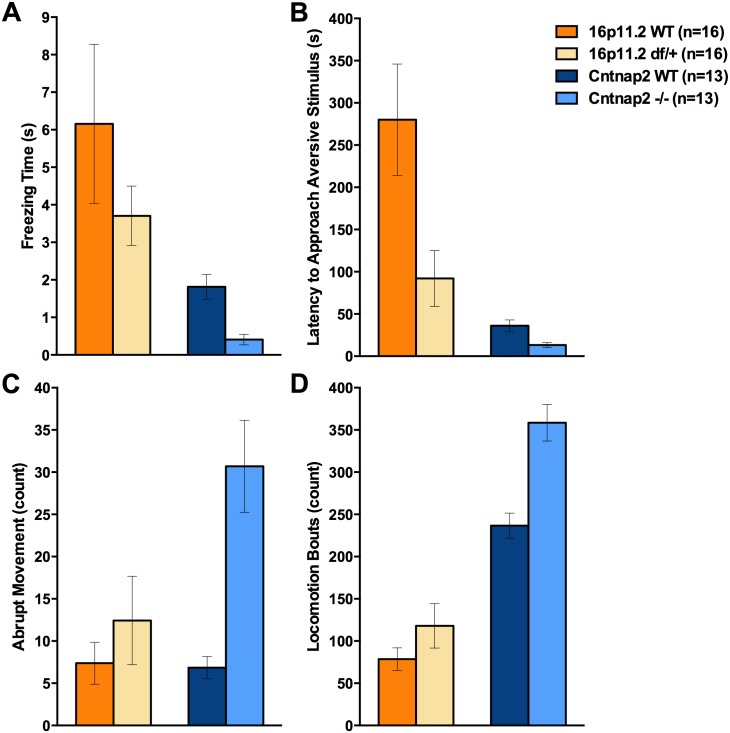
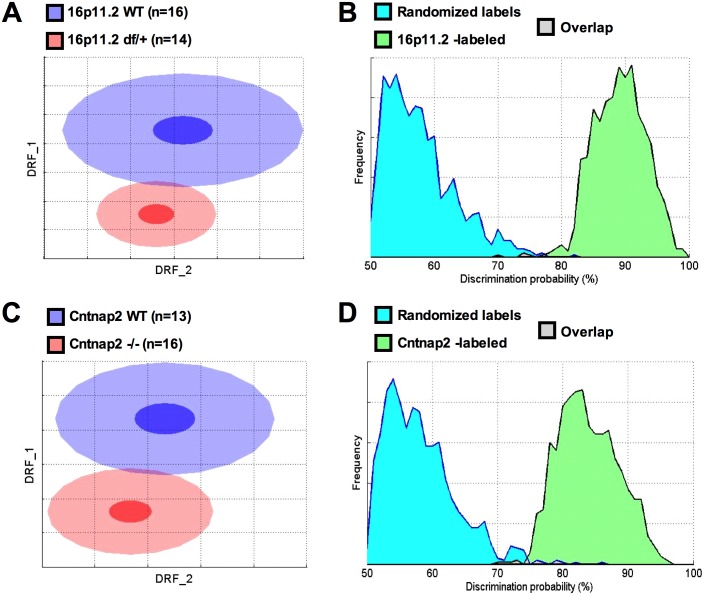
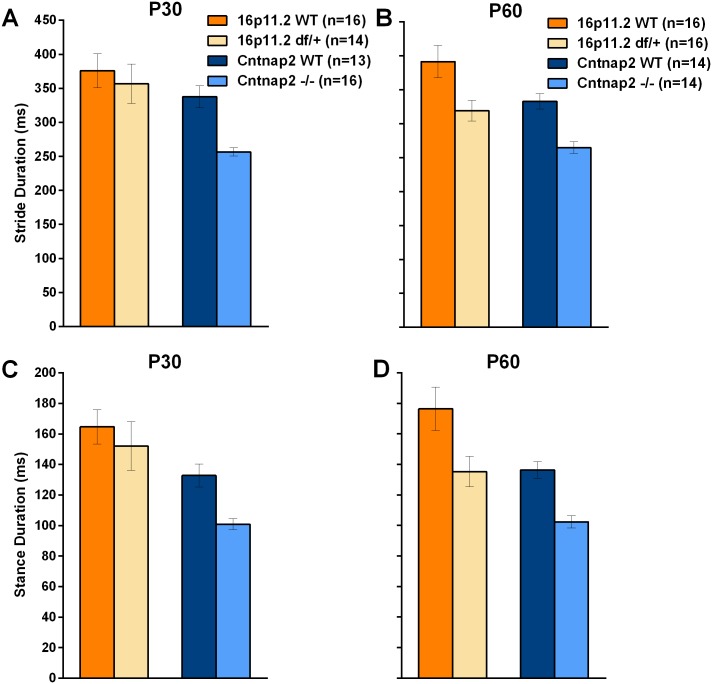
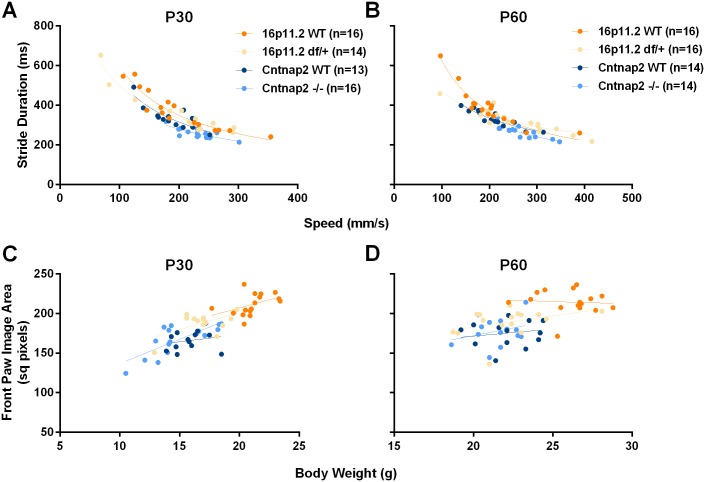
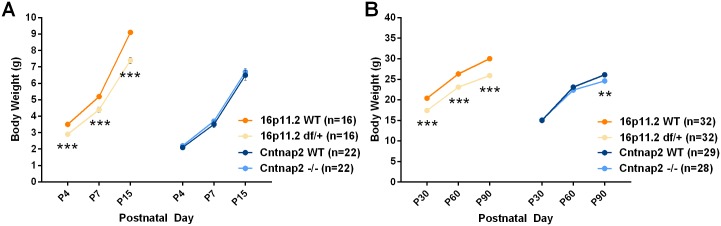
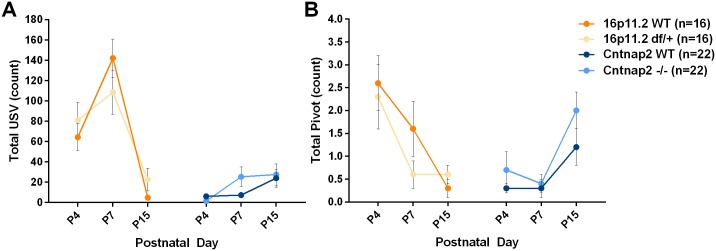
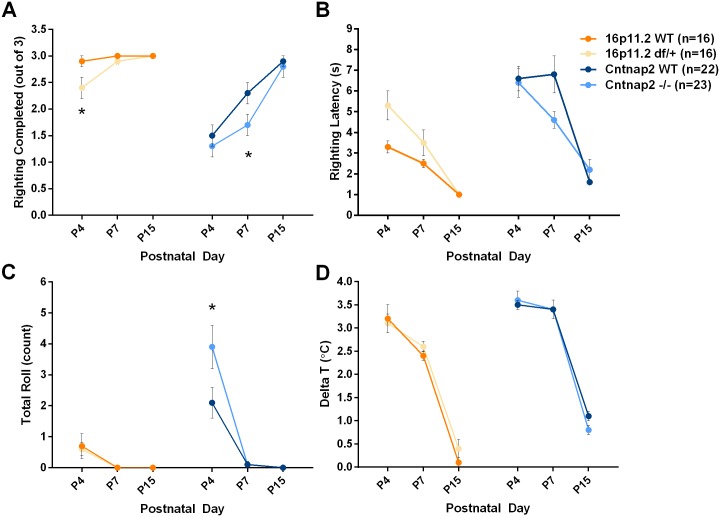
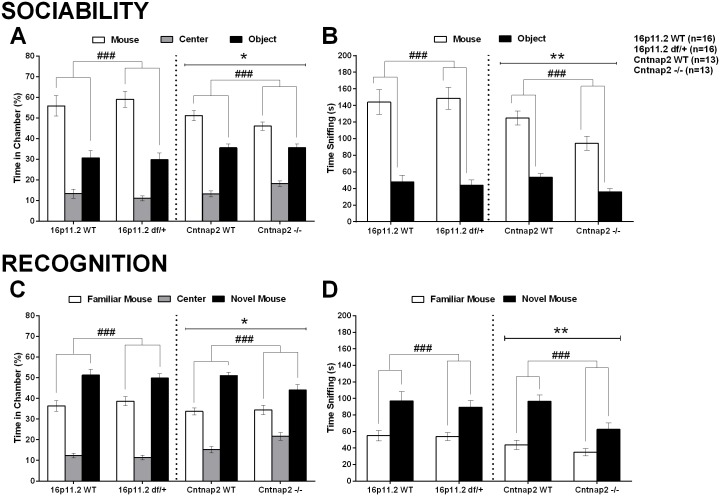
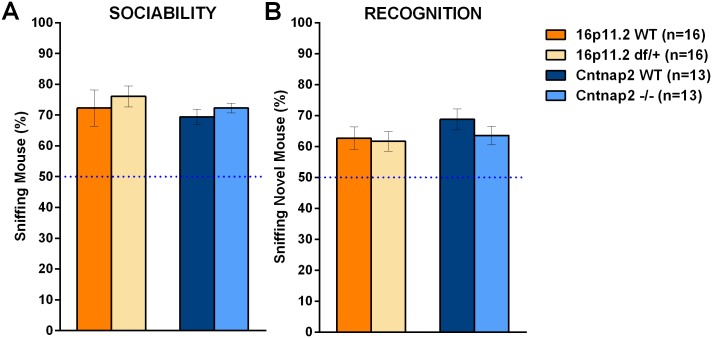
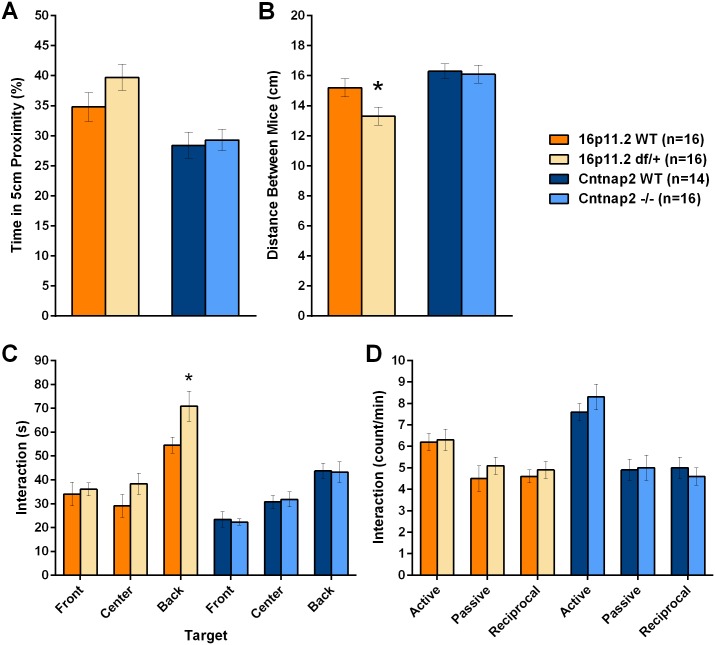
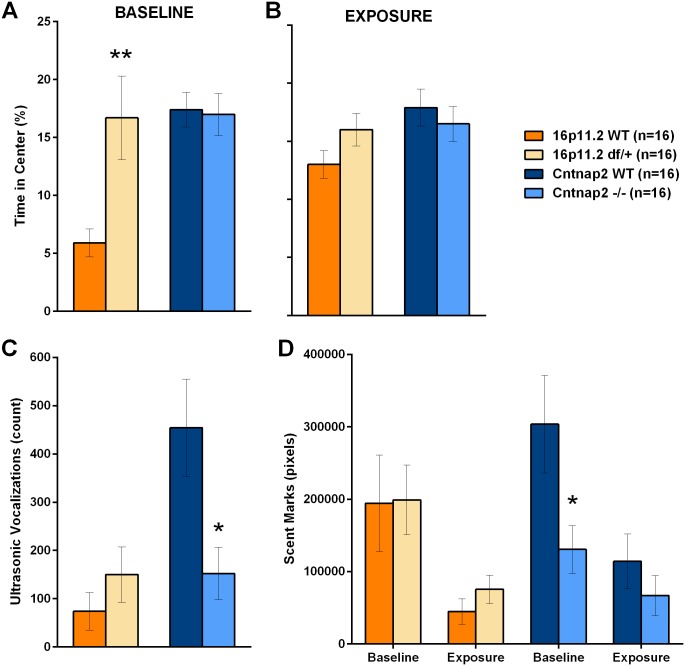
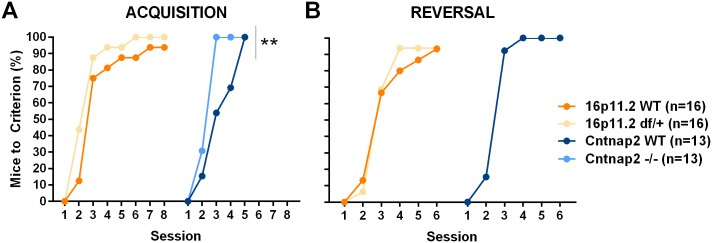
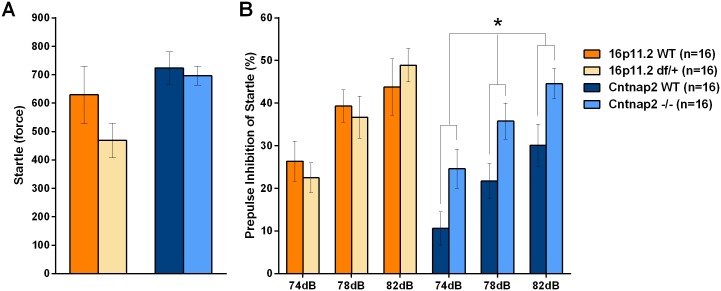
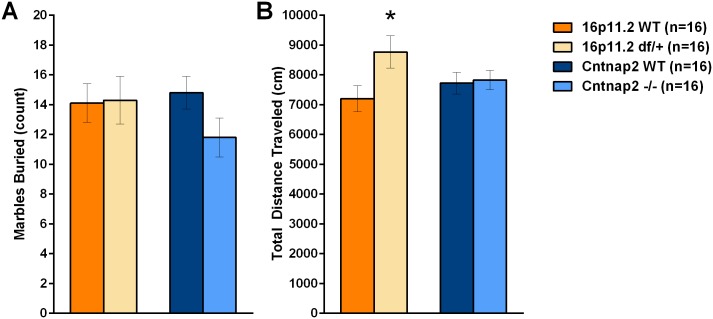
Autism spectrum disorder comprises several neurodevelopmental conditions presenting symptoms in social communication and restricted, repetitive behaviors. A major roadblock for drug development for autism is the lack of robust behavioral signatures predictive of clinical efficacy. To address this issue, we further characterized, in a uniform and rigorous way, mouse models of autism that are of interest because of their construct validity and wide availability to the scientific community. We implemented a broad behavioral battery that included but was not restricted to core autism domains, with the goal of identifying robust, reliable phenotypes amenable for further testing. Here we describe comprehensive findings from two known mouse models of autism, obtained at different developmental stages, using a systematic behavioral test battery combining standard tests as well as novel, quantitative, computer-vision based systems. The first mouse model recapitulates a deletion in human chromosome 16p11.2, found in 1% of individuals with autism. The second mouse model harbors homozygous null mutations in Cntnap2, associated with autism and Pitt-Hopkins-like syndrome. Consistent with previous results, 16p11.2 heterozygous null mice, also known as Del(7Slx1b-Sept1)4Aam weighed less than wild type littermates displayed hyperactivity and no social deficits. Cntnap2 homozygous null mice were also hyperactive, froze less during testing, showed a mild gait phenotype and deficits in the three-chamber social preference test, although less robust than previously published. In the open field test with exposure to urine of an estrous female, however, the Cntnap2 null mice showed reduced vocalizations. In addition, Cntnap2 null mice performed slightly better in a cognitive procedural learning test. Although finding and replicating robust behavioral phenotypes in animal models is a challenging task, such functional readouts remain important in the development of therapeutics and we anticipate both our positive and negative findings will be utilized as a resource for the broader scientific community.


Conflict of interest statement

Competing Interests: DB, PK, DH, KC, LT, TH, ES and VA are employees of PsychoGenics Inc., a Contract Research Organization performing the work. DB holds PsychoGenics shares, has patents related to PsychoGenics highthroughput technologies, board member of IRSF - TSCA, Editor-in-Chief IJCP. TH and VA hold PsychoGenics shares. DB and TH have patents related to partnered drug discovery. MS, WS, AG and BB are employees of Roche, whose company partly funded this study. WS, AG hold Roche shares. There are no patents, products in development or marketed products related to this study to declare. This does not alter the authors' adherence to all the PLOS ONE policies on sharing data and materials.

Figures

Fig 1
Fig 1. SmartCube found different degrees of separation between 16p11.2 df/+ and Cntnap2 -/- as compared to their control littermates.
A & C: To build a 2D representation of the multidimensional space in which the two groups are best separated, we first find statistically independent combinations of the original features, pick the two new composite features (drf 1 and 2) that best discriminate between the two groups, and used them as x- and y-axes (see S4 Methods). As in Principal Component Analyses, these two axes represent the combinations of uncorrelated feature transforms that account for most of the variance. Each dot represents either a WT (blue) or a mutant (red) mouse. The center, small and large ellipses are the mean, standard error and standard deviation of the composite features for each group. The overlap between the groups is used to calculate the discrimination index, which measures how reliably a classifier can be trained to discriminate between the two groups (the more overlap, the worse the discrimination). B & D: To estimate how likely it is that such separation is simply due to chance, the obtained classifier is challenged many times with correctly labeled samples (“WT” and “mutant”; see the green distribution) or with randomized labels (blue distribution). The overlap between these two distributions (in red) represents the probability of obtaining the observed discrimination by chance. A: The 16p11.2 df/+ standard deviation ellipse overlaps considerably with the WT control ellipse. Note the spread and position variability of the individual mice; B: A 65% discrimination between 16p11.2 df/+ and WT mice could be found by chance with p < .12; C: The Cntnap2 -/- model separates well from the WT group; D: A 88% discrimination index for the Cntnap2 -/- versus WT comparison can be found by chance with p < .0002.
Fig 2
Fig 2. SmartCube found the behavioral features that showed larger contributions to an overall discrimination.
A: Both 16p11.2 df/+ mice and Cntnap2 -/- tended to freeze less than their corresponding WT mice; B: Both 16p11.2 df/+ and Cntnap2 -/- mice tended to approach a stimulus faster than their corresponding WT mice; C: Cntnap2 -/- mice showed considerably more abrupt movements than WT mice; D: Cntnap2 -/- showed more locomotion bouts as compared to the WT mice.
Fig 3
Fig 3. NeuroCube found similar degrees of separation between 16p11.2 df/+ and Cntnap2 -/- as compared to their corresponding WT control littermates.
A & C: To build a 2D representation of the multidimensional space in which the two groups are best separated, we first find statistically independent combinations of the original features, pick the two new composite features (drf 1 and 2) that best discriminate between the two groups, and used them as x- and y-axes (see S4 Methods). As in Principal Component Analyses, these two axes represent the uncorrelated feature transformations that account for most of the variance. Each dot represents either a WT (blue) or a mutant (red) mouse. The center, small and large ellipses are the mean, standard error and standard deviation of the composite features for each group. The overlap between the groups is used to calculate the discrimination index, which indicates how reliably a classifier can be trained to discriminate between the two groups (the more overlap, the worse the discrimination). B & D: To estimate how likely it is that such separation is simply due to chance, the obtained classifier is challenged many times with correctly labeled samples (“WT” and “mutant”; see the green distribution) or with randomized labels (blue distribution). The overlap between these two distributions (in red) represents the probability of obtaining the observed discrimination by chance. A: At P30 the 16p11.2 df/+ standard deviation ellipse overlapped to a small extent with the WT control ellipse; B: An 89% discrimination between 16p11.2 df/+ and WT mice could be found by chance with p< .0003; C: At P30 the Cntnap2 -/- model separated well from the WT group; D: An 84% discrimination index can be found by chance with p< .003.
Fig 4
Fig 4. A: Stride duration was shorter for the Cntnap2 -/- mice than WT controls at the two ages studied.
In the 16p11.2 df/+ mice this was true only at P60; B: Stance duration showed the same pattern. Data shown are means ± SEM.
Fig 5
Fig 5. Correlation analysis of gait features as a function of speed or body weight.
A & B: Stride duration as measured in NeuroCube showed a non-linear correlation with locomotor speed, i.e., the faster a mouse runs the shorter the stride duration. The lines show power regressions, which provided the best fit; C & D: The surface of the front paw image was linearly related to the body weight of the mouse suggesting that differences in this top feature could be secondary to differences in body weight, in particular for the 16p11.2 df/+ mice as they weigh significantly less than their controls (Fig 6B).
Fig 6
Fig 6. Body weight during neonatal (A) and postnatal (B) periods.
Simple main effect analysis following a significant Genotype x Age interaction showed significant reductions as compared to corresponding WT controls. Note errors bars are hidden by the graphing symbols. Data shown are means ± SEM. (**p < .01, ***p < .001).
Fig 7
Fig 7. Isolation-induced vocalization and behavior.
During the isolation test mice were separated from the dams and individually tested in a clean cage. A: Neonatal ultrasonic vocalizations (USVs) were more frequent in the 16p11.2 WT and df/+ mice than in the Cntnap2 WT and-/- mice, although there were no genotypic differences for either model; B: Pivoting, normally associated with the production of USVs, did not show genotypic differences either. Data shown are means ± SEM.
Fig 8
Fig 8. Motor coordination and thermoregulation during the neonatal test.
In the righting test mice are placed upside down three times and allowed to right until they are on all four limbs. During the isolation test the number of times mice fall on their sides or roll is used as another measure of motor coordination. Thermoregulation is measured by taking axillary temperature before and after the isolation test. A: Number of righting successes; B: righting latency; C: Number of rolls on a side; D: Difference between the axillary temperature measurements before and after the isolation test. Data shown are means ± SEM. (*p < .05).
Fig 9
Fig 9. Mouse preference for a social stimulus versus a non-social stimulus (sociability) and recognition of a social stimulus in the three-chamber test.
A: During the sociability phase the percent time spent in each of the three chambers showed that all groups spent more time in the social chamber as shown by a significant Chamber Type main effect (in a 2-way mixed model Genotype x Chamber Type ANOVA). The Cntnap2 -/- mice spent less time in the side chambers compared to the WT control mice as shown by a significant Genotype main effect (with no significant Genotype x Chamber Type interaction). B: During the sociability phase all groups sniffed more the social container as shown by a significant Stimulus Type main effect (in a 2-way mixed model Genotype x Stimulus Type ANOVA). The Cntnap2 -/- mice spent overall less time sniffing than the WT control mice as shown by a significant Genotype main effect (with no significant Genotype x Stimulus Type interaction). C: During the recognition phase the percent time spent in each of the three chambers showed that all groups spent more time in the novel mouse chamber than in the familiar mouse chamber. The Cntnap2 -/- mice again spent less time in the side chambers compared to the WT control mice (analysis as in A). D. During the recognition phase all groups sniffed more the novel social container. The Cntnap2 -/- mice again spent overall less time sniffing than the WT control mice (analysis as in B). Time in each chamber was recorded automatically, whereas sniffing time was scored manually Data shown are means ± SEM. (Chamber or Stimulus Type main effect: ###p < .001; Genotype main effect: *p < .05, **p < .01).
Fig 10
Fig 10. Proportion of total time sniffing a stimulus in the three-chamber social test.
In the three-chamber social test the proportion of the total time sniffing the novel mouse or an alternative (social or not) can be used as a measure of preference, with a dashed line at 50% indicating a lack of preference. A: All groups showed a strong preference for the social stimulus without any genotype effects; B: All groups showed a strong preference for the novel social stimulus, with no genotype effects. Sniffing was scored manually. Data shown are means ± SEM.
Fig 11
Fig 11. The reciprocal social interaction test did not show deficits in social behavior in either model.
A: The time in which the mice were closer than 5 cm was similar for the two mutants as compared to their respective WT controls. All behaviors with the exception of the active, passive and reciprocal interactions were recorded using an automated system. B: During social interactions, 16p11.2 df/+ pairs were closer to each other as compared to the WT control pairs, whereas Cntnap2 -/- pairs did not show a difference compared to their corresponding WT control pairs; C: Number of interactions of the nose of a mouse towards the front, side or back of the paired mouse. 16p11.2 df/+ mice showed a slight increase in the number of interactions, but only for the interactions towards the back. Cntnap2 -/- mice were similar to their control WT mice; D: Active, passive and reciprocal interactions were similar between mutants and their respective controls. Data shown are means ± SEM. (*p < .05).
Fig 12
Fig 12. Activity, vocalizations and marking in the urine-exposure open field.
Female-experienced male mice are first habituated to an arena and then presented with a small quantity of urine from a female in estrous. A: During the baseline session 16p11.2 df/+ mice explored the center of the arena more than the WT mice, whereas Cntnap2 -/- showed no differences from its WT control; B: during the exposure session all groups explored the center similarly; C: Ultrasonic vocalizations emitted during the exposure session showed deficits in the Cntnap2 -/- mice but not in the 16p11.2 df/+ as compared to their WT controls; D: Similarly, Cntnap2 -/-, but not 16p11.2 df/+ mice, showed deficits in scent marking during both baseline and urine exposure. Data shown are means ± SEM. (*p < .05; **p < .01).
Fig 13
Fig 13. Acquisition and reversal in the procedural T-maze.
In the procedural T-maze mice are trained to reach a platform on one side of the maze. After they perform correctly 6 out of 8 trials in two consecutive days, the platform position is reversed and mice are trained under the new rule. A: The proportion of mice that reached criteria during the acquisition (maximum 8 days) shows that there were no deficits in the 16p11.2 df/+ mice but Cntnap2 -/- mice learned the task faster; B: during reversal (6 days maximum) there were no deficits either. Note the reversal data for Cntnap2 WT mice are identical to that of the Cntnap2 -/- mice. Data shown are proportions of mice that started the task (Genotype Factor, Survival Analysis, Chi Square: **p < .01).
Fig 14
Fig 14. Prepulse inhibition of startle in the two models.
PPI reflects the % decrease in startle to a sound when preceded by a quieter pre-pulse sound. A: Both mutant groups showed startle responses (arbitrary unit) similar to those of their WT control mice; B: Cntnap2 -/- but not 16p11.2 mice showed stronger prepulse inhibition of startle than the corresponding WT control mice. Data shown are means ± SEM. (*p < .05).
Fig 15
Fig 15. Number of marbles and activity in the marble burying test.
In the marble burying test mice are presented with a novel diggable medium. Marbles are placed on the surface to help quantify the amount of digging shown by the mice. A: Number of marbles buried was not different between the mutants and their respective WT controls; B: Locomotor activity in 16p11.2 df/+ mice was greater than that WT control mice, whereas the Cntnap2 -/- mice were as active as the corresponding WT mice. Data shown are means ± SEM. (*p < .05).

References

    1. Menalled L, El-Khodor BF, Patry M, Suarez-Farinas M, Orenstein SJ, Zahasky B, et al. Systematic behavioral evaluation of Huntington's disease transgenic and knock-in mouse models. Neurobiol Dis. 2009;35(3):319–36. Epub 2009/05/26. S0969-9961(09)00107-7 [pii] 10.1016/j.nbd.2009.05.007 - DOI - PMC - PubMed
    1. Sanders SJ, Murtha MT, Gupta AR, Murdoch JD, Raubeson MJ, Willsey AJ, et al. De novo mutations revealed by whole-exome sequencing are strongly associated with autism. Nature. 2012;485(7397):237–41. Epub 2012/04/13. nature10945 [pii] 10.1038/nature10945 - DOI - PMC - PubMed
    1. O'Roak BJ, Vives L, Girirajan S, Karakoc E, Krumm N, Coe BP, et al. Sporadic autism exomes reveal a highly interconnected protein network of de novo mutations. Nature. 2012;485(7397):246–50. Epub 2012/04/13. nature10989 [pii] 10.1038/nature10989 - DOI - PMC - PubMed
    1. Iossifov I, Ronemus M, Levy D, Wang Z, Hakker I, Rosenbaum J, et al. De novo gene disruptions in children on the autistic spectrum. Neuron. 2012;74(2):285–99. Epub 2012/05/01. S0896-6273(12)00340-6 [pii] 10.1016/j.neuron.2012.04.009 - DOI - PMC - PubMed
    1. Consortium TD-BFX. Fmr1 knockout mice: a model to study fragile X mental retardation. Cell. 1994;78(1):23–33. Epub 1994/07/15. 0092-8674(94)90569-X [pii]. . - PubMed

Publication types