. 2015 Aug 14;10(8):e0135552.
doi: 10.1371/journal.pone.0135552. eCollection 2015.

Osteopontin Deficiency Accelerates Spontaneous Colitis in Mice with Disrupted Gut Microbiota and Macrophage Phagocytic Activity

Affiliations

Osteopontin Deficiency Accelerates Spontaneous Colitis in Mice with Disrupted Gut Microbiota and Macrophage Phagocytic Activity

Takahiko Toyonaga et al. PLoS One. .

Abstract

Background: Osteopontin (OPN) is a multifunctional protein expressed in a variety of tissues and cells. Recent studies revealed increased OPN expression in the inflamed intestinal tissues of patients with inflammatory bowel disease (IBD). The role of OPN in the pathophysiology of IBD, however, remains unclear.

Aims: To investigate the role of OPN in the development of intestinal inflammation using a murine model of IBD, interleukin-10 knock out (IL-10 KO) mice.

Methods: We compared the development of colitis between IL-10 KO and OPN/IL-10 double KO (DKO) mice. OPN expression in the colonic tissues of IL-10 KO mice was examined by fluorescence in situ hybridization (FISH) analysis. Enteric microbiota were compared between IL-10 KO and OPN/IL-10 DKO mice by terminal restriction fragment length polymorphism analysis. The effect of OPN on macrophage phagocytic function was evaluated by phagocytosis assay.

Results: OPN/IL-10 DKO mice had an accelerated onset of colitis compared to IL-10 KO mice. FISH analysis revealed enhanced OPN synthesis in the colonic epithelial cells of IL-10 KO mice. OPN/IL-10 DKO mice had a distinctly different enteric bacterial profile with a significantly lower abundance of Clostridium subcluster XIVa and a greater abundance of Clostridium cluster XVIII compared to IL-10 KO mice. Intracellular OPN deletion in macrophages impaired phagocytosis of fluorescence particle-conjugated Escherichia coli in vitro. Exogenous OPN enhanced phagocytosis by OPN-deleted macrophages when administered at doses of 1 to 100 ng/ml, but not 1000 ng/ml.

Conclusions: OPN deficiency accelerated the spontaneous development of colitis in mice with disrupted gut microbiota and macrophage phagocytic activity.


Conflict of interest statement

Competing Interests: AI & KN are employees of Morinaga Milk Industry Co., Ltd. There are no patents, products in development or marketed products to declare. This does not alter the authors’ adherence to all the PLOS ONE policies on sharing data and materials.

Figures

Fig 1
Fig 1. The accelerated onset of colitis in OPN/IL-10 DKO mice compared to IL-10 KO mice.
(A) Representative HE-staining images of rectal tissues from OPN KO mice at 4, 8, and 12 weeks of age. Scale bar = 100 μm. wk, week of age. (B) Gene expression of OPN in rectal tissues of WT and IL-10 KO mice. N = 6 for each group. Gene expression of OPN was normalized by GAPDH. (C) Time-dependent changes in clinical score of IL-10 KO and OPN/IL-10 DKO mice. N = 10 for each group. (D) Time-dependent changes in histologic scores (left) and representative HE-staining images of rectal tissues from IL-10 KO and OPN/IL-10 DKO mice at 4 weeks of age (right). N = 10 for each group. Scale bar = 100 μm. (E) Gene expression of IL-6, IFN-γ, and IL-17A in rectal tissues from IL-10 KO and OPN/IL-10 DKO mice at 4 weeks of age. N = 6 for each group. Gene expression of each target molecule was normalized by GAPDH. Error bars represent SD. *P<0.05 compared with WT (B) and IL-10 KO (C-E) mice by non-parametric Mann-Whitney U test.
Fig 2
Fig 2
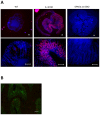
(A) Enhanced OPN mRNA synthesis in the colonic tissues of IL-10 KO mice. Representative images of FISH for OPN mRNA in the rectal tissues from WT, IL-10 KO, and OPN/IL-10 DKO mice at 4 weeks of age. Scale bar = 100 μm. (B) Enhanced OPN expression localized to the colonic epithelial cells. Representative images of FISH for OPN mRNA (red) and immunofluorescent staining for E-cadherin (green) in the rectal tissues from IL-10 KO mice at 4 weeks of age. Scale bar = 100 μm.
Fig 3
Fig 3. Difference in enteric bacterial composition between IL-10 KO and OPN/IL-10 DKO mice.
(A) T-RFLP profiles of fecal samples from IL-10 KO and OPN/IL-10 DKO mice at 3 weeks of age. N = 6 for each group. (B) Principal component analysis of the T-RFLP profiles. N = 6 for each group. PC, principal component.
Fig 4
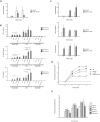
Fig 4. The impact of OPN on cytokine production and phagocytic function of macrophages.
(A) Gene expression of CD11b in rectal tissues from IL-10 KO and OPN/IL-10 DKO mice at 4, 8, and 12 weeks of age. N = 5 for each group. Gene expression of CD11b was normalized by GAPDH. Error bars represent SD. *P<0.05 compared with IL-10 KO mice by non-parametric Mann-Whitney U test. (B) Cytokine production from BMDMs obtained from WT, OPN KO, IL-10 KO, and OPN/IL-10 DKO mice after stimulation with Pam3CSK4 (50 to 500 ng/ml), LPS (100 ng/ml), or ODN1585 (500 nM). N = 6 for each group. Error bars represent SEM. *P<0.05, one-way ANOVA with Bonferroni’s correction. (C) Gene expression of NOS2, TNF-α, and IL-12p40 in LPMCs isolated from IL-10 KO and OPN/IL-10 DKO mice at 4, 8, and 12 weeks of age. N = 4 for each group. Gene expression of each target molecule was normalized by GAPDH. Error bars represent SD. *P<0.05 compared with IL-10 KO mice by non-parametric Mann-Whitney U test. (D) Changes of fluorescence intensity in TEPMs from WT, OPN KO, IL-10 KO, and OPN/IL-10 DKO mice after challenged with fluorescent particle conjugated-E.coli. Fluorescence intensity was measured at the indicated times and is shown in arbitrary units (AU). N = 6 for each group. Error bars represent SEM. *P<0.05 compared with TEPMs from WT mice; ✝P<0.05 compared with IL-10 KO mice by one-way ANOVA with Bonferroni’s correction. (E) Changes of fluorescence intensity in TEPMs from OPN KO mice after challenged with fluorescence particle conjugated-E.coli with or without recombinant OPN (rOPN) at 1, 10, 100, and 1000 ng/ml. Fluorescence intensity was measured at the indicated times and is shown in arbitrary units (AU). N = 6 for each group. Error bars represent SEM. *P<0.05 compared to TEPMs from OPN KO mice without rOPN (0 ng/ml) by one-way ANOVA with Bonferroni’s correction.

References

    1. Oldberg A, Franzén A, Heinegård D (1986) Cloning and sequence analysis of rat bone sialoprotein (osteopontin) cDNA reveals an Arg-Gly-Asp cell-binding sequence. Proc Natl Acad Sci USA 83: 8819–8823. - PMC - PubMed
    1. Brown LF, Berse B, Van de Water L, Papadopoulos-Sergiou A, Perruzzi CA, Manseau EJ, et al. (1992) Expression and distribution of osteopontin in human tissues: widespread association with luminal epithelial surfaces. Mol Biol Cell 3: 1169–1180. - PMC - PubMed
    1. Rittling SR (2011) Osteopontin in macrophage function. Expert Rev Mol Med 26:13. - PubMed
    1. Zhu B, Suzuki K, Goldberg HA, Rittling SR, Denhardt DT, McCulloch CA, et al. (2004) Osteopontin modulates CD44-dependent chemotaxis of peritoneal macrophages through G-protein-coupled receptors: evidence of a role for an intracellular form of osteopontin. J Cell Physiol 198: 155–167. - PubMed
    1. Shinohara ML, Lu L, Bu J, Werneck MB, Kobayashi KS, Glimcher LH, et al. (2006) Osteopontin expression is essential for interferon-alpha production by plasmacytoid dendritic cells. Nat Immunol 7: 498–506. - PMC - PubMed

Publication types